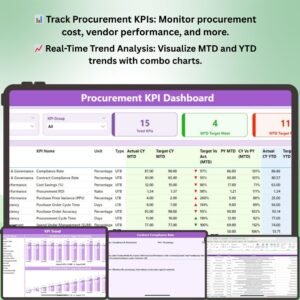
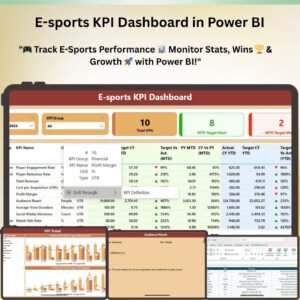
The Hospitality KPI Dashboard in Power BI is an essential tool for hospitality managers, hotel owners, and operations teams who want to monitor and optimize the performance of their hospitality business. This Power BI dashboard helps you track critical key performance indicators (KPIs) related to occupancy, revenue, guest satisfaction, and operational efficiency—all in one place.
With real-time data, interactive visuals, and customizable features, this dashboard enables you to gain actionable insights that drive better decision-making. Whether you’re managing a hotel, resort, or any hospitality service, this tool allows you to assess the effectiveness of your operations, identify areas for improvement, and take the right actions to boost overall performance and profitability.
Key Features of the Hospitality KPI Dashboard in Power BI
🏨 Monitor Hotel Occupancy & Room Revenue
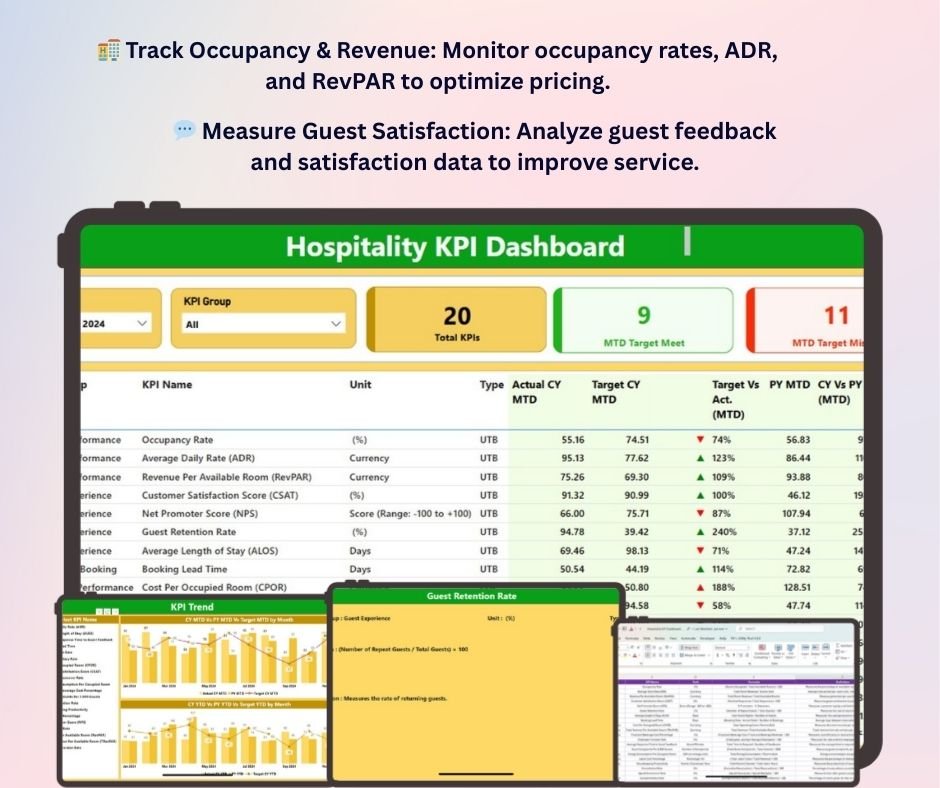
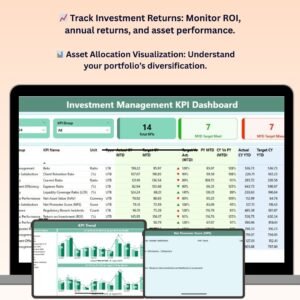
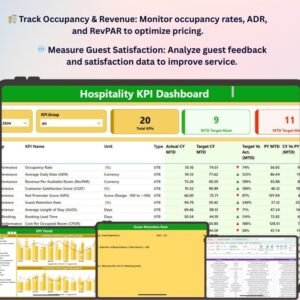
Track occupancy rates, average daily rates (ADR), revenue per available room (RevPAR), and room sales. Identify trends in occupancy to optimize pricing strategies and maximize revenue.
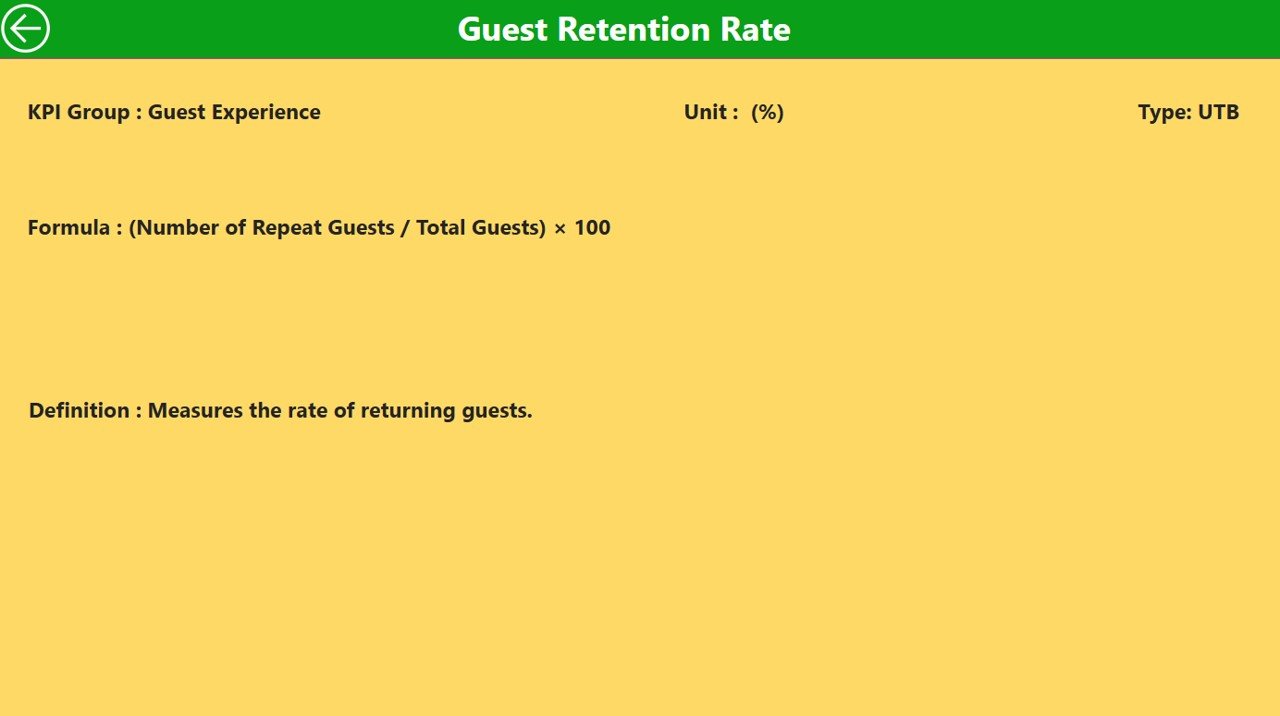
💬 Guest Satisfaction Tracking
Measure guest satisfaction levels by analyzing feedback, reviews, and survey results. Gain insights into areas where your services are excelling and where improvement is needed.
📊 Operational Efficiency Metrics
Monitor operational KPIs such as staff performance, service delivery time, and guest check-in/check-out processes. Track these metrics to streamline operations and enhance service quality.
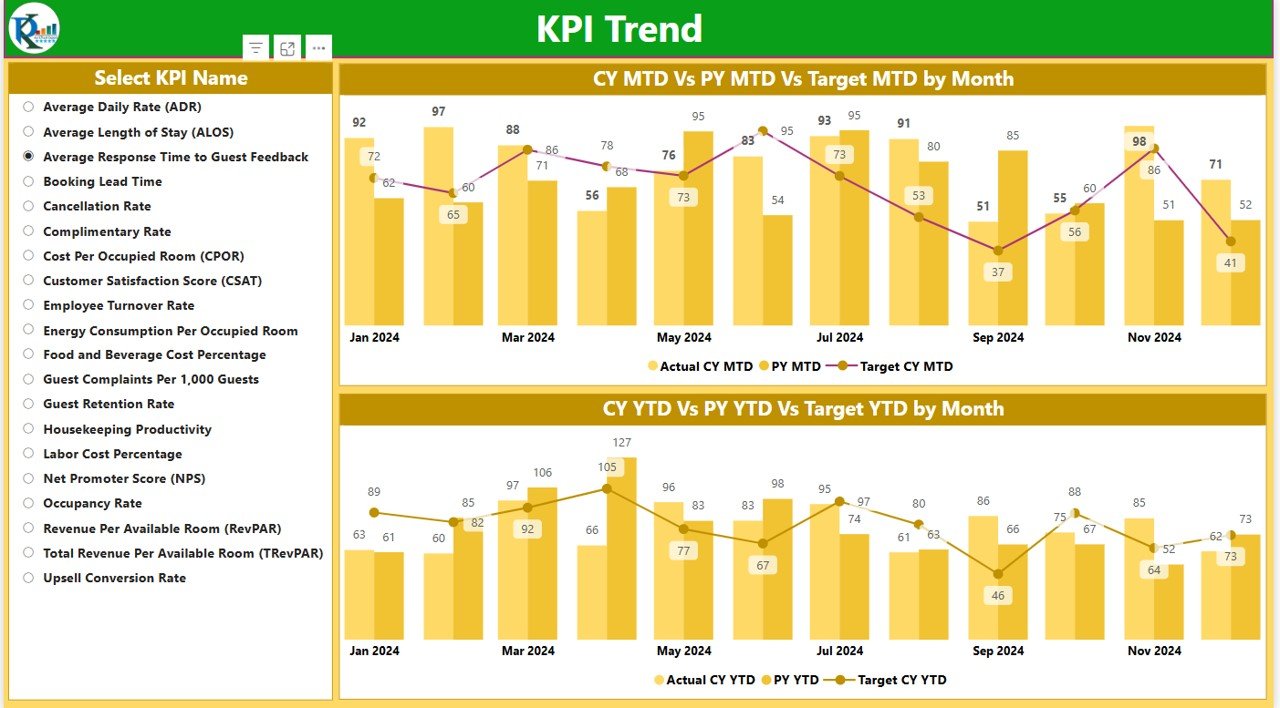
📅 Seasonality & Trends Analysis
Use historical data to assess trends in bookings, revenue, and occupancy. Identify peak seasons and adjust marketing strategies to maximize revenue during high-demand periods.
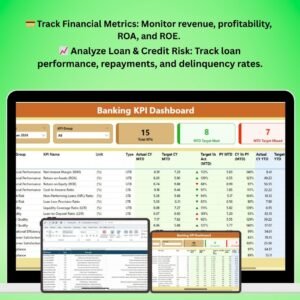
📈 Financial Metrics & Profitability
Analyze financial KPIs, including total revenue, cost per room, and profit margins. Track the financial health of your business and identify areas to reduce costs and improve profitability.
🖥️ Customizable & User-Friendly Interface
Fully customizable, this dashboard allows you to adjust KPIs, time periods, and visualizations to suit your unique hospitality needs. Whether you manage a boutique hotel or a large resort, the dashboard adapts to your requirements.
Why You’ll Love the Hospitality KPI Dashboard in Power BI

✅ Optimize Revenue & Occupancy
By tracking occupancy, ADR, and RevPAR, you can optimize pricing strategies and manage your inventory effectively to increase room revenue.
✅ Enhance Guest Experience
Use guest feedback and satisfaction data to continuously improve service quality and exceed customer expectations. Happy guests lead to better reviews and repeat business.
✅ Boost Operational Efficiency
By monitoring operational performance, you can streamline processes, reduce bottlenecks, and improve service delivery, leading to enhanced guest satisfaction and staff productivity.
✅ Make Data-Driven Decisions
With real-time insights and customizable visualizations, you can make informed decisions that drive business growth. Stay ahead of trends and quickly adjust strategies to meet your business objectives.
✅ Fully Customizable & Scalable
Whether you manage a single property or a large hospitality chain, the dashboard is fully customizable to meet your needs. Add or remove KPIs, adjust visualizations, and scale the dashboard as your business grows.
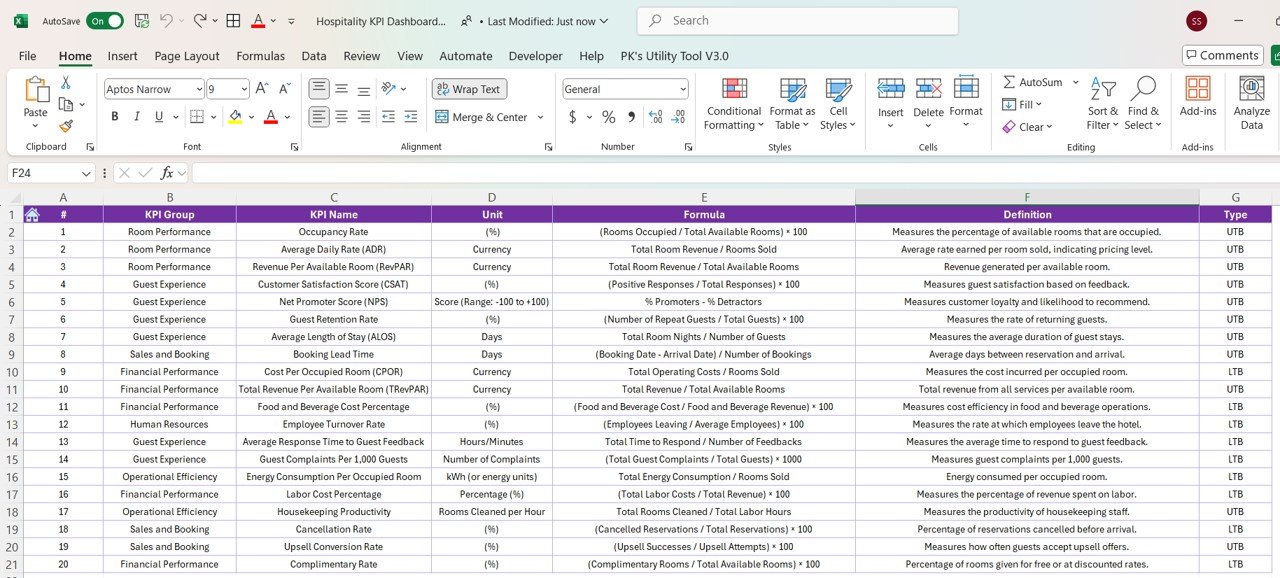
What’s Inside the Hospitality KPI Dashboard Template in Power BI?
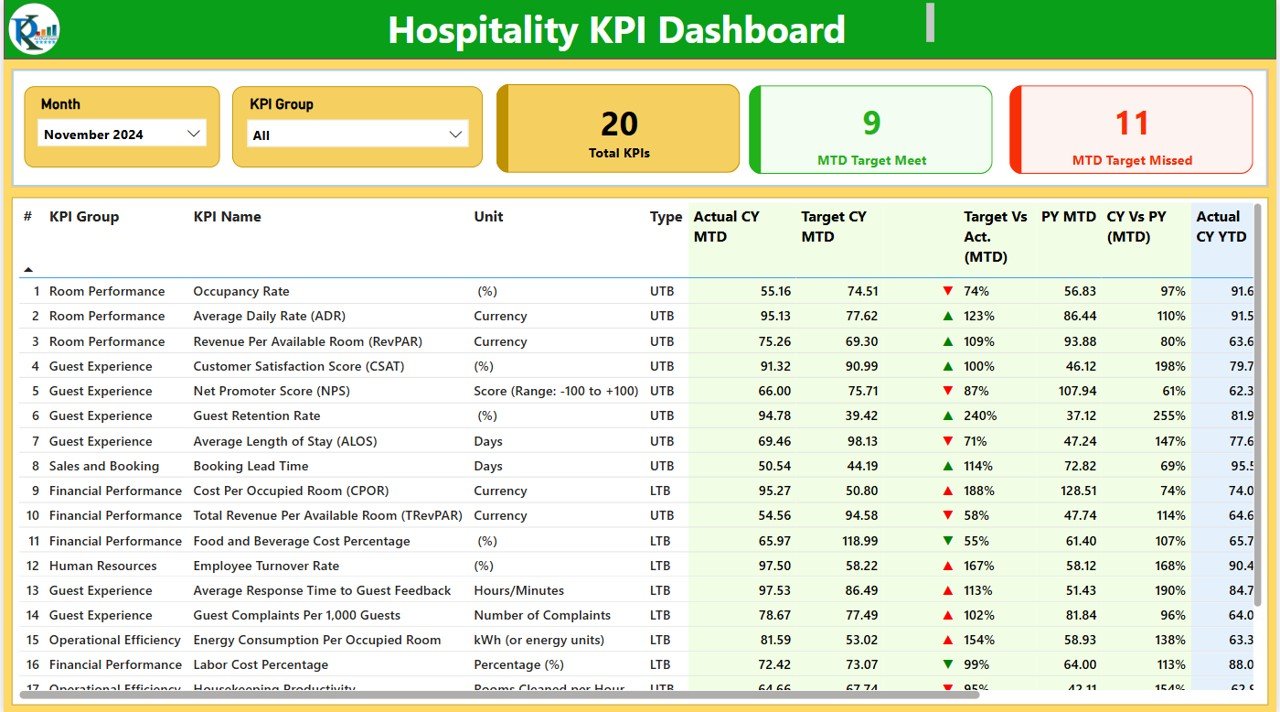
- Hotel Occupancy & Revenue Tracking: Monitor occupancy rates, ADR, and RevPAR for better pricing and revenue management.
- Guest Satisfaction Insights: Analyze customer feedback, surveys, and reviews to measure guest satisfaction.
- Operational Efficiency Metrics: Track KPIs related to staff performance and service delivery time.
- Financial Metrics: Monitor profitability with metrics like revenue, cost per room, and profit margins.
- Seasonality & Trend Analysis: Identify seasonal trends to adjust pricing and marketing strategies.
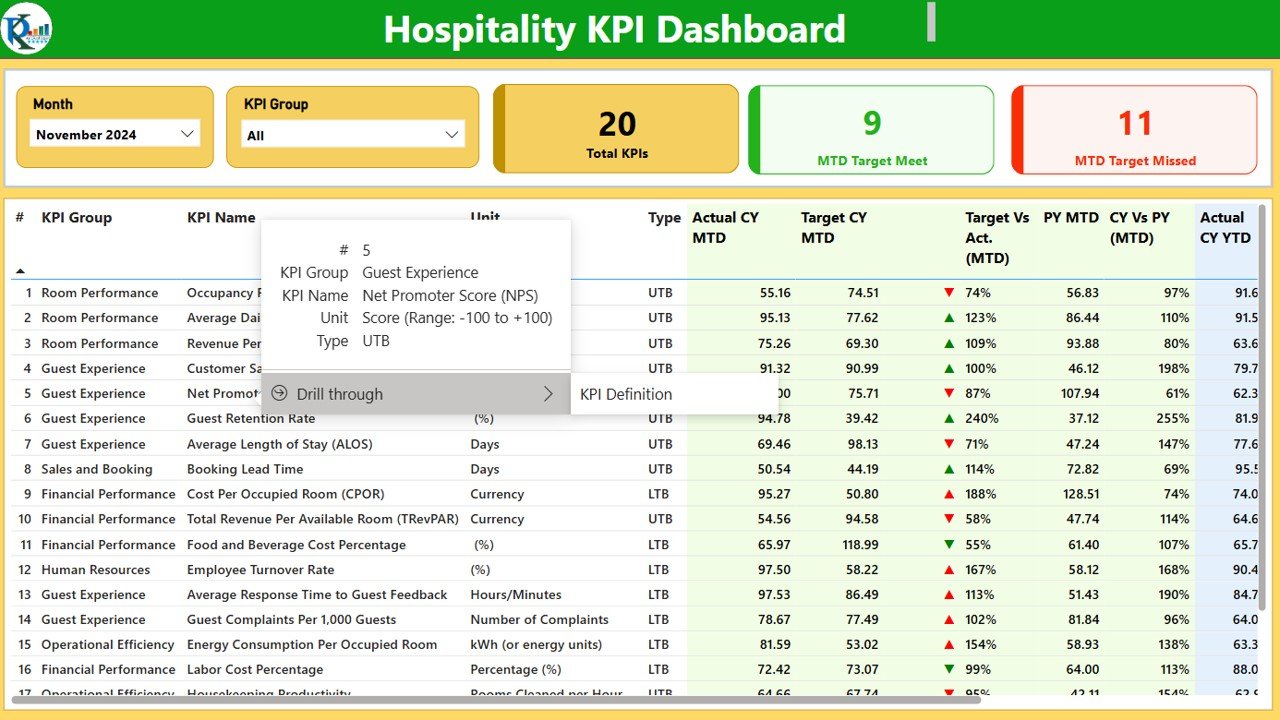
- Customizable Reports & Visualizations: Adjust KPIs, time periods, and data points to suit your hospitality business.
How to Use the Hospitality KPI Dashboard in Power BI
1️⃣ Download the Template: Get immediate access to the Hospitality KPI Dashboard in Power BI.
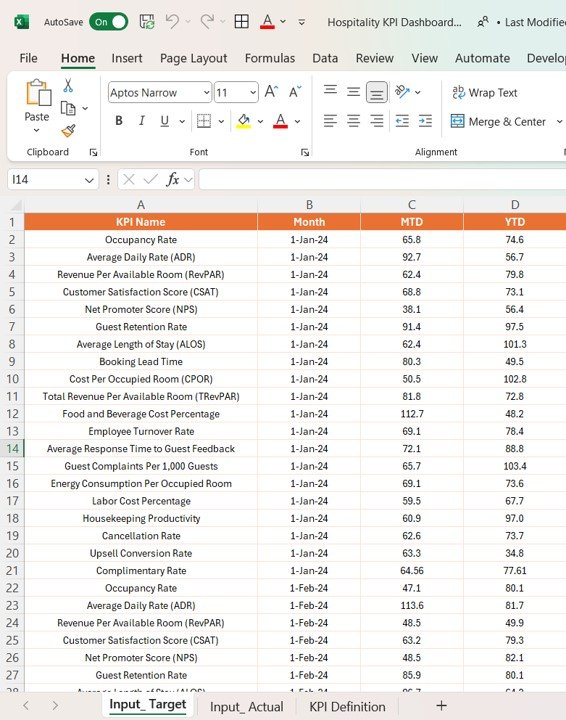
2️⃣ Input Your Data: Enter key performance data related to occupancy, revenue, guest satisfaction, and operations.
3️⃣ Track & Monitor KPIs: Use the dashboard to track hotel occupancy, guest feedback, and operational performance.
4️⃣ Analyze & Optimize: Use insights from the dashboard to optimize pricing strategies, improve guest satisfaction, and enhance operational efficiency.
5️⃣ Generate Reports & Insights: Create custom reports to analyze your business performance and share with stakeholders or management.
Who Can Benefit from the Hospitality KPI Dashboard in Power BI?
🔹 Hotel Managers & Owners
🔹 Resort & Accommodation Operators
🔹 Revenue Managers & Pricing Teams
🔹 Operations & Service Quality Managers
🔹 Financial Analysts & Business Planners
🔹 Marketing Teams & Customer Experience Managers
Boost your hospitality business’s performance with the Hospitality KPI Dashboard in Power BI. Track occupancy, revenue, guest satisfaction, and operational efficiency to ensure a successful and profitable business.
Click here to read the Detailed blog post
Visit our YouTube channel to learn step-by-step video tutorials
Youtube.com/@PKAnExcelExpert


Reviews
There are no reviews yet.