Home Healthcare Dashboard are growing rapidly as more patients choose care at home instead of hospitals or clinics. But managing home healthcare operations is complex—nurses travel to patient homes, service teams handle multiple visits, billing teams process payments, and managers monitor outcomes across regions. Without a proper reporting system, teams end up using scattered spreadsheets and manual files. That slows down decision-making.
The Home Healthcare Dashboard in Power BI solves this problem instantly. It brings all essential KPIs—patient satisfaction, service performance, billing, discounts, revenue, and monthly trends—into one interactive and automated dashboard. With clean visuals, dynamic slicers, and powerful charts, healthcare teams get complete clarity in seconds. You can filter by region, service type, role, condition type, or month and see insights instantly. You don’t need technical expertise—Power BI does all the hard work for you. ⭐
Whether you manage a small home healthcare team or large multi-region operations, this dashboard helps you track performance, improve outcomes, and make faster decisions every day.
✨ Key Features of Home Healthcare Dashboard in Power BI
This dashboard is designed with healthcare operations in mind. It offers all the insights needed for quality improvement and strategic planning.
📊 Instant KPI Visibility
Track high-level KPIs such as:
-
Patient Satisfaction
-
Paid Invoice %
-
Discount (USD)
-
Service Fee (USD)
These indicators help managers monitor essential metrics instantly.
🩺 Condition, Service & Role-Wise Insights
Understand how patient conditions impact satisfaction, how each role contributes to revenue, and which services drive the most profit.
🎛️ Interactive Filters & Slicers
Switch between regions, services, conditions, and roles with a single click. All visuals refresh automatically.
📈 Automated Charts & Trends
Track bill amounts, discounts, profits, and satisfaction trends month by month.
⚡ No Manual Reporting Needed
Replace multiple spreadsheets with one clean Power BI dashboard.
📦 What’s Inside the Home Healthcare Dashboard in Power BI
This dashboard includes five analytical pages, each offering a different perspective on home healthcare performance.
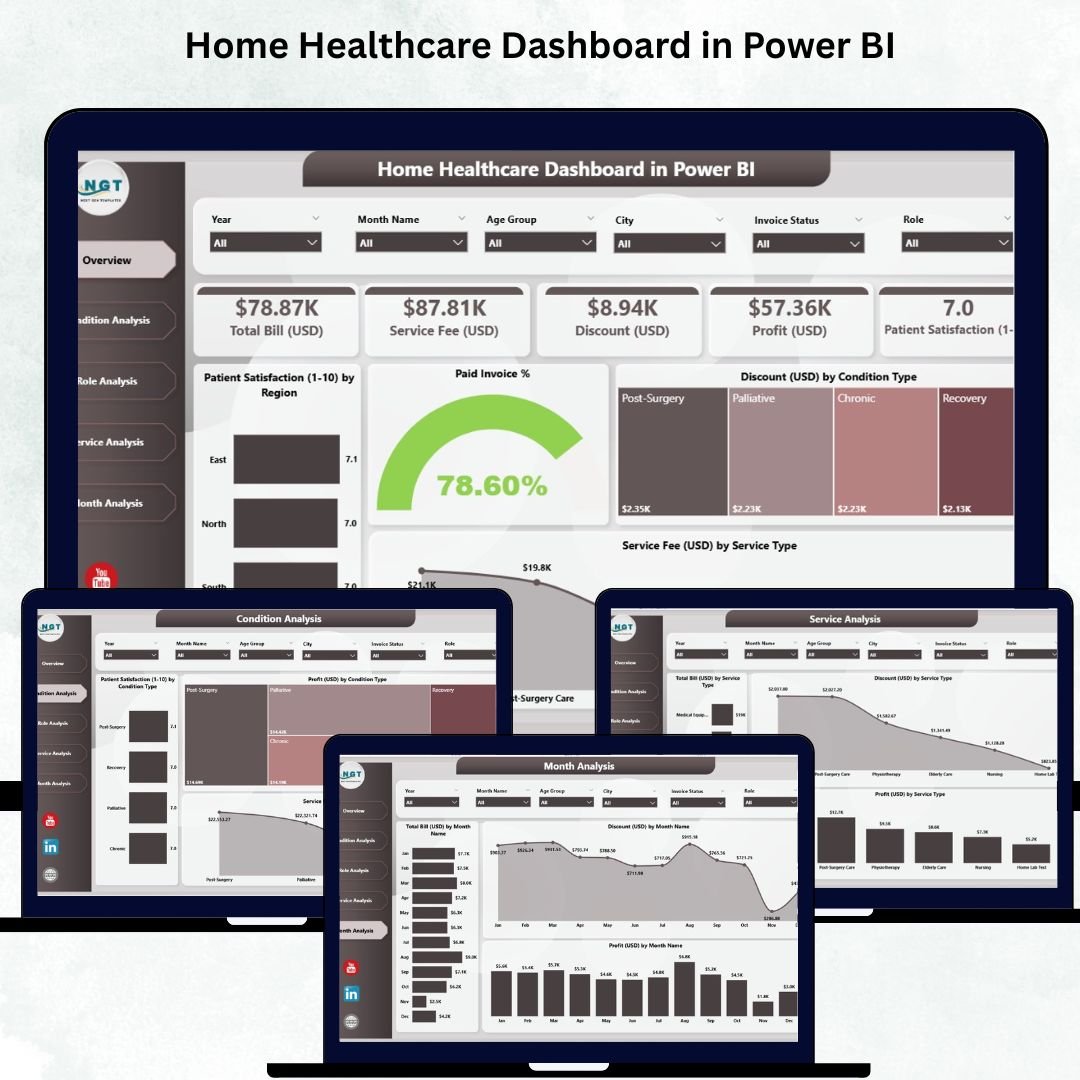
1️⃣ Overview Page
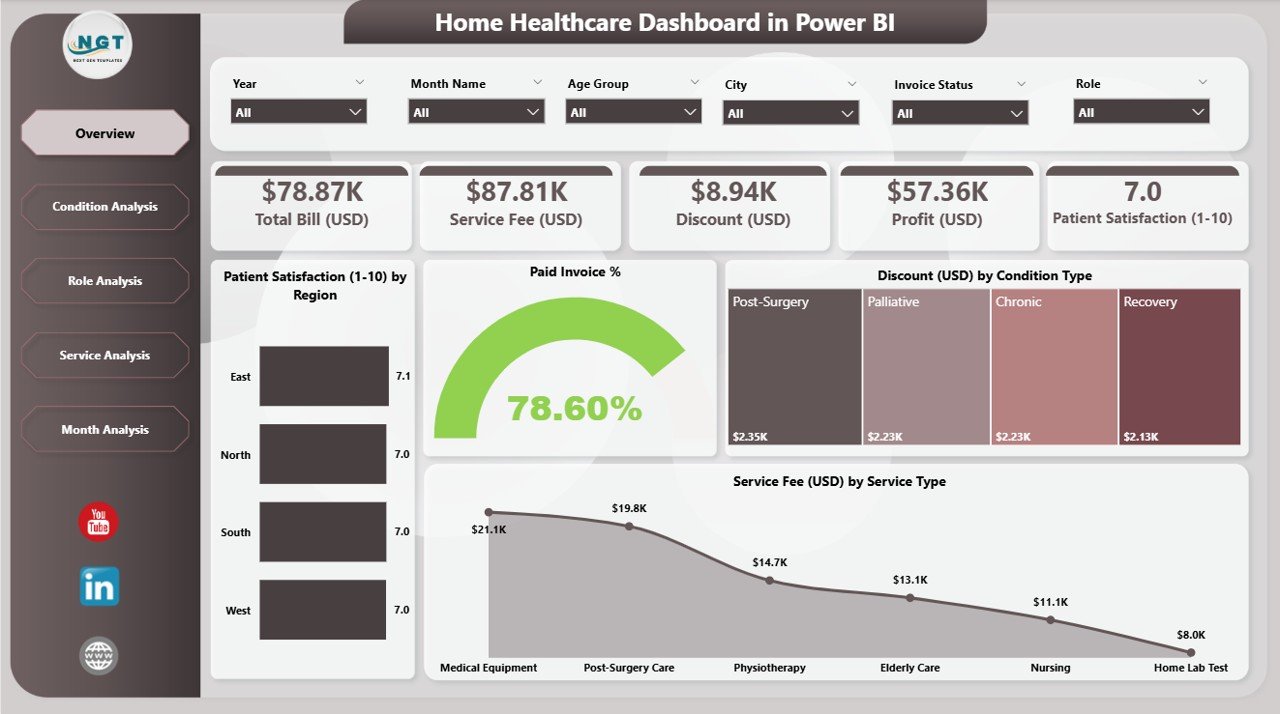
Your main performance screen includes:
-
Four KPI cards
-
Charts showing:
-
Patient Satisfaction by Region
-
Paid Invoice %
-
Discount by Condition Type
-
Service Fee by Service Type
-
Perfect for daily operational monitoring.
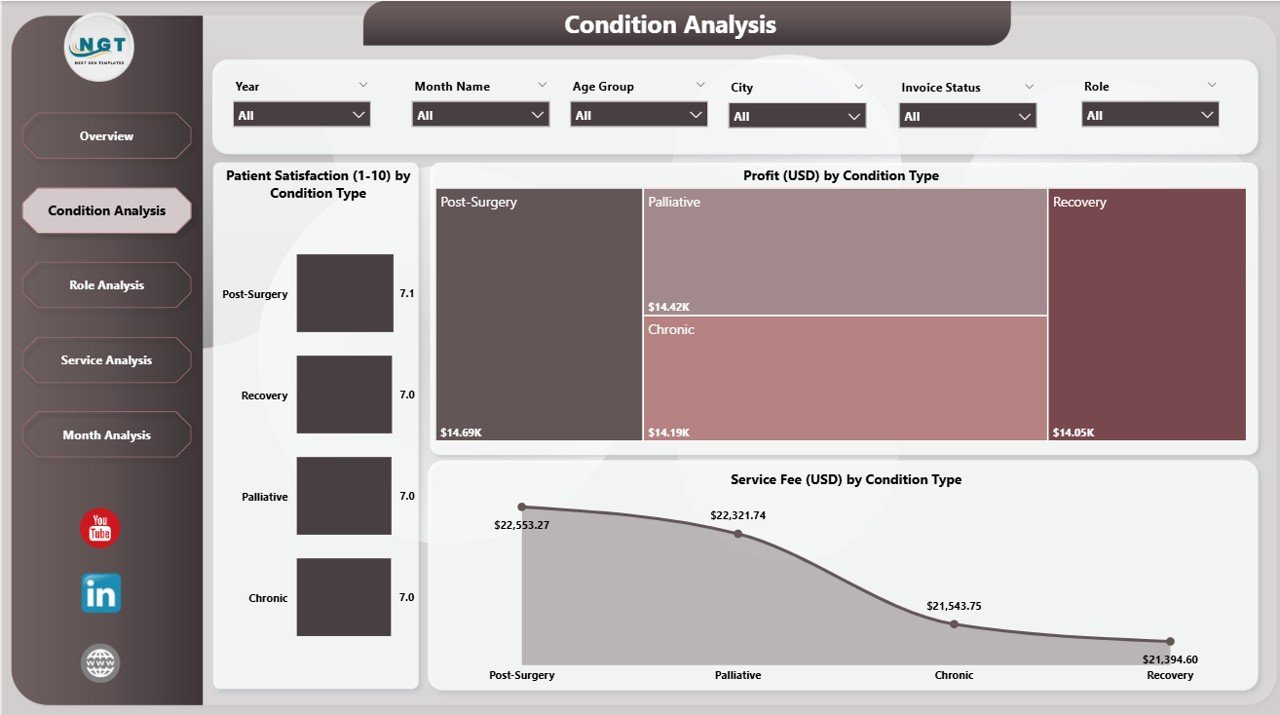
2️⃣ Condition Analysis Page
Analyze performance based on patient conditions.
Charts include:
-
Satisfaction by Condition Type
-
Paid Amount by Condition Type
-
Service Fee by Condition Type
Ideal for understanding treatment outcomes and condition-based trends.
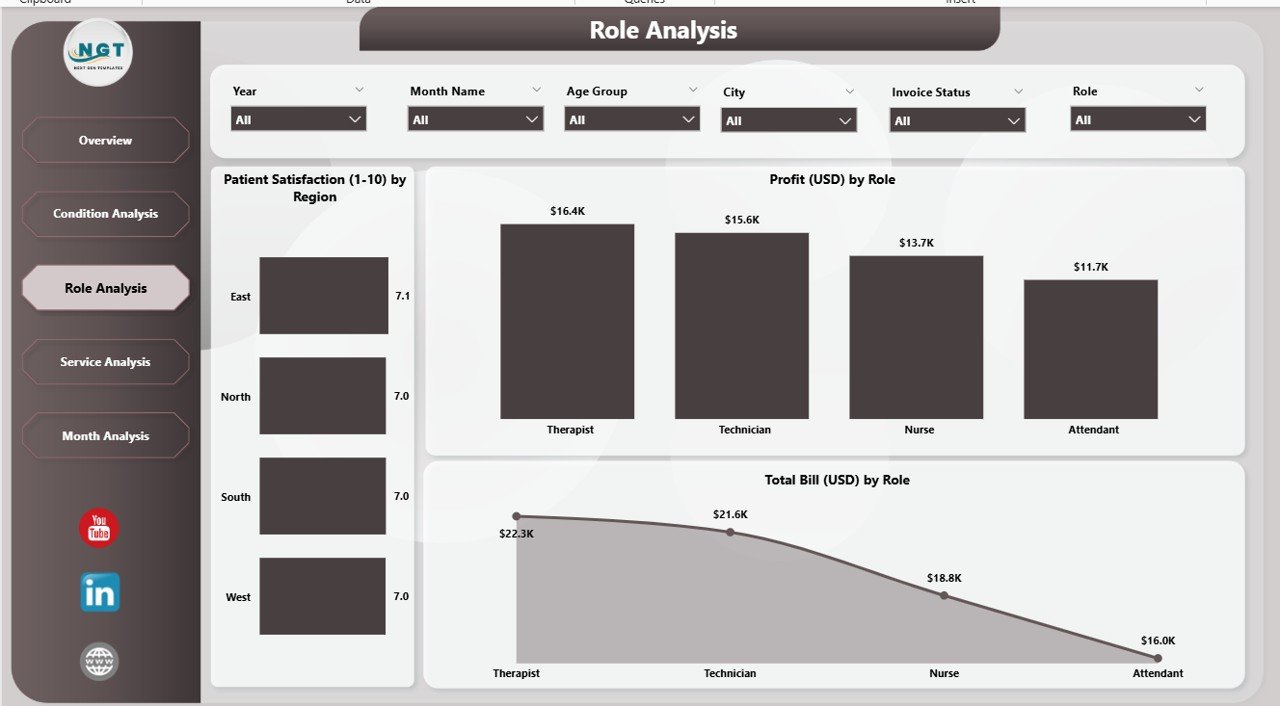
3️⃣ Role Analysis Page
Compare performance across healthcare roles.
Charts include:
-
Patient Satisfaction by Region
-
Paid Amount by Role
-
Total Bill by Role
Useful for staffing, performance improvement, and training planning.
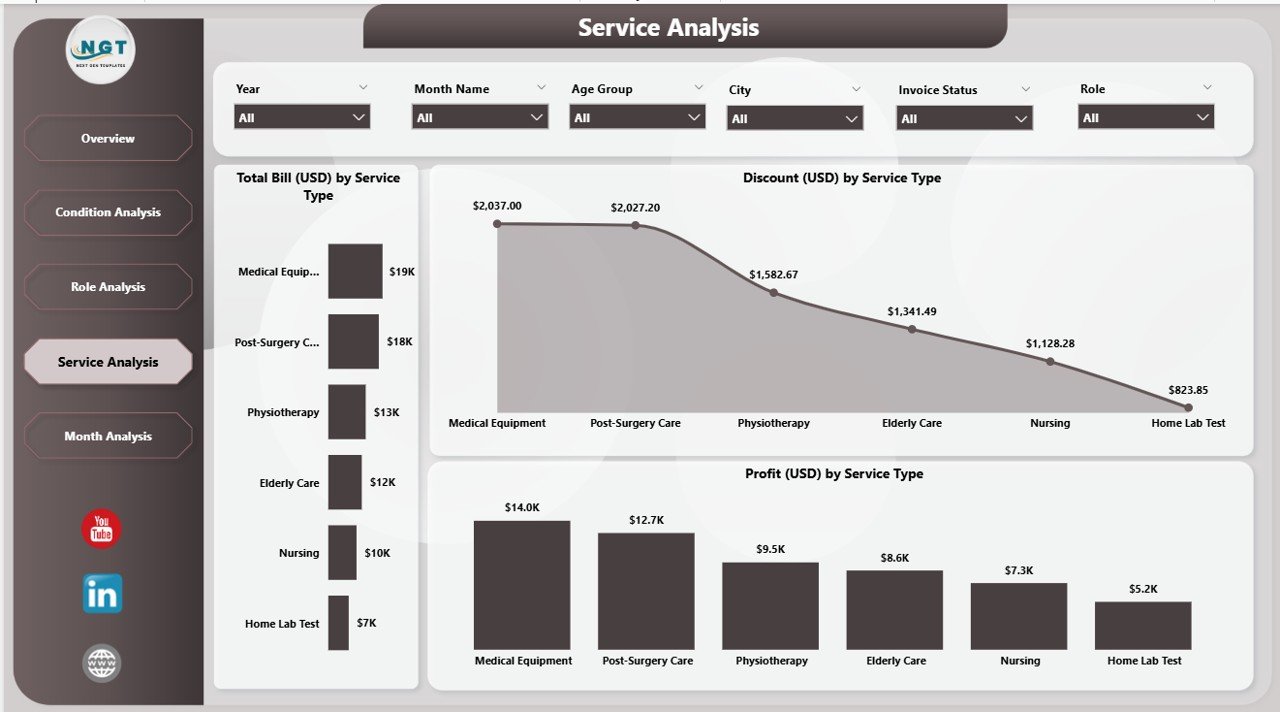
4️⃣ Service Analysis Page
Track performance of all service types.
Charts include:
-
Total Bill by Service Type
-
Discount by Service Type
-
Profit by Service Type
Helps teams identify high-revenue and low-margin services.
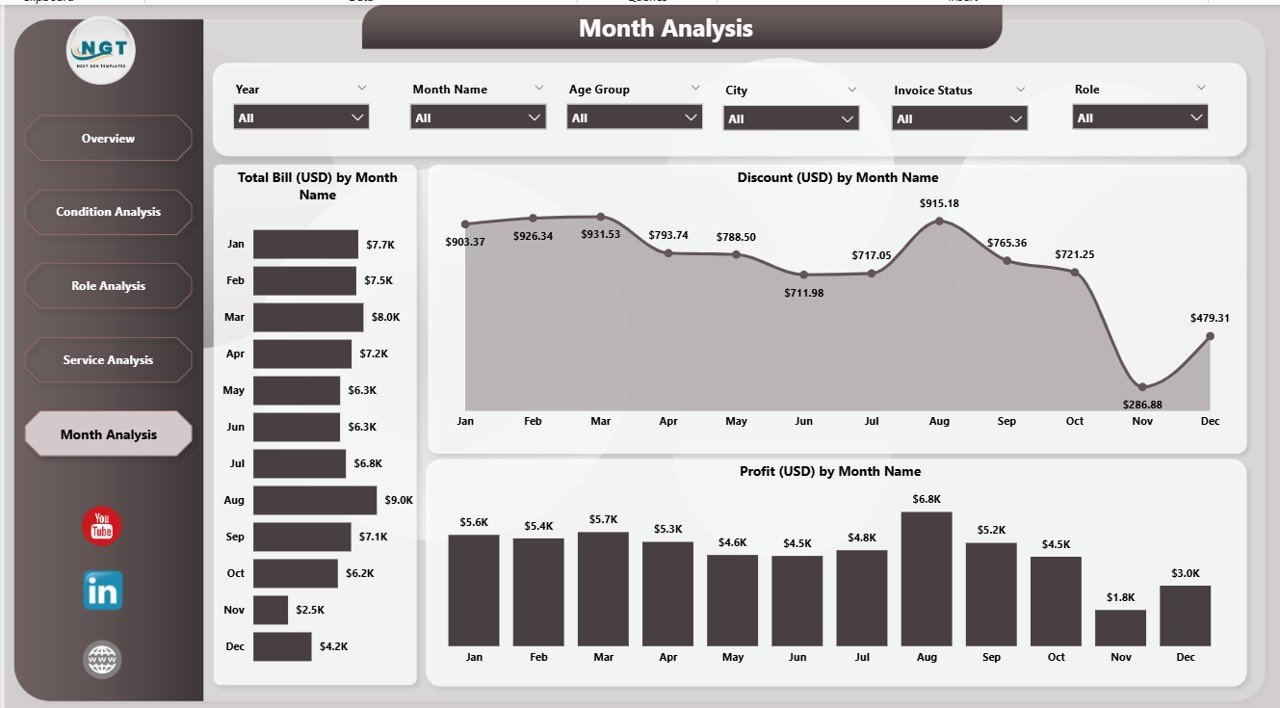
5️⃣ Monthly Trends Page
View month-wise performance at a glance.
Charts include:
-
Total Bill by Month
-
Discount by Month
-
Profit by Month
Great for forecasting, budgeting, and long-term planning.
🛠️ How to Use the Home Healthcare Dashboard in Power BI
Using this dashboard is simple and intuitive:
1️⃣ Load your data into Power BI from Excel or any connected source
2️⃣ Refresh your dashboard
3️⃣ Use slicers to filter by region, role, service, or condition
4️⃣ Review KPIs on the Overview Page daily
5️⃣ Use analysis pages for deeper insights
6️⃣ Study monthly trends for planning and budgeting
Everything updates automatically—no manual formatting, no complex formulas.
🎯 Who Can Benefit from This Dashboard?
This dashboard is perfect for:
-
🩺 Home Healthcare Teams
-
🧑⚕️ Nurses & Caregivers
-
🏥 Healthcare Administrators
-
📊 Operations Managers
-
💼 Billing & Revenue Teams
-
🧠 Quality & Compliance Teams
-
🧑💻 Healthcare Analysts
-
⭐ Multi-location healthcare companies
If your team needs clear, fast, and actionable insights—this template is the ideal solution.
### Click here to read the Detailed blog post
Visit our YouTube channel to learn step-by-step video tutorials
👉 Youtube.com/@PKAnExcelExpert


Reviews
There are no reviews yet.