


Managing performance in healthcare insurance is a balancing act — between financial control, operational efficiency, and customer satisfaction. With so many moving parts, keeping track of metrics like claim turnaround, policy renewal, and loss ratios can feel overwhelming.
The Healthcare Insurance KPI Scorecard in Excel simplifies this complexity. It’s a ready-to-use, interactive Excel template designed for insurance companies, brokers, claims managers, and financial analysts who need real-time visibility into key performance indicators (KPIs).
Built entirely in Microsoft Excel, this scorecard turns data into actionable insights — without coding or specialized BI software. Whether you’re monitoring monthly trends or long-term outcomes, this tool ensures your organization stays compliant, profitable, and efficient.
⚙️ Key Features of the Healthcare Insurance KPI Scorecard in Excel
📊 4 Structured Worksheet Tabs – Scorecard, KPI Trend, Input Data, and KPI Definition.
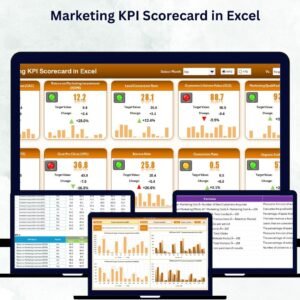
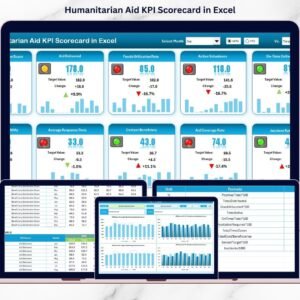
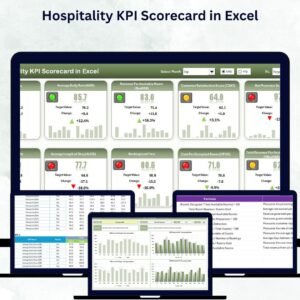
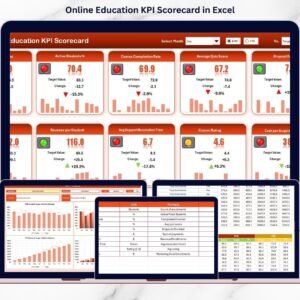
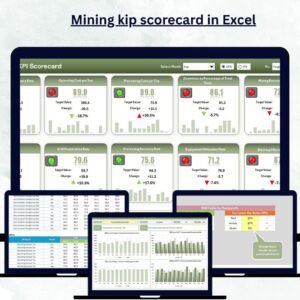
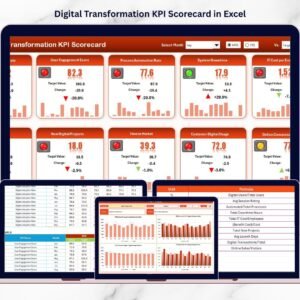
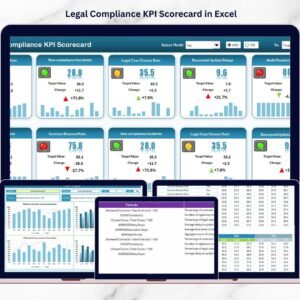
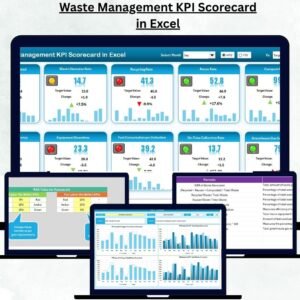
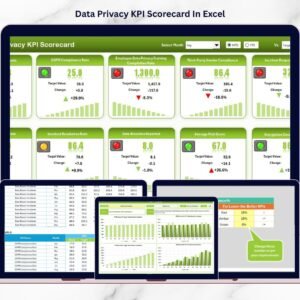
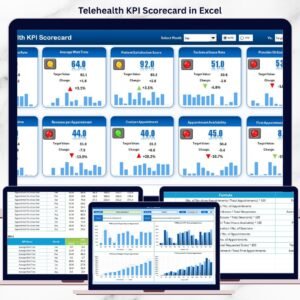
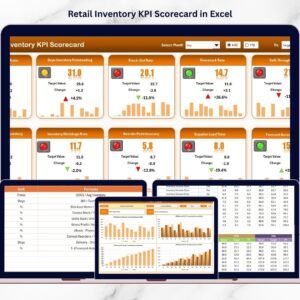
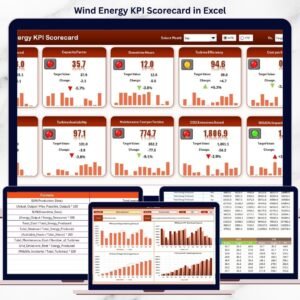
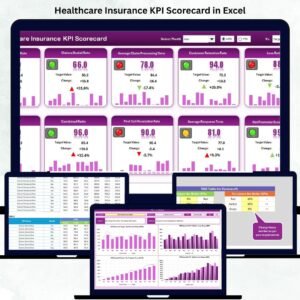
📈 Interactive Scorecard Page – Instantly view MTD (Month-to-Date) and YTD (Year-to-Date) results.
🎯 Actual vs Target Comparison – Analyze where your KPIs stand versus set goals.
🟢 Color-Coded Indicators – Green, Yellow, Red visual cues highlight performance instantly.
📘 KPI Definition Sheet – Maintain formulas, units, and definitions for consistency.
📅 Trend Charts – Monitor progress for any KPI across multiple months.
🔄 Automatic Data Linkage – Input data once; all visuals update automatically.
💻 Completely Excel-Based – No add-ons, macros, or complex installation required.
📤 Customizable Design – Add KPIs, update layouts, or link to external data sources.
📊 Dashboard Structure Overview
🏠 1️⃣ Scorecard Sheet — The Command Center
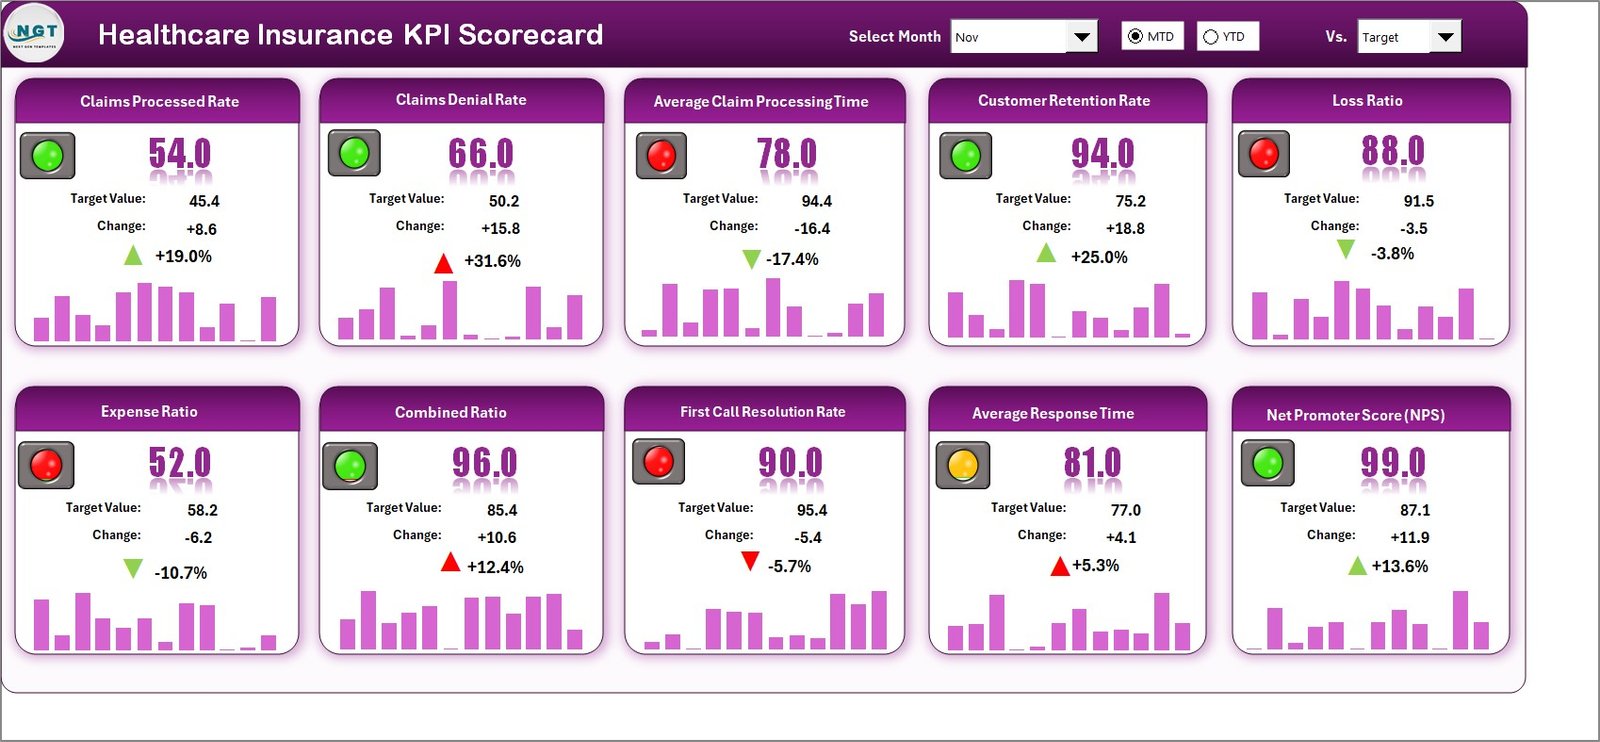
This is your primary control panel.
-
Select month and mode (MTD/YTD).
-
Instantly view Actual vs Target results for all KPIs.
-
Color-coded highlights reveal performance at a glance.
-
Definitions and units appear beside each KPI for quick reference.
🎯 Purpose: Provide a complete, at-a-glance performance overview for all departments.
📈 2️⃣ KPI Trend Sheet — Visualize Performance Over Time
Select any KPI (cell C3) to see interactive trend charts.
-
Auto-display KPI Group, Unit, Formula, and Definition.
-
Compare Actual, Target, and Previous Year values for both MTD and YTD.
💡 Purpose: Identify month-to-month trends and long-term improvement areas.
🧮 3️⃣ Input Data Sheet — Feed the Engine
Enter monthly values for Actual, Target, and PY directly here.
-
Clean, structured layout simplifies data entry.
-
Updates instantly reflect on Scorecard and Trend Sheets.
📊 Purpose: Maintain organized, reliable performance data.
📘 4️⃣ KPI Definition Sheet — Ensure Consistency
Acts as your reference library for every KPI.
-
Columns include KPI Name, Group, Unit, Formula, and Definition.
-
Keeps reporting standards uniform across the organization.
🎯 Purpose: Ensure every stakeholder interprets metrics the same way.
💡 Essential KPIs You Can Track
🩺 Claim Metrics:
-
Claim Turnaround Time
-
Claim Approval %
-
Claim Denial Rate
💰 Financial KPIs:
-
Loss Ratio
-
Expense Ratio
-
Premium Growth Rate
📋 Policy Metrics:
-
Policy Renewal Rate
-
Active Policy Count
😊 Customer KPIs:
-
Customer Satisfaction (CSAT)
-
Average Resolution Time
Together, these indicators deliver a complete picture of efficiency, profitability, and customer care.
🌟 Advantages of the Healthcare Insurance KPI Scorecard
✅ Centralized Performance Tracking – View all insurance metrics in one Excel file.
✅ Real-Time Decision Support – Identify issues before they affect results.
✅ Easy Customization – Add or modify KPIs anytime.
✅ Cost-Effective & Scalable – Professional analytics without BI software costs.
✅ Data Consistency – KPI definitions and formulas standardized for all users.
✅ Trend Visualization – Clear charts expose emerging performance patterns.
✅ Portability – Easily shared across departments and management teams.
🧠 Best Practices for Using the Scorecard
📌 Assign each KPI an owner for accountability.
📌 Update the Input Data sheet monthly to keep analysis fresh.
📌 Use conditional formatting to highlight variances.
📌 Review both MTD and YTD results for balanced insights.
📌 Validate KPI formulas quarterly for accuracy.
📌 Integrate Excel with your claims database or CSV files for automation.
👥 Who Can Benefit
🏥 Health Insurance Companies – Monitor claim and policy KPIs.
🧾 Claims Managers – Track efficiency and denial patterns.
📈 Finance Teams – Analyze profitability ratios.
📊 Analysts & Auditors – Ensure transparent reporting.
🎓 Training Institutes – Teach KPI-based performance management.
💻 Why Excel Works Best
-
Universal availability and low cost.
-
Built-in formulas and charting tools.
-
Compatible with Power BI and cloud systems.
-
Flexible customization for any reporting structure.


Reviews
There are no reviews yet.