


In today’s fast-paced world, grocery delivery success depends on efficiency, accuracy, and customer satisfaction. 🛒📦 The Grocery Delivery Services Dashboard in Excel is a game-changing solution that brings all your delivery metrics, financial data, and customer insights together in one dynamic, interactive Excel file.
Whether you manage multiple delivery partners, regional operations, or diverse payment modes, this dashboard gives you a 360° view of your entire delivery performance — so you can make faster, smarter, and more profitable business decisions. 💼📊
✨ Key Features of Grocery Delivery Services Dashboard in Excel
✅ Five Analytical Pages + Two Support Sheets — A clean and organized structure covering Overview, Partner, Payment, Region, and Monthly Trends.
✅ Interactive Page Navigator — Switch between pages easily using the intuitive left-side panel.
✅ Dynamic Slicers & Filters — Instantly analyze performance by Month, Region, Partner, or Payment Mode.
✅ KPI Cards & Charts — Track Total Orders, Revenue, Profit Margin, On-Time Deliveries, and Customer Ratings at a glance.
✅ Partner-Level Insights — Compare performance, profit margins, and customer ratings for each delivery partner.
✅ Payment Mode Analysis — Understand which payment types (COD, Card, Wallet) generate the most profit and fastest deliveries.
✅ Regional Comparison — Identify top-performing regions and optimize weaker delivery zones.
✅ Monthly Trends View — Discover patterns, seasonality, and areas of improvement.
✅ Data & Support Sheets — Store all order details, partner lists, and dropdown data in structured sheets for automation.
This Excel dashboard turns raw data into powerful, decision-making visuals — all within seconds! ⚡
📂 What’s Inside the Grocery Delivery Services Dashboard in Excel
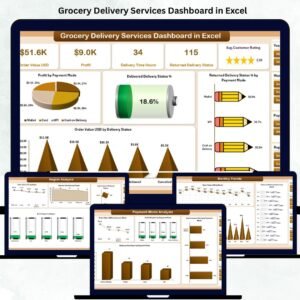
📊 1. Overview Page – The Performance Snapshot

Get a bird’s-eye view of your grocery delivery operations.
View total orders, revenue, profit margin (%), on-time delivery rate, and average customer rating.
Charts include Profit by Payment Mode, Delivered & Returned Status, and Order Value by Delivery Status — all dynamically updating through slicers.
🚚 2. Delivery Partner Analysis
Evaluate each delivery partner’s performance using charts for Order Value, Profit Margin, Customer Rating, and Cancelled vs Returned Deliveries.
Quickly spot your top performers and identify areas that need attention.
💳 3. Payment Mode Analysis
Track financial and operational insights by payment type — from Profit Margin (%) to Delivery Time (Hours) and Customer Rating by Payment Mode.
Discover which payment method drives higher satisfaction and profitability.
🌍 4. Region Analysis
Measure performance across locations with visual insights into Order Value, Delivery Time, Profit Margin, and Customer Ratings by region.
Perfect for expanding into high-performing zones or improving low-efficiency regions.
📅 5. Monthly Trends
Analyze order patterns, profit fluctuations, and satisfaction trends over time with monthly charts — essential for forecasting and planning.
📑 6. Data Sheet
The backbone of your dashboard — record every transaction detail (Order ID, Partner, Region, Payment, Value, Status, Profit Margin, Rating).
🧾 7. Support Sheet
Keep your dropdowns and slicers automated with master lists for Delivery Partners, Regions, Payment Modes, and Status Codes.
🧭 How to Use the Grocery Delivery Services Dashboard in Excel
1️⃣ Input data in the Data Sheet with all relevant order and performance details.
2️⃣ Update master lists (Regions, Partners, Payment Modes) in the Support Sheet.
3️⃣ Navigate easily using the Page Navigator on the left panel.
4️⃣ Use slicers to filter data by month, region, or delivery partner.
5️⃣ Analyze KPIs and charts in each analytical page to measure efficiency and profitability.
6️⃣ Review Monthly Trends to forecast future growth and seasonal demand.
You’ll have a complete view of your delivery business — from profitability to customer happiness — in just a few clicks! 🎯
👥 Who Can Benefit from This Grocery Delivery Services Dashboard in Excel
🏪 Grocery Chains & Supermarkets: Track online delivery performance, profit margins, and customer experience.
🚛 Logistics Companies: Evaluate partner efficiency and delivery timelines.
🚀 Startups: Understand customer preferences and optimize payment options.
📦 E-commerce Retailers: Analyze region-wise trends and delivery performance.
📈 Operations Managers: Improve delivery speed, cost, and satisfaction with real-time analytics.
📊 Business Analysts: Present data-driven insights through visual reports.
This dashboard is ideal for any delivery-based business that values precision, speed, and customer satisfaction. 🌟


Reviews
There are no reviews yet.