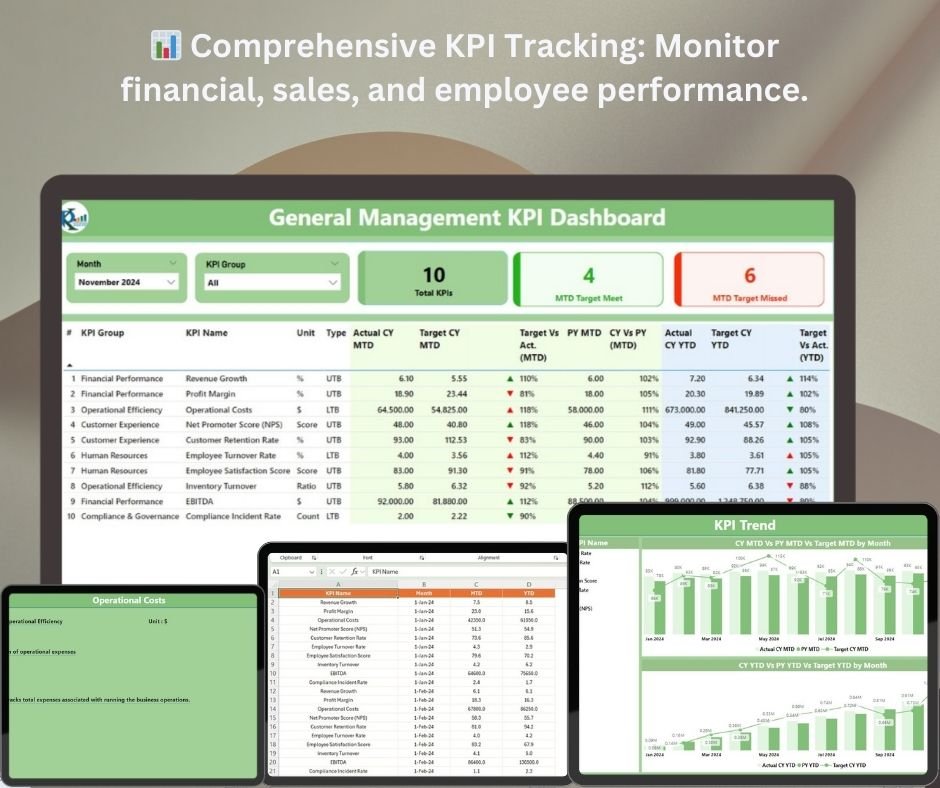


The General Management KPI Dashboard in Power BI is a robust and versatile tool designed for managers and executives across all industries. This customizable dashboard allows you to track and analyze key performance indicators (KPIs) related to business operations, including financial performance, sales, customer satisfaction, and employee productivity. With real-time data tracking, it provides insights that help you make informed decisions, optimize processes, and enhance business performance.
With its interactive features, the General Management KPI Dashboard is ideal for monitoring and improving key aspects of your business, from departmental performance to high-level organizational goals. It enables you to track your business objectives, identify performance gaps, and align strategies for sustained success.
Key Features of the General Management KPI Dashboard in Power BI
📊 Comprehensive KPI Tracking
Track essential KPIs such as sales revenue, customer satisfaction, employee performance, financial health, and project completion status. Gain a 360-degree view of your organization’s performance across various departments.
⚡ Real-Time Monitoring
Monitor performance metrics in real time. With up-to-date data, quickly identify any gaps in performance, detect trends, and take corrective actions to optimize business operations.
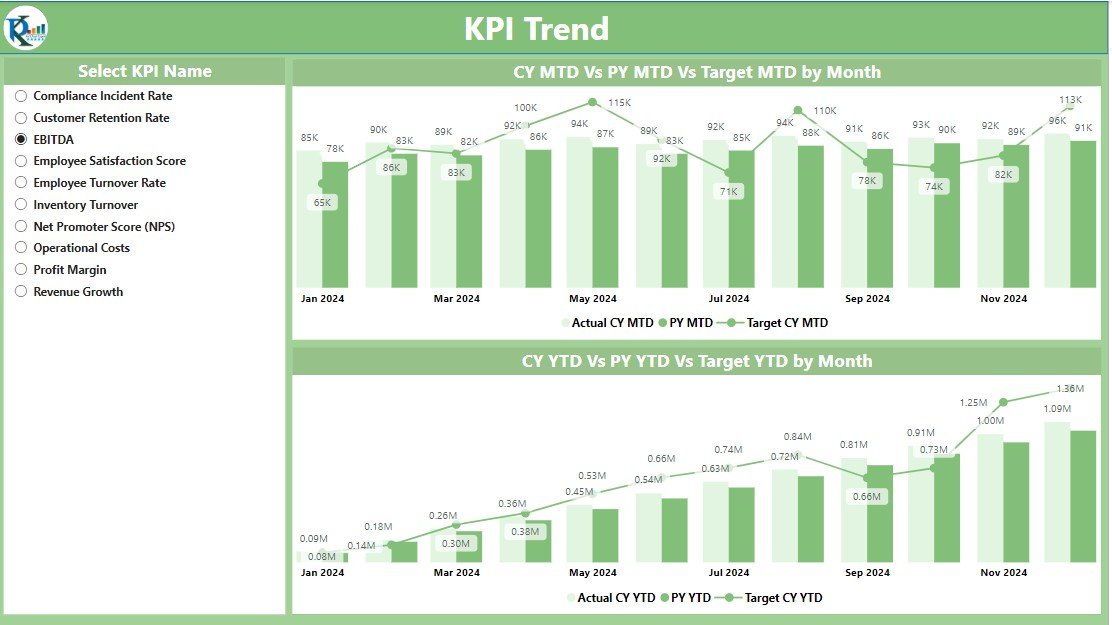
📈 Financial & Sales Performance Insights
Analyze financial data and sales metrics, including profit margins, revenue generation, cost management, and ROI. Visualize the key indicators to improve budgeting and forecasting decisions.
🧑💼 Employee Productivity & Engagement Tracking
Track employee performance, task completion rates, and overall productivity. Identify high performers and areas where additional training or support is needed to improve team efficiency.
🖥️ Interactive & User-Friendly Interface
The Power BI dashboard offers an intuitive design, making it easy to navigate, input data, and analyze performance metrics. Use interactive filters, slicers, and drill-down features for deeper insights.
Why You’ll Love the General Management KPI Dashboard in Power BI

✅ Track Multiple Business Metrics in One Place
Monitor and evaluate a wide range of KPIs including financials, sales performance, employee productivity, and customer satisfaction to get a comprehensive understanding of your business health.
✅ Make Data-Driven Decisions
Leverage real-time data and performance insights to make informed decisions on budgeting, resource allocation, and overall business strategy, ensuring that your organization stays on track toward achieving its goals.
✅ Optimize Business Operations
Identify performance gaps and bottlenecks across departments. By understanding key metrics, you can streamline operations and improve workflow efficiency across the organization.
✅ Improve Financial & Sales Performance
With clear insights into revenue, cost, and profitability, you can make adjustments to improve financial performance, optimize sales strategies, and better manage resources.
✅ Boost Employee Productivity & Engagement
Track key employee performance metrics and evaluate the productivity of your team. Use the insights to enhance employee engagement, performance, and overall morale.
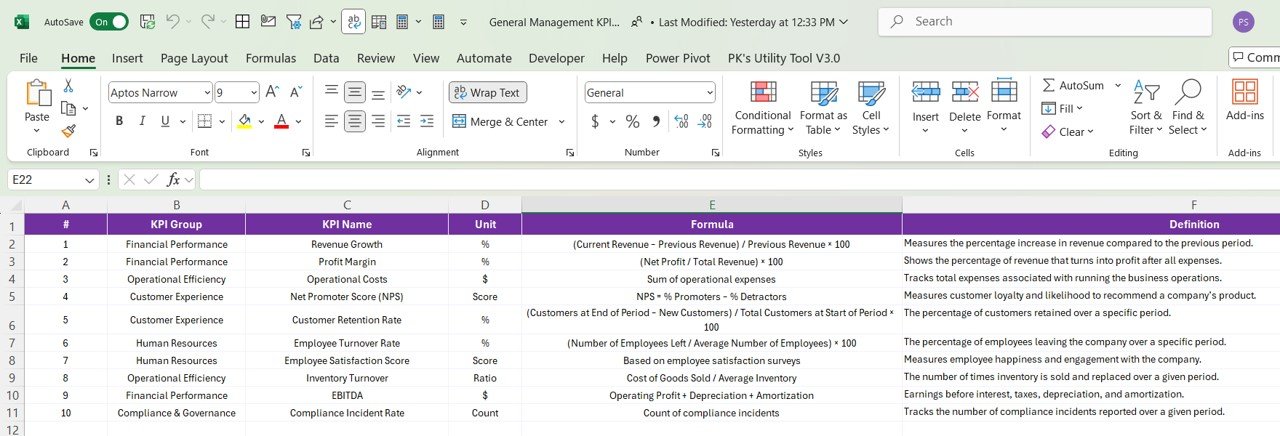
What’s Inside the General Management KPI Dashboard Template?
- Financial Performance Monitoring: Track revenue, costs, profit margins, and ROI.
- Sales & Marketing KPIs: Analyze sales revenue, customer acquisition, and marketing effectiveness.
- Employee Productivity Tracking: Monitor employee performance, task completion, and productivity.
- Customer Satisfaction Metrics: Measure customer feedback, retention rates, and satisfaction.
- Customizable KPIs: Adjust the dashboard to focus on metrics specific to your business goals.
- Interactive Visualizations: Use charts, graphs, and filters to analyze and interpret data easily.
How to Use the General Management KPI Dashboard in Power BI
1️⃣ Download the Template: Access your General Management KPI Dashboard in Power BI instantly.
2️⃣ Enter Data: Input performance data related to sales, finance, employee performance, and customer satisfaction.
3️⃣ Monitor & Track KPIs: Track performance metrics in real time and compare actual performance against targets.
4️⃣ Analyze & Optimize: Use the insights from the dashboard to optimize business strategies, improve employee performance, and boost financial results.
Who Can Benefit from the General Management KPI Dashboard in Power BI?
🔹 General Managers & Executives
🔹 Business Owners & Entrepreneurs
🔹 Financial Analysts & Sales Managers
🔹 Human Resources & Operations Teams
🔹 Anyone in Charge of Overseeing Business Performance
🔹 Organizations Looking to Optimize Operations & Increase Efficiency
Track, analyze, and optimize every aspect of your business with the General Management KPI Dashboard in Power BI. Make smarter decisions, improve operational efficiency, and ensure business success by having all your key performance indicators in one place.
Click here to read the Detailed blog post
Visit our YouTube channel to learn step-by-step video tutorials
Youtube.com/@PKAnExcelExpert


Reviews
There are no reviews yet.