Stay ahead in the high-performance gaming industry with the Gaming Hardware KPI Dashboard in Power BI — your ultimate tool for tracking, analyzing, and visualizing key metrics in real time. Whether you’re a hardware manufacturer, gaming product manager, or data analyst, this dashboard equips you with the insights you need to drive operational efficiency, product performance, and strategic decisions.
Built to simplify complex data, this Power BI dashboard pulls information from Excel and delivers powerful visuals and insights with just a few clicks.
⚙️ Key Features of the Gaming Hardware KPI Dashboard
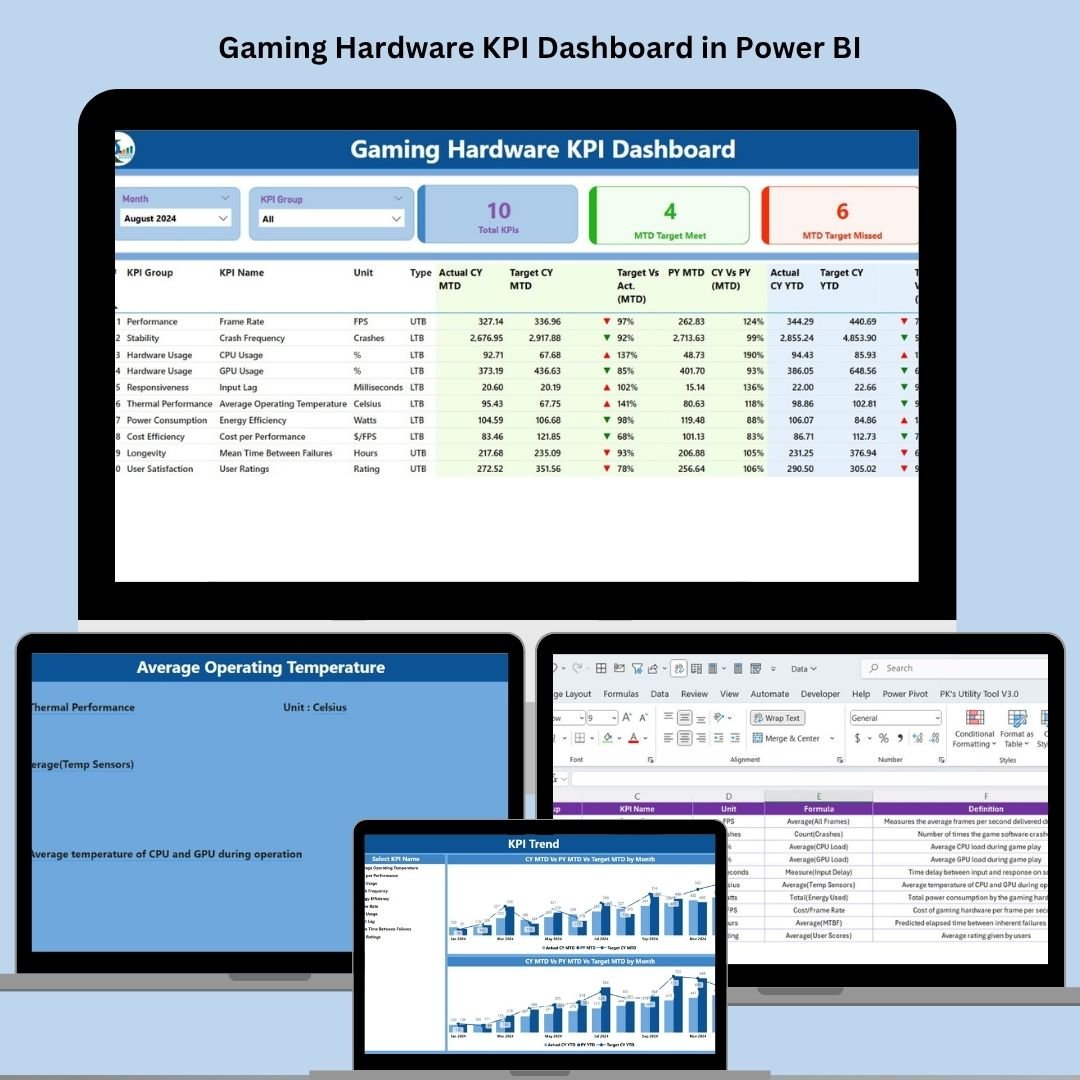
📊 Summary Page – Your Strategic Overview
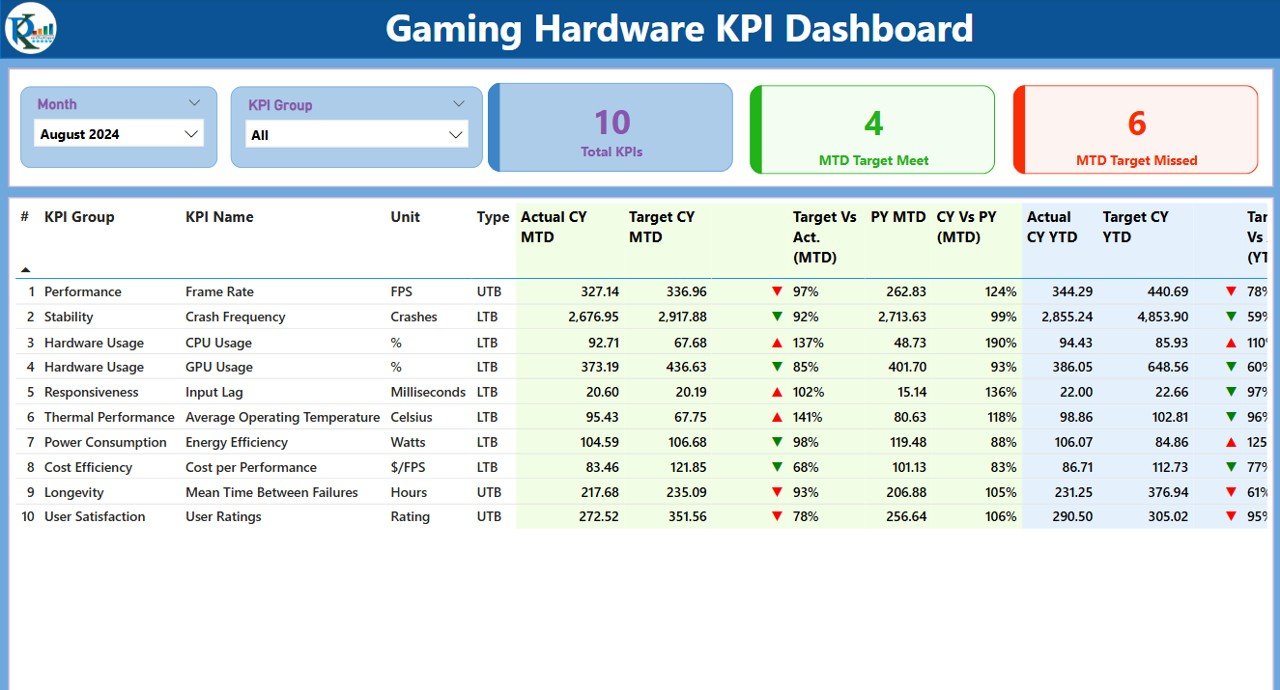
The Summary Page provides a high-level snapshot of performance with filters for Month and KPI Group.
-
📌 Total KPIs Count – Number of KPIs tracked
-
✅ MTD Target Met Count – How many KPIs hit their monthly goals
-
❌ MTD Target Missed Count – KPIs falling short
-
📋 Dynamic KPI Table – Includes KPI Name, Unit, Type (LTB or UTB), MTD & YTD actual vs target
-
🔺🔻 Icons & Arrows – Instantly visualize KPI performance using color-coded signals
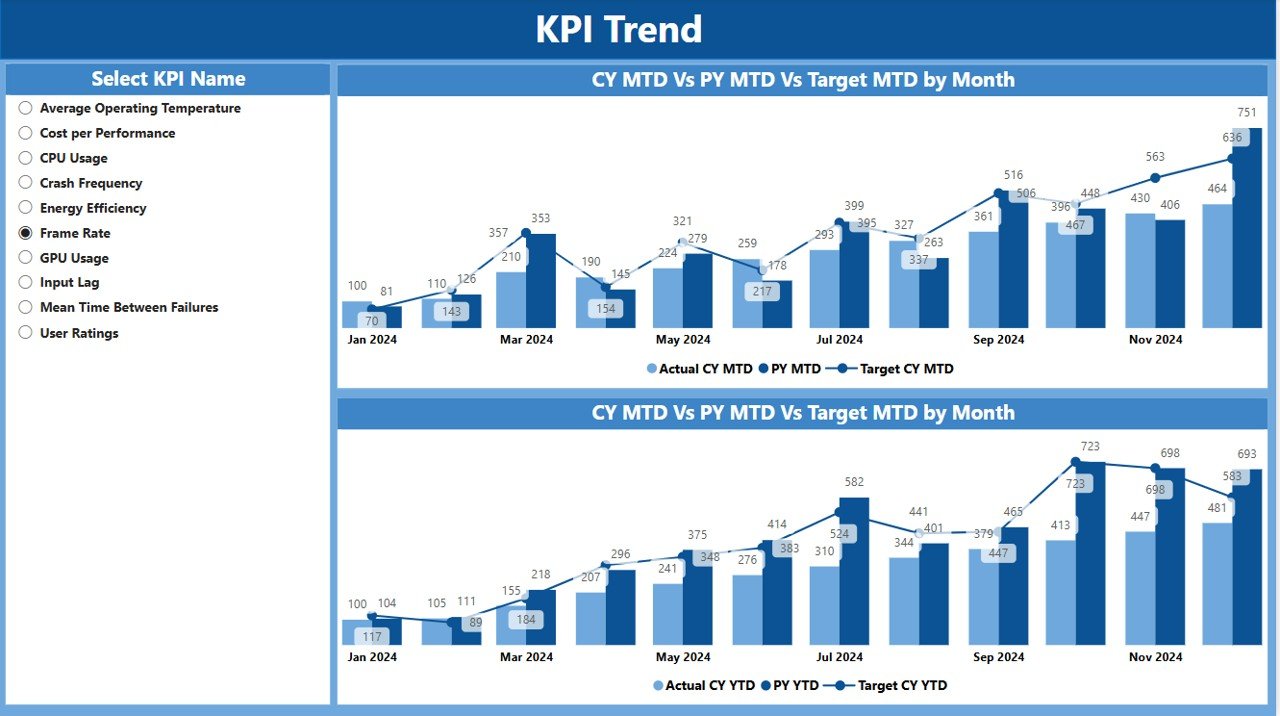
📈 KPI Trend Page – Historical Performance Analysis
Drill into KPI trends using:
-
📊 Combo Charts – Compare Current Year, Previous Year, and Target
-
🧭 Slicer Options – Choose any KPI for trend analysis
-
📅 MTD & YTD Tracking – Get both short-term and long-term visibility
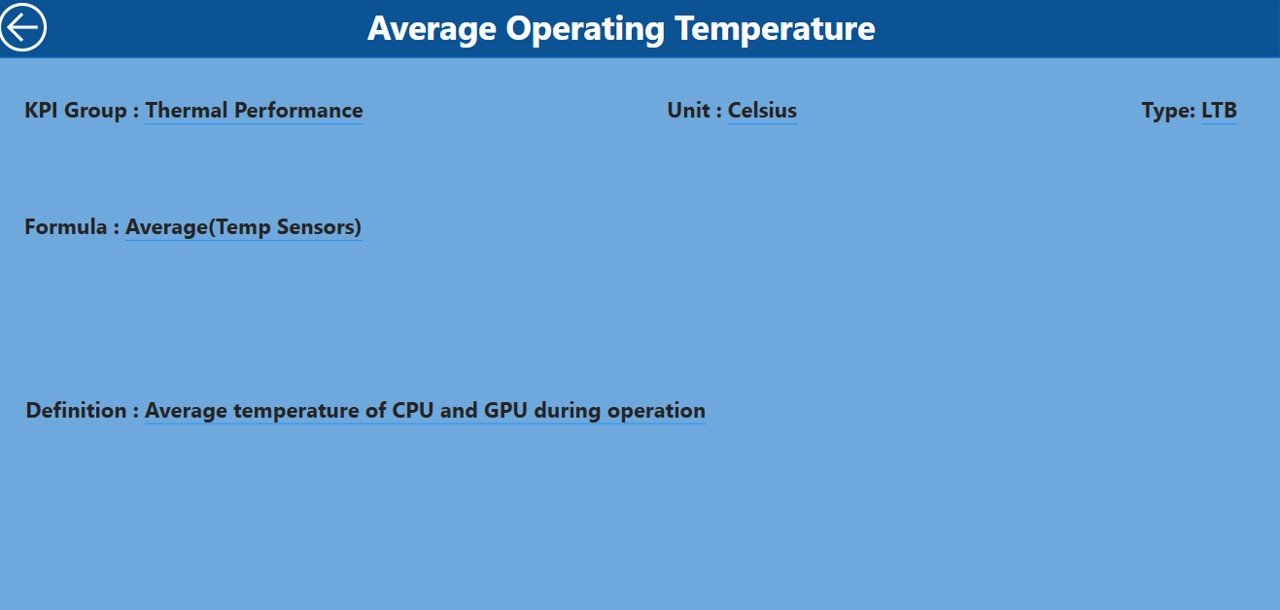
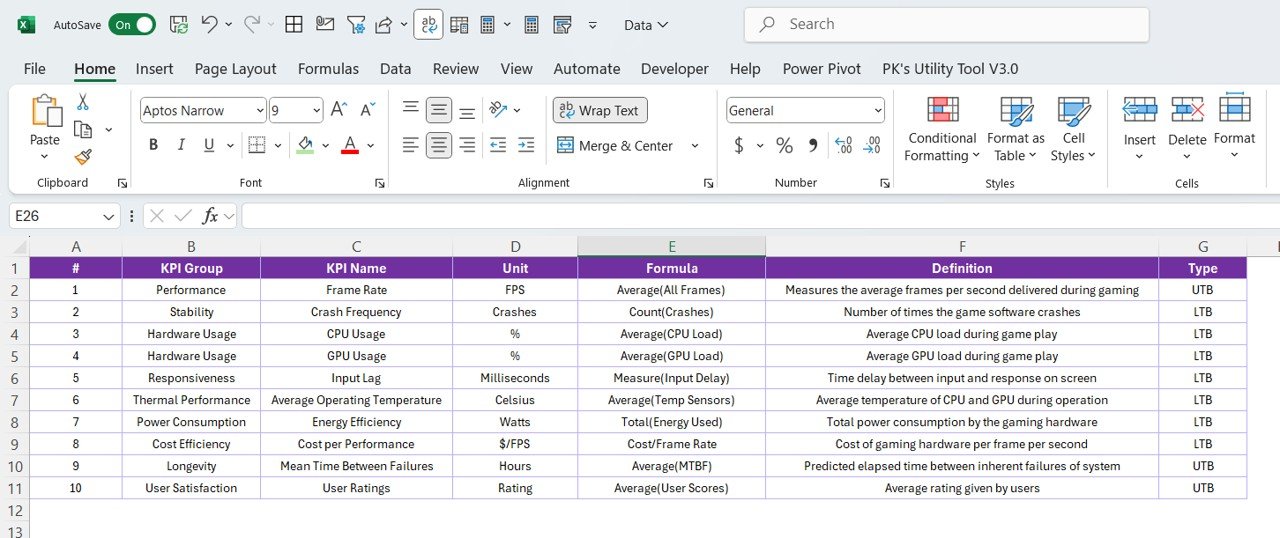
📘 KPI Definition Page – Transparency & Clarity
Understand what each KPI measures:
-
🔍 KPI Formula
-
📖 KPI Definition
-
⚙️ Unit and Type
Great for onboarding, audits, or executive reporting.
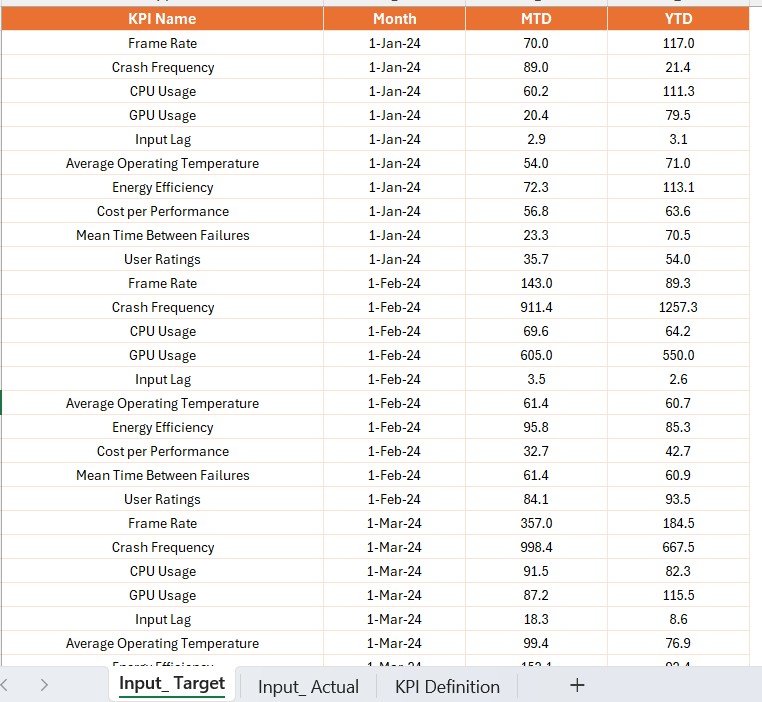
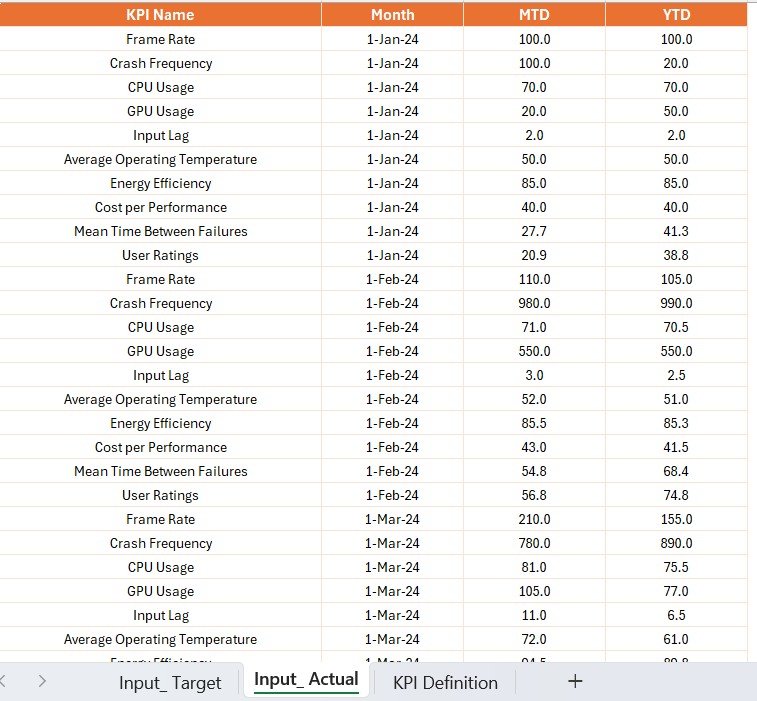
📂 Excel-Powered Backend – Seamless Data Management
Connected directly to 3 Excel sheets:
-
📝 Input_Actual – Feed in MTD & YTD values
-
🎯 Input_Target – Add performance targets per KPI
-
📚 KPI_Definition – Store definitions, units, and formulas
Power BI pulls data automatically, ensuring the dashboard always reflects the latest insights.
🧩 What’s Inside the Gaming Hardware KPI Dashboard
The Power BI file includes:
-
✅ Summary Page with filters & icons
-
✅ KPI Trend Page with slicers
-
✅ Drill-through KPI Definition Page
-
✅ Excel backend for easy updates
-
✅ Built-in visuals, conditional formatting, and calculated fields
No coding or Power BI expertise required — just plug in your data and go!
📌 How to Use the Gaming Hardware KPI Dashboard
📥 Step 1: Connect Excel Data
Update values in Input_Actual, Input_Target, and KPI_Definition sheets.
📊 Step 2: Open the Power BI File
Power BI will automatically sync and reflect updated metrics.
🎯 Step 3: Use Filters & Slicers
Analyze trends by KPI Group or Month using built-in slicers.
📈 Step 4: Dive Deeper
Click into any KPI to view its definition, formula, and measurement logic.
📤 Step 5: Share Reports
Export visuals to PDF or share Power BI dashboards with your team.
🎯 Who Can Benefit from This Dashboard?
🕹️ Gaming Hardware Manufacturers – Monitor product reliability, defect rates, sales
📈 Business Analysts & BI Teams – Run real-time analytics on key KPIs
👨💻 Product Managers – Track feature performance and delivery KPIs
💼 Operations & Quality Teams – Measure process efficiency and benchmarks
💡 Tech Executives – Make faster decisions with centralized data views
💡 Why Choose This Power BI Dashboard?
✅ Centralized performance tracking
✅ Real-time visuals from Excel data
✅ Customizable and scalable
✅ Built-in KPI trends and drill-downs
✅ Eliminates manual tracking and reporting
Don’t just track KPIs—understand and act on them in real-time.
🔗 Click here to read the Detailed blog post


Reviews
There are no reviews yet.