Running a furniture retail business without clear performance visibility is like selling without knowing what drives profit. High-value inventory, long sales cycles, seasonal demand, and tight margins make KPI tracking critical. Yet many furniture retailers still rely on scattered Excel files, manual MIS reports, and delayed summaries.
That is why the Furniture Retail KPI Dashboard in Power BI is designed as a ready-to-use, decision-making powerhouse 🚀.
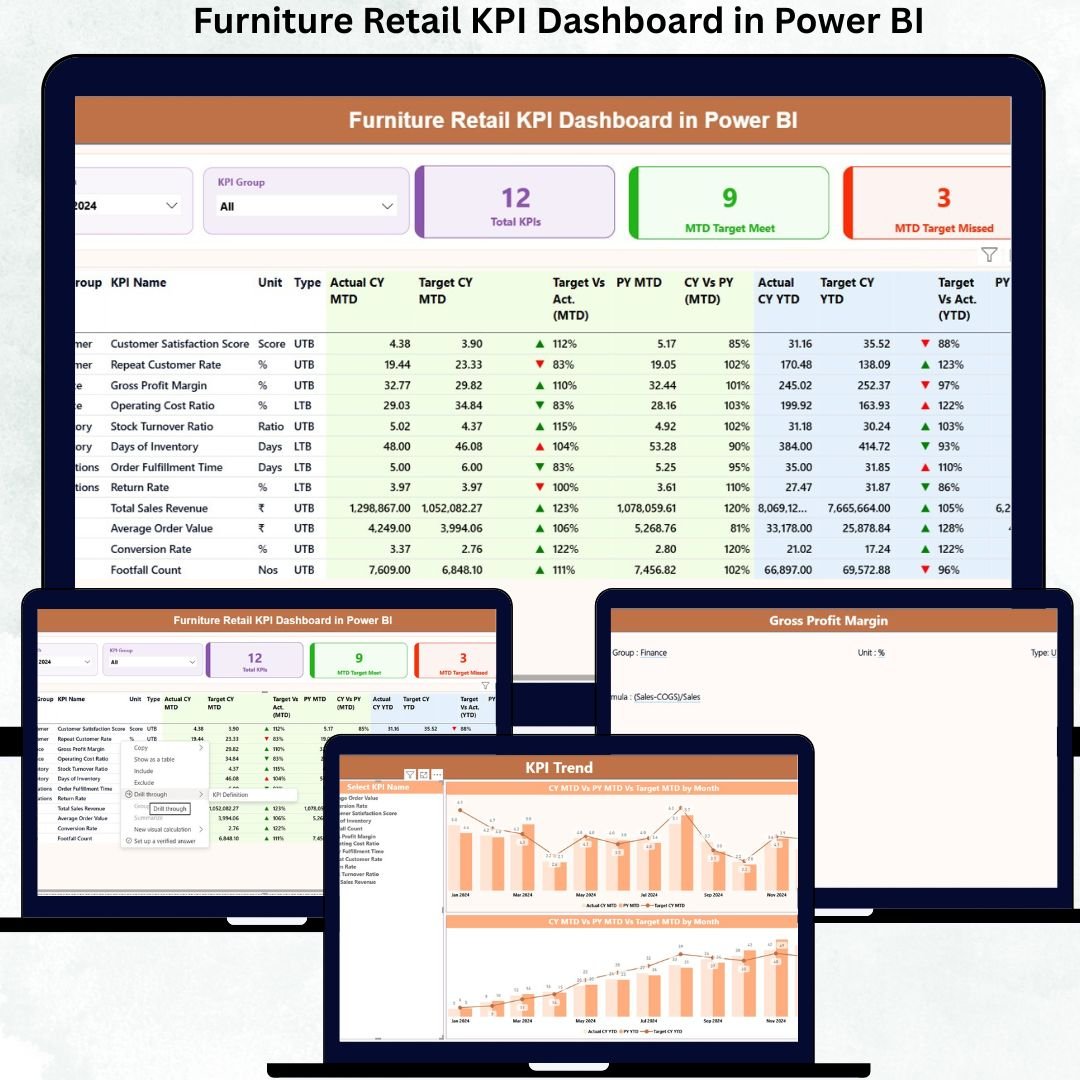
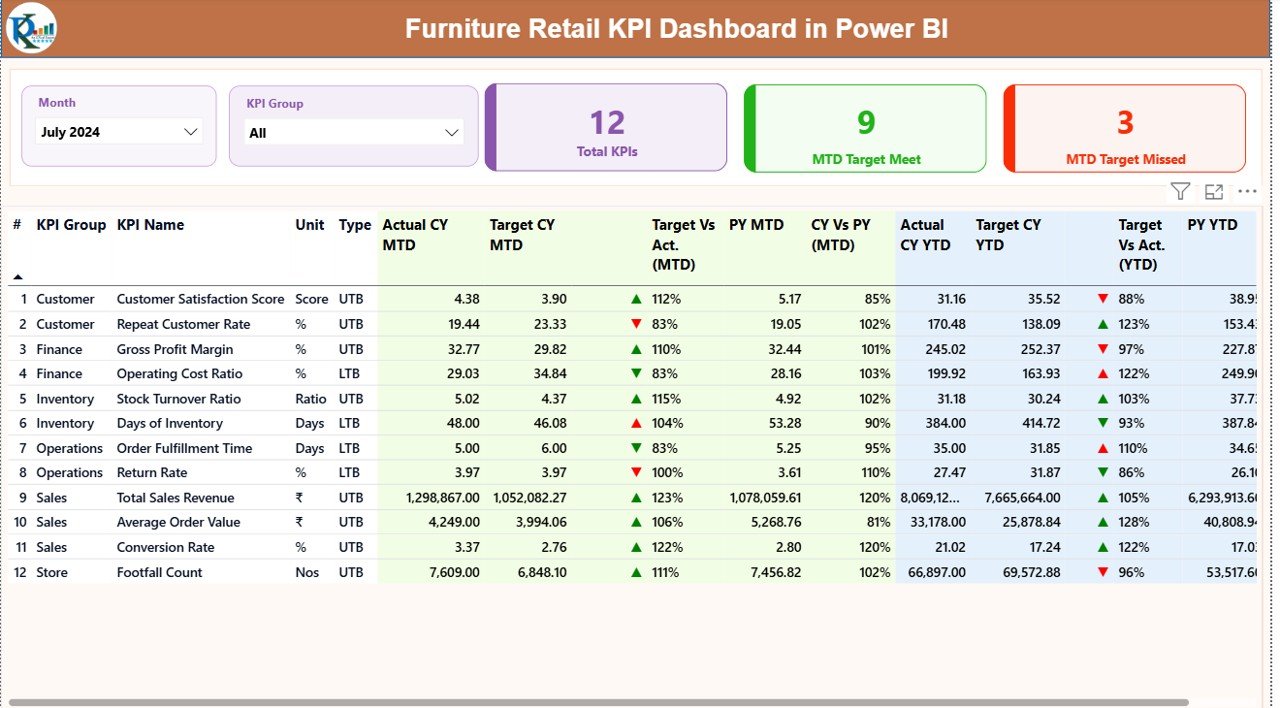
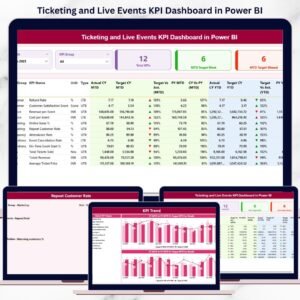
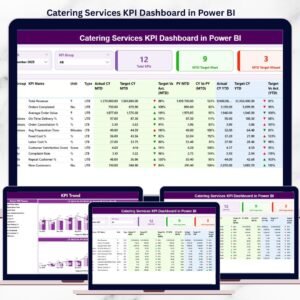
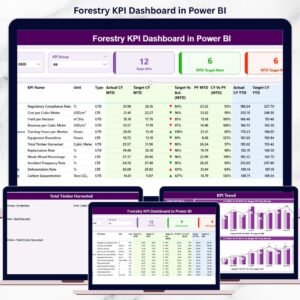
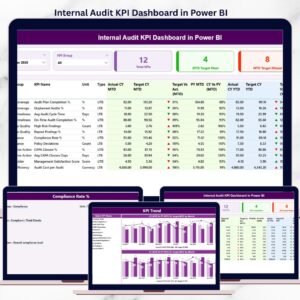
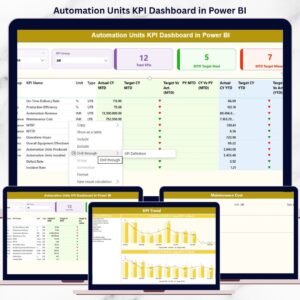
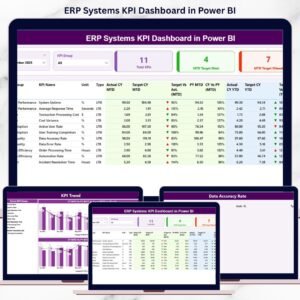
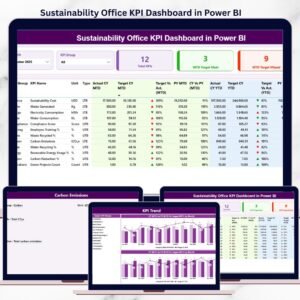
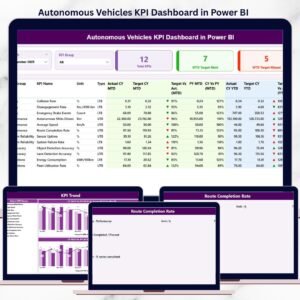
This dashboard converts your raw Excel data into a professional, interactive Power BI control panel that tracks Month-to-Date (MTD) and Year-to-Date (YTD) KPIs in real time. With clear visuals, performance indicators, and trend analysis, you can instantly see what is working, what is failing, and where action is needed.
Whether you manage a single showroom or a multi-store furniture retail operation, this dashboard helps you shift from reactive reporting to proactive performance management.
✅ Key Features of Furniture Retail KPI Dashboard in Power BI
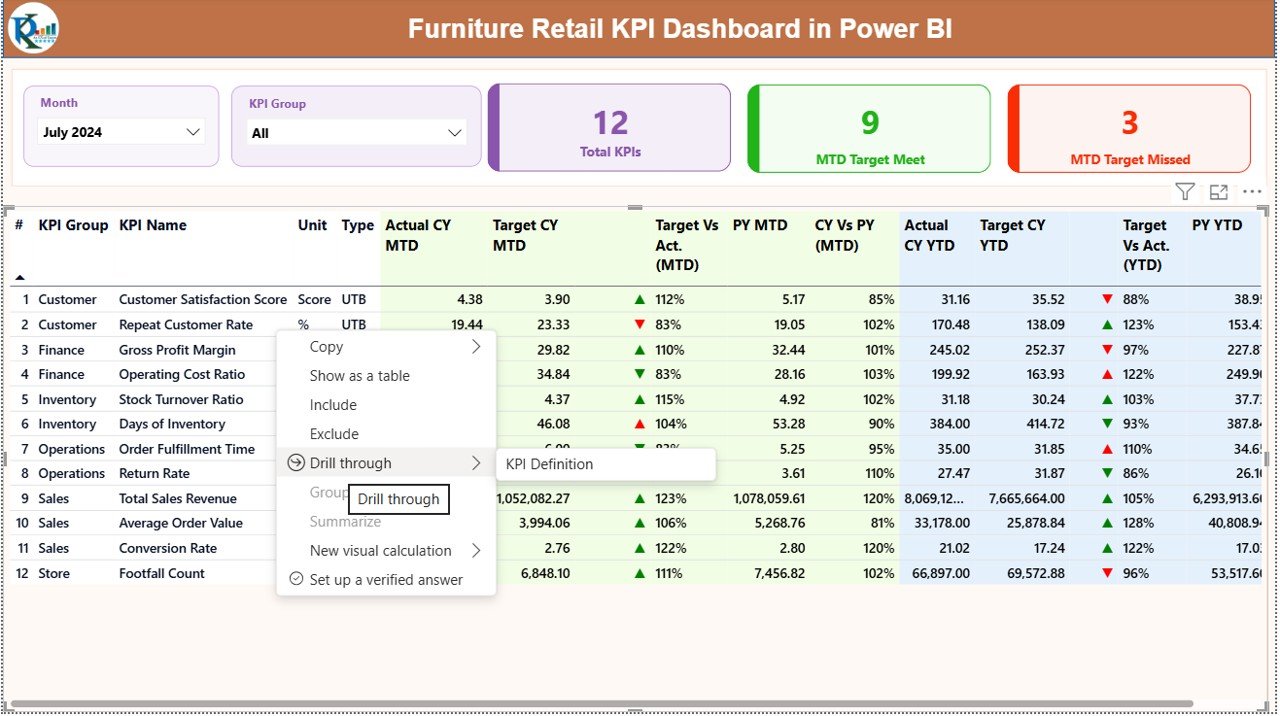
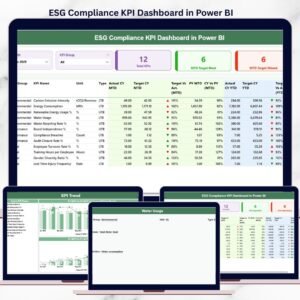
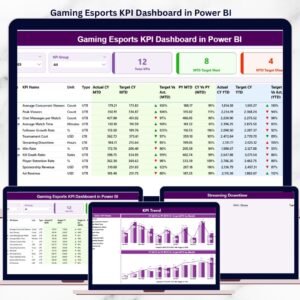
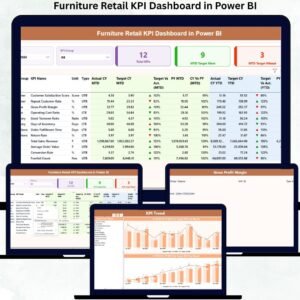
📊 Executive KPI Summary Page
Get a complete snapshot of KPI performance with Total KPIs, MTD Target Met, and MTD Target Missed cards for instant clarity.
🎯 Target vs Actual Performance Tracking
Track Current Year actuals against targets with automatic red/green indicators and performance arrows.
📈 MTD & YTD Analysis
Analyze Month-to-Date and Year-to-Date performance side by side for smarter planning and control.
🔁 Year-over-Year Comparison
Instantly compare current performance with previous year values to track real growth trends.
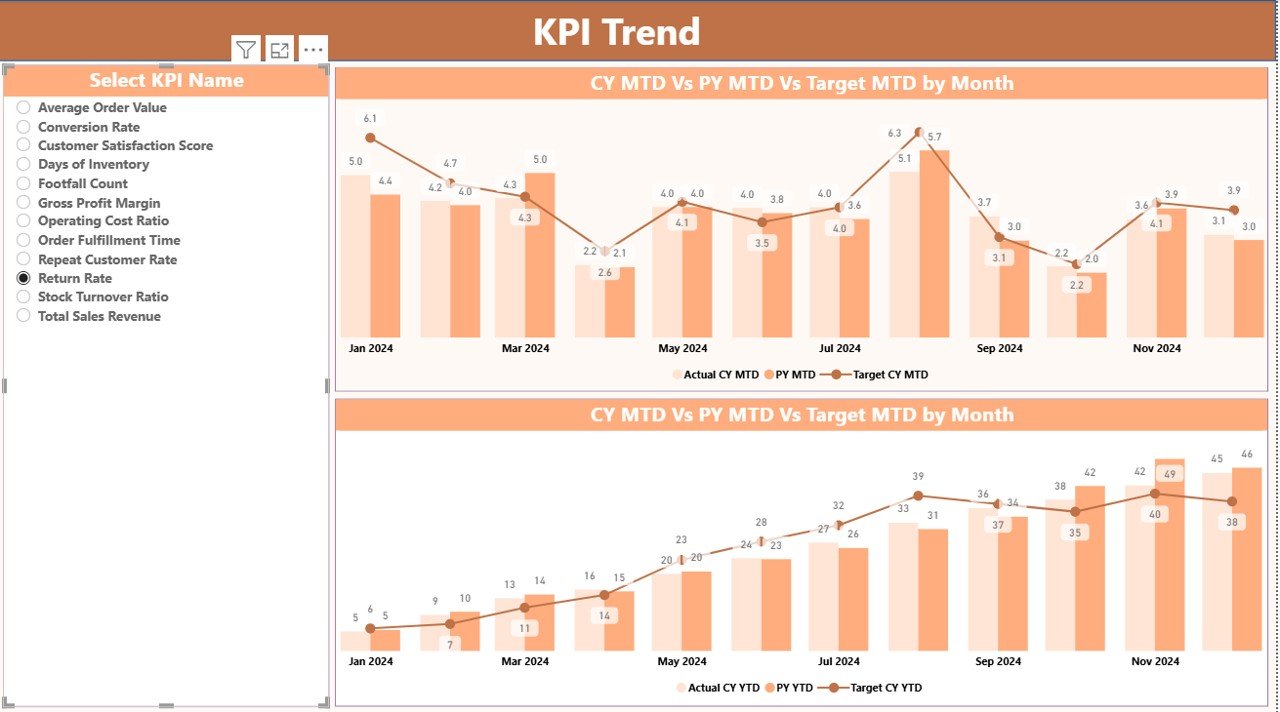
📉 Interactive KPI Trend Analysis
Use dynamic combo charts to visualize KPI movement across months for both MTD and YTD.
📁 Excel-Based Data Input
Simple Excel sheets for Actuals, Targets, and KPI Definitions—no complex databases required.
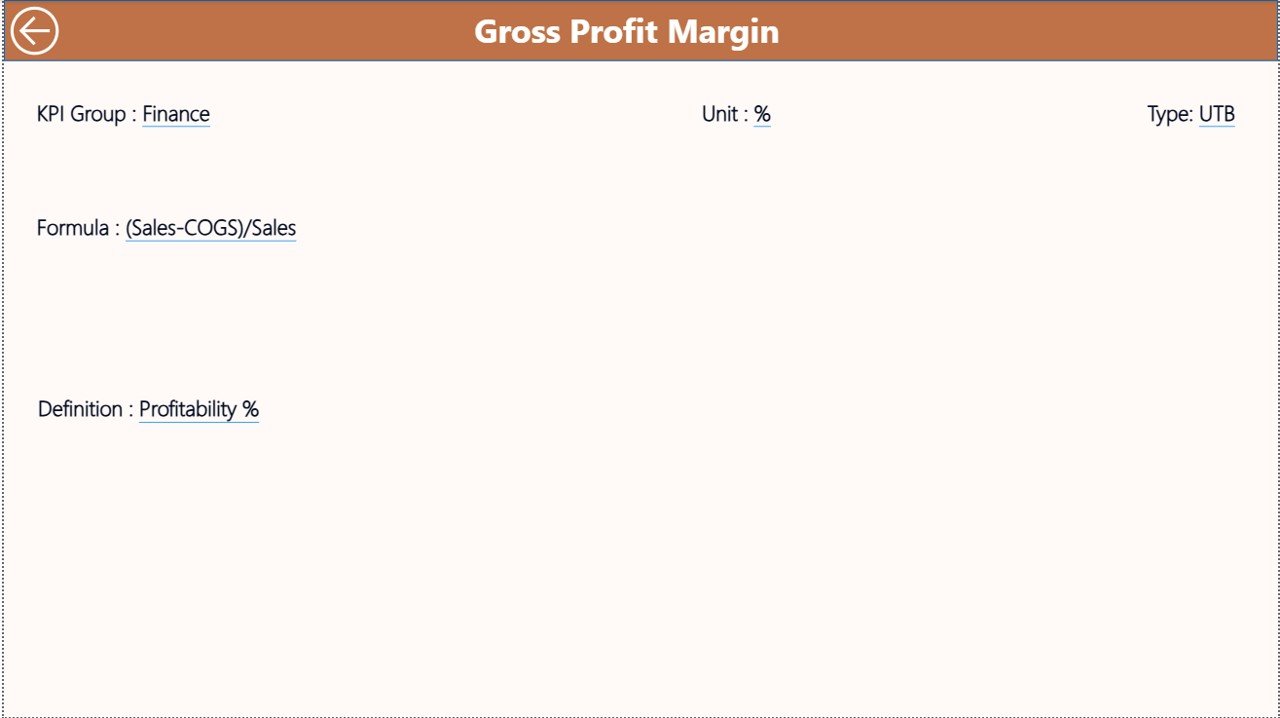
🧠 KPI Definition Drill-Through Page
Ensure team clarity with built-in KPI formulas, definitions, and KPI type (LTB/UTB).
⚡ Fast Refresh & Low Maintenance
Update Excel data, refresh Power BI, and your dashboard updates automatically.
📦 What’s Inside the Furniture Retail KPI Dashboard
📂 Power BI Desktop File (.pbix)
Fully designed dashboard with slicers, cards, tables, icons, and charts.
📂 Excel Data Template
Structured sheets for:
-
Input_Actual
-
Input_Target
-
KPI_Definition
📄 Pre-Configured KPIs & Calculations
MTD, YTD, Target vs Actual, CY vs PY, and icon logic already built.
🎛 Interactive Slicers
Filter by Month and KPI Group for focused analysis.
📊 Three Dashboard Pages
-
Summary Page
-
KPI Trend Page
-
KPI Definition (Drill-Through) Page
🛠 How to Use the Furniture Retail KPI Dashboard
1️⃣ Enter Actual KPI values in the Input_Actual Excel sheet
2️⃣ Enter KPI targets in the Input_Target Excel sheet
3️⃣ Maintain KPI structure in the KPI_Definition sheet
4️⃣ Open the Power BI file
5️⃣ Click Refresh
6️⃣ Instantly analyze MTD, YTD, trends, and performance gaps
No advanced Power BI skills required—basic Excel knowledge is enough ✅.
👥 Who Can Benefit from This Dashboard
🏬 Furniture Store Owners
📍 Regional & Area Managers
🧑💼 Sales & Operations Teams
📊 Retail & Business Analysts
🧠 Consultants & Strategy Teams
Perfect for single-store owners, large furniture chains, and consulting professionals handling retail performance reporting.
👉 Click here to read the Detailed blog post
Watch the step-by-step video tutorial:


Reviews
There are no reviews yet.