The Freight Tracking KPI Dashboard in Excel is a powerful analytics tool designed to help logistics and supply chain professionals monitor performance, costs, and delivery efficiency — all from one place. 📈
✨ Highlights:
-
7 Interactive Worksheets: Seamlessly structured to track, compare, and visualize freight performance metrics.
-
Dynamic Dashboard View: Instantly switch between Month-to-Date (MTD) and Year-to-Date (YTD) using simple dropdowns.
-
Automated Calculations: Real-time comparisons between Actual, Target, and Previous Year (PY) data with visual up/down arrows.
-
Intuitive Navigation Buttons: The Home Sheet acts as a control hub, making it easy to move across sheets with one click.
-
Data Accuracy & Visibility: Eliminate manual errors with automated formulas and clear KPI logic.
This Excel-based dashboard turns complex freight data into actionable insights — empowering faster, data-driven decisions 🚀.
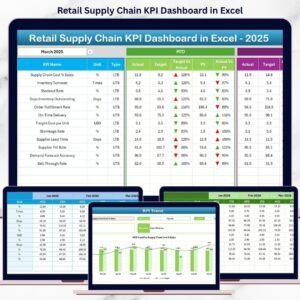
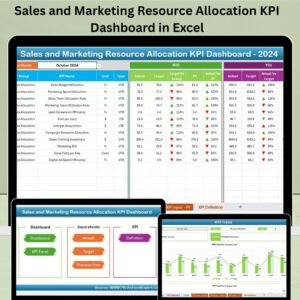
📊 What’s Inside the Freight Tracking KPI Dashboard in Excel
The template is thoughtfully designed with 7 structured worksheet tabs, each tailored to simplify freight analysis and reporting:
1️⃣ Home Sheet:
Acts as your control center. With six interactive buttons, you can instantly jump between the main sheets — making navigation smooth and professional.Freight Tracking KPI Dashboard in Excel
2️⃣ Dashboard Sheet:
The heart of the dashboard. Select any month from a dropdown and watch all KPIs auto-update to show MTD & YTD performance, including trend indicators and comparisons vs. targets and last year.
3️⃣ KPI Trend Sheet:
Dive deeper into each KPI’s movement over time. Select a KPI from the dropdown to see trend charts, KPI definitions, and unit of measurement. Perfect for identifying improvement opportunities.Freight Tracking KPI Dashboard in Excel
4️⃣ Actual Numbers Input Sheet:
The data foundation! Enter your monthly MTD and YTD actuals here. Once you set the base month, everything updates dynamically.
5️⃣ Target Sheet:
Input monthly or annual targets for every KPI to compare performance against expectations.
6️⃣ Previous Year Numbers Sheet:
Store last year’s data for accurate year-over-year benchmarking.
7️⃣ KPI Definition Sheet:
A built-in reference guide defining every KPI’s formula, logic, unit, and type (UTB/LTB) for consistency and transparency.
These interconnected sheets make freight performance reporting fast, accurate, and visually engaging.
⚙️ How to Use the Freight Tracking KPI Dashboard in Excel
Using this dashboard is incredibly simple — no coding or advanced Excel knowledge needed! 💡
1️⃣ Start with the “Actual Numbers Input” Sheet
Enter your monthly data — delivery times, freight costs, delays, etc.
2️⃣ Set Your Targets
Use the “Target” sheet to define MTD and YTD goals.
3️⃣ Add Previous Year Data
Benchmark performance year-over-year using the “Previous Year Numbers” sheet.
4️⃣ Review the Dashboard
The “Dashboard” tab will auto-refresh to show real-time visuals, KPI comparisons, and performance indicators.
5️⃣ Analyze KPI Trends
In the “KPI Trend” sheet, choose any KPI to explore detailed trends across months.
6️⃣ Use the KPI Definition Sheet
Get instant clarity on KPI formulas, helping your team interpret data correctly.
In just a few minutes, you’ll transform raw logistics data into a professional freight performance dashboard that’s presentation-ready. 🎯
👥 Who Can Benefit from This Freight Tracking KPI Dashboard in Excel
This tool is built for professionals who need quick, clear, and actionable insights into freight operations.
💼 Logistics Managers: Track carrier performance, transit times, and delivery rates.
🏭 Manufacturing & Retail Teams: Monitor outbound shipments, costs, and supply delays.
🚚 Supply Chain Analysts: Compare trends, identify inefficiencies, and improve route efficiency.
💰 Finance Teams: Control freight budgets and identify cost-saving opportunities.
📦 3PL Companies: Provide transparent performance reports to clients.
Whether you manage 10 shipments or 10,000, this dashboard scales effortlessly — ensuring accuracy, visibility, and operational excellence.
💡 Why Choose Excel for Freight KPI Tracking?
-
✅ No Extra Software Needed — Fully built in Microsoft Excel.
-
🧩 Customizable — Modify formulas, visuals, and KPI definitions to suit your needs.
-
💻 Offline Access — Analyze anywhere, anytime.
-
📤 Easy Data Import/Export — Connect to ERP or TMS data effortlessly.
-
🎨 Interactive Visuals — Trend charts and colored arrows make insights pop!
🚀 Final Thoughts
The Freight Tracking KPI Dashboard in Excel is more than just a report — it’s a strategic tool that drives logistics efficiency, cost control, and decision-making.
📊 From MTD/YTD tracking to KPI trend visualization and benchmarking — every feature is designed to simplify analysis, boost accuracy, and support continuous improvement.Freight Tracking KPI Dashboard in Excel


Reviews
There are no reviews yet.