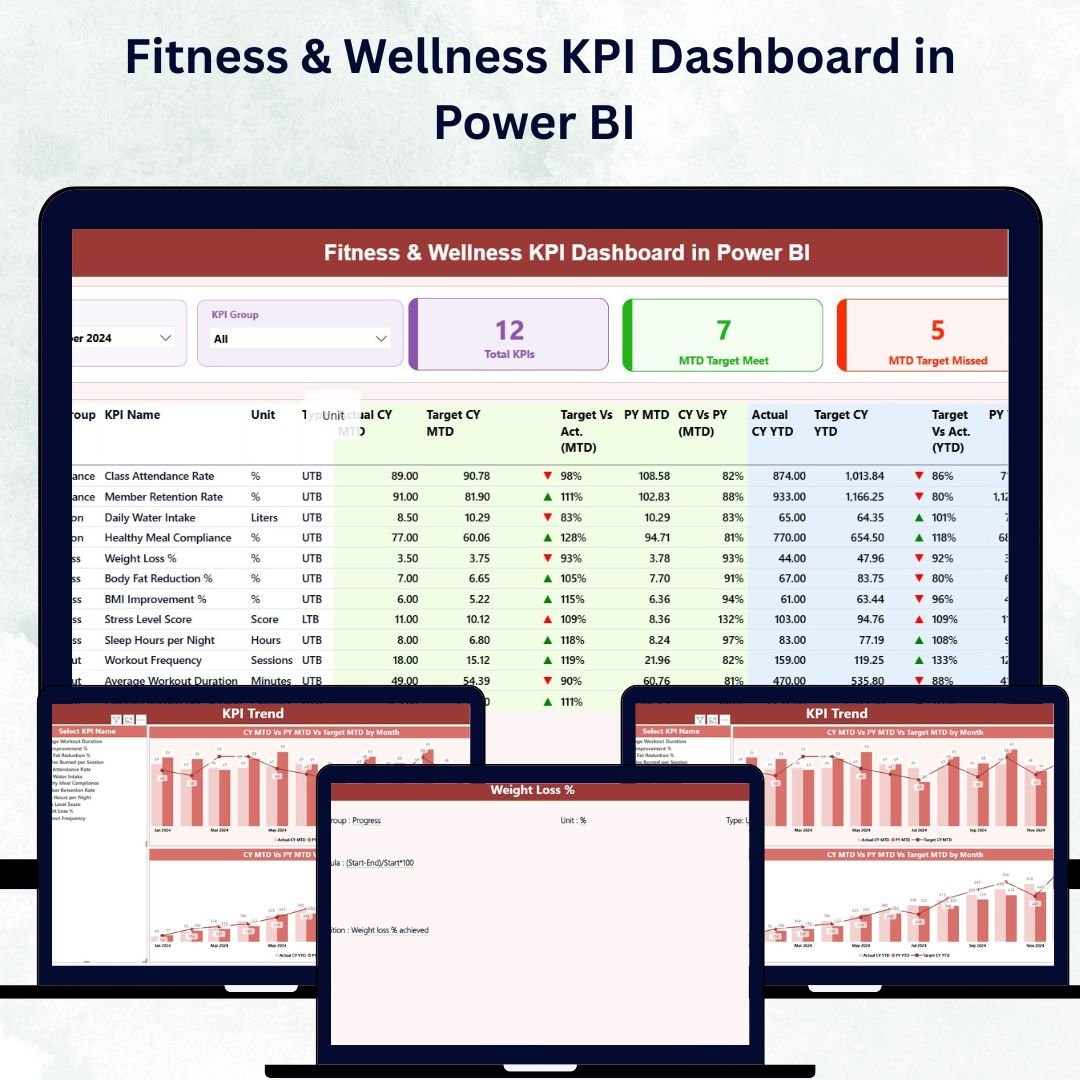
Fitness & Wellness KPI Dashboard in Power BI In the dynamic world of health and wellness, success depends on data-driven performance. Fitness & Wellness KPI Dashboard in Power BI Whether you run a gym, spa, wellness center, or corporate fitness program, you need to know how well your business is performing — across memberships, engagement, financials, and satisfaction.
The Fitness & Wellness KPI Dashboard in Power BI is a ready-to-use, interactive solution designed to track and visualize every key performance indicator (KPI) that drives your success. Built with Microsoft Power BI and Excel data integration, it gives you real-time visibility into your fitness operations, helping you make smarter decisions with confidence 💪.
This powerful dashboard turns raw data into beautiful visuals, empowering fitness managers, trainers, and executives to measure results, monitor trends, and improve efficiency across all areas of their business.
⚙️ Key Features of the Fitness & Wellness KPI Dashboard in Power BI
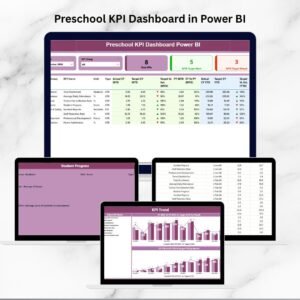
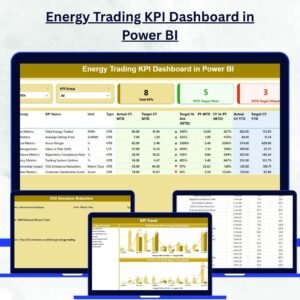
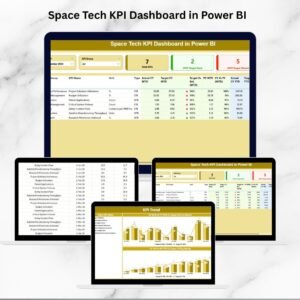
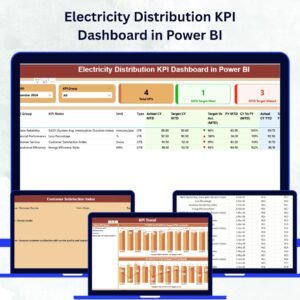
📊 3 Interactive Pages – Summary, KPI Trend, and KPI Definition, providing both macro and micro-level insights.
🎯 Excel-Powered Data Source – Easy integration using Actual, Target, and KPI Definition sheets.
📈 Real-Time Performance View – Instantly see which KPIs are on target, and which need improvement.
🟢 Conditional Icons & Colors – Visual cues like arrows and color codes simplify data interpretation.
💡 Drill-Through Analysis – Right-click on KPIs to view detailed definitions, formulas, and calculations.
📆 Month & KPI Group Filters – Analyze specific months or focus on key business areas.
⚙️ Automated Updates – Refresh data directly from Excel for live, error-free insights.
📱 Power BI Integration – Access insights anywhere, on desktop or mobile.
📦 Dashboard Structure Overview
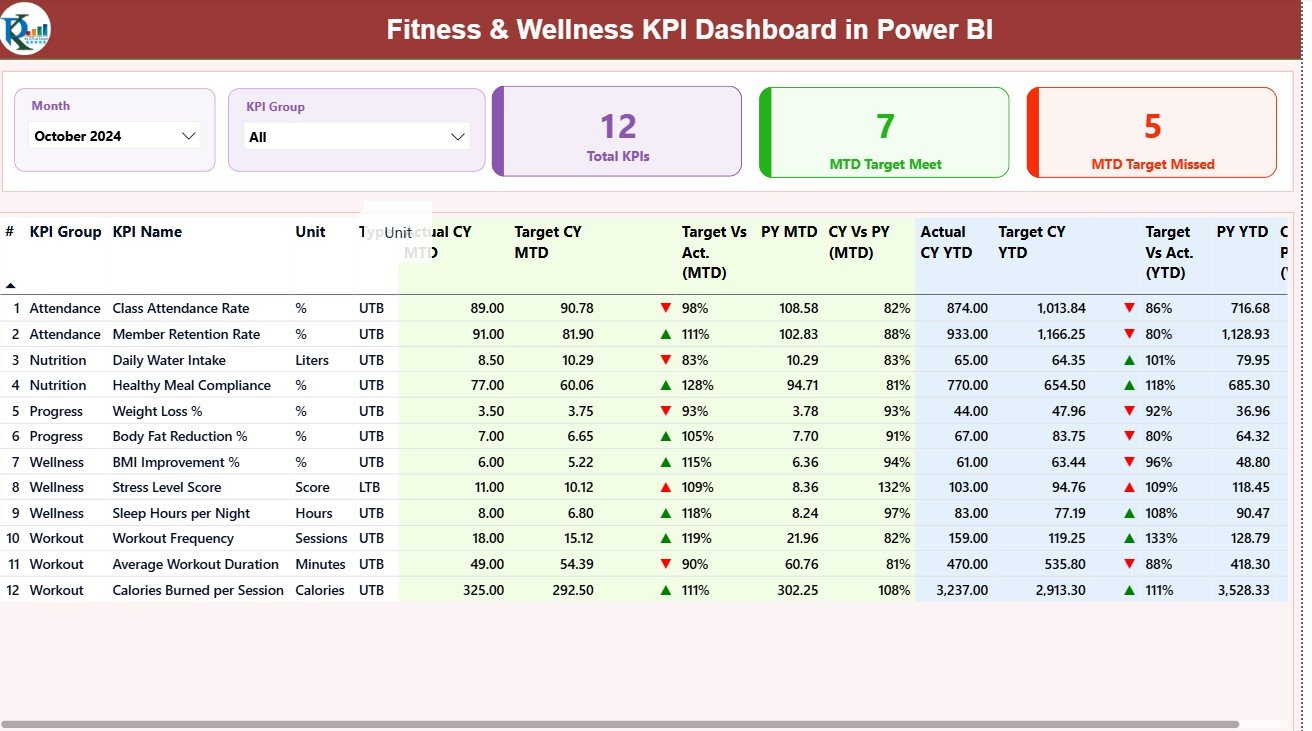
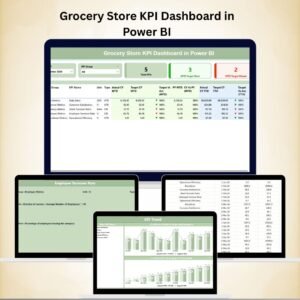
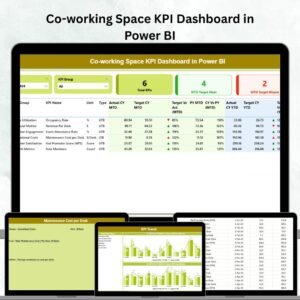
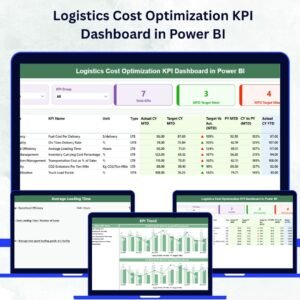
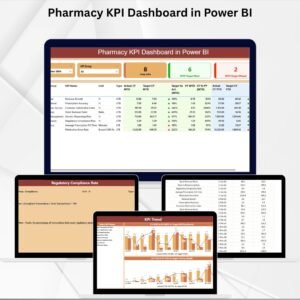
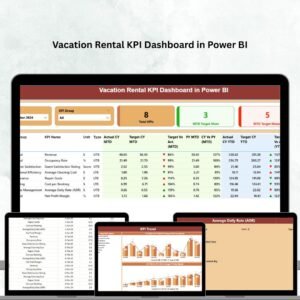
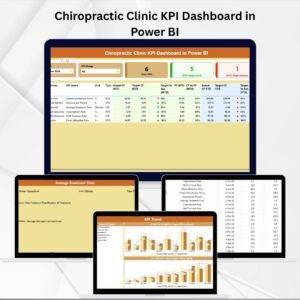
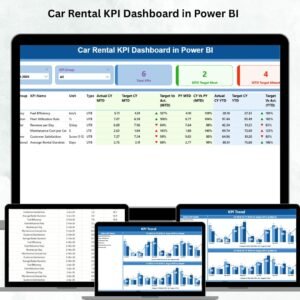
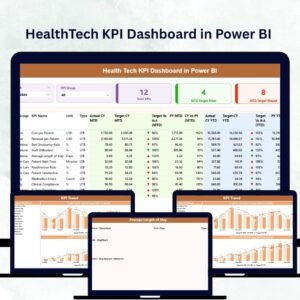
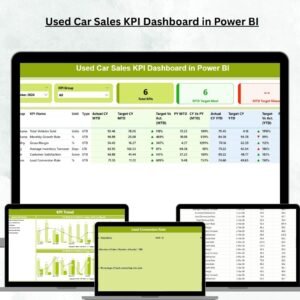
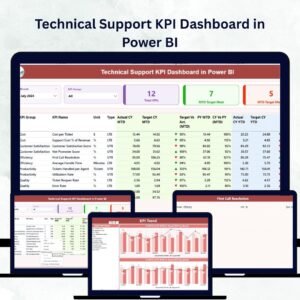
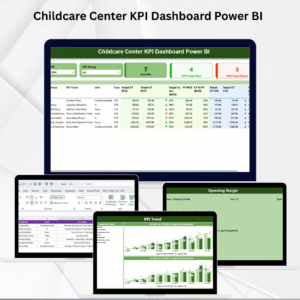
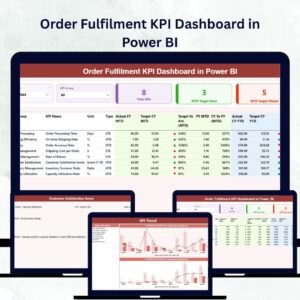
1️⃣ Summary Page – High-Level Business Overview
Your central performance hub 🏋️.
-
Month and KPI Group Slicers: Filter by time or department (Finance, Operations, Membership).
-
KPI Summary Cards:
-
Total KPIs Count
-
MTD Target Met Count
-
MTD Target Missed Count
-
-
Detailed KPI Table: Displays KPI Name, Unit, Type (LTB/UTB), MTD/YTD Actuals vs Targets, variance percentages, and trend arrows.
This section provides a quick snapshot of how your business is performing this month and year-to-date.
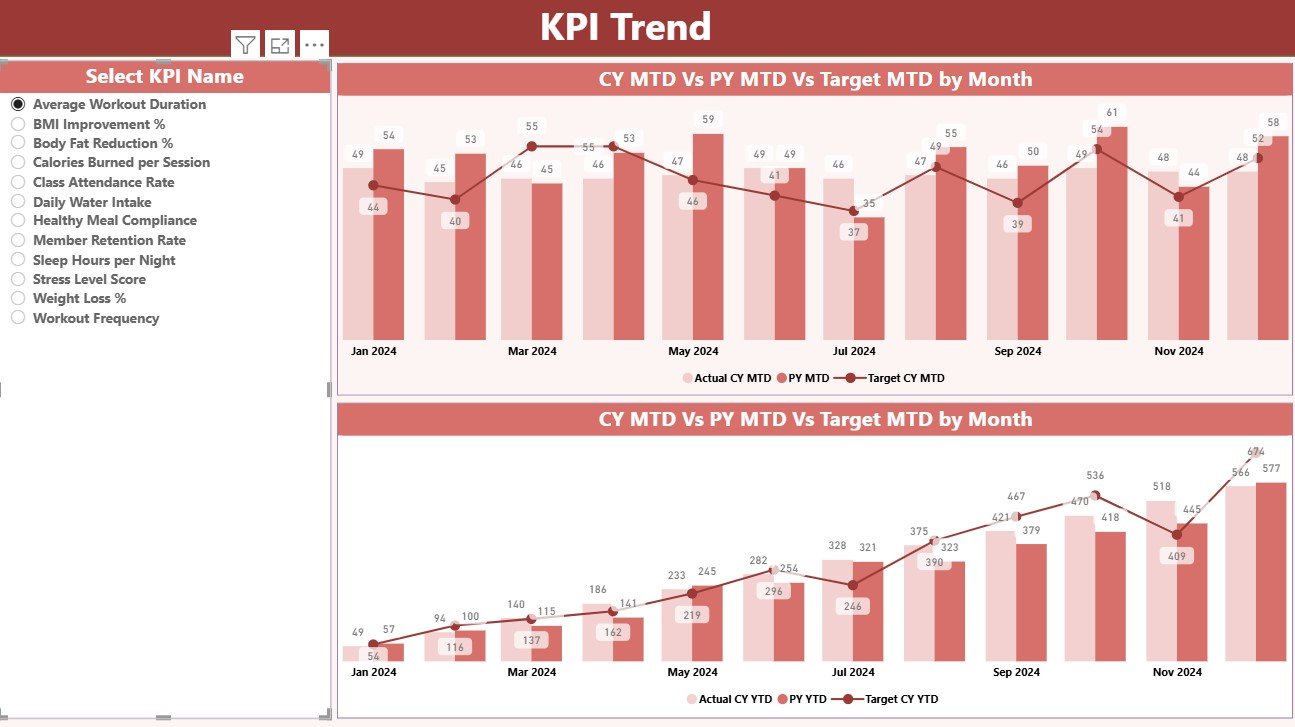
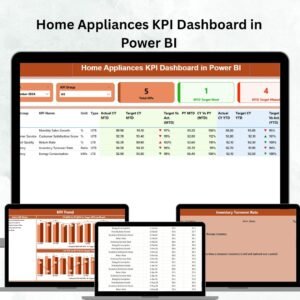
2️⃣ KPI Trend Page – Track Performance Over Time
Visualize your KPIs with dual combo charts 📊.
-
Select any KPI name to display MTD and YTD performance.
-
Compare Actual, Target, and Previous Year data side by side.
-
Identify growth patterns, dips, or seasonal fluctuations easily.
Perfect for fitness managers who want to track consistent performance improvements.
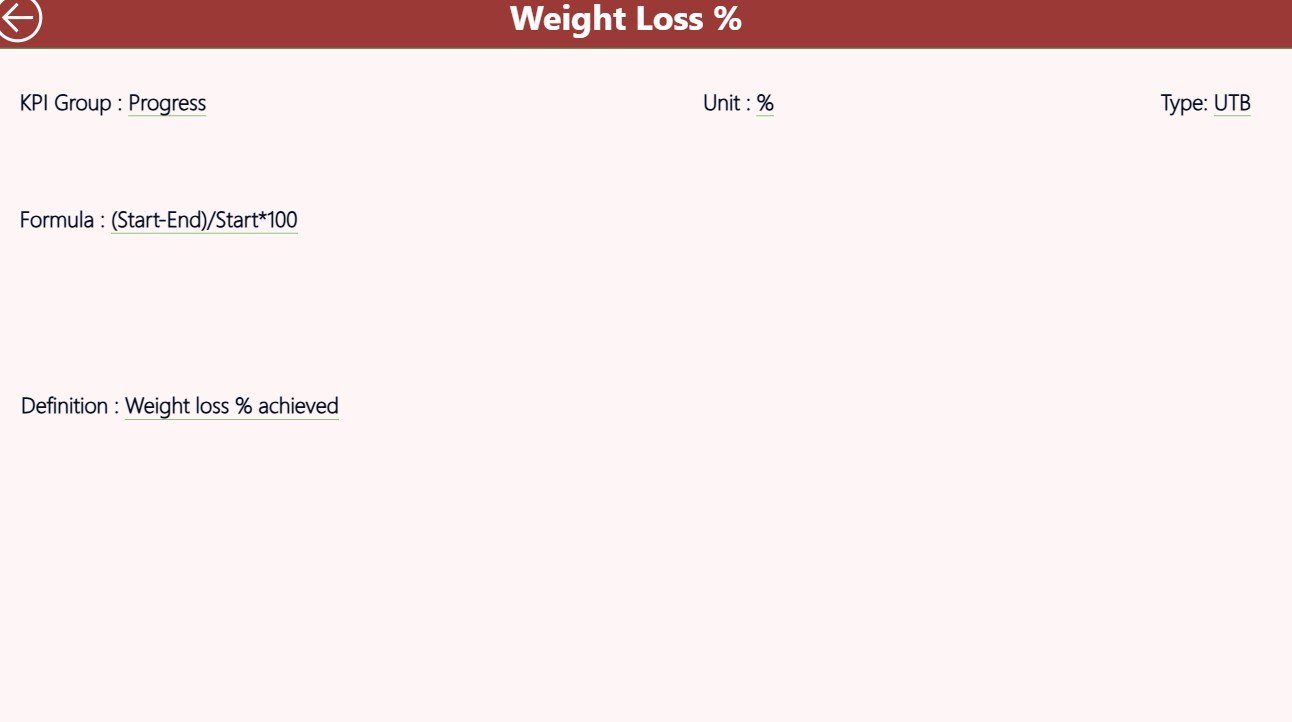
3️⃣ KPI Definition Page – The Insight Engine
Understand every KPI in depth.
-
Access this page through drill-through from the Summary view.
-
View KPI Formula, Definition, Unit, and Type (Upper or Lower the Better).
This ensures clarity, consistency, and transparency for all team members.
🧮 Excel Data Source Structure
The dashboard connects to an Excel workbook with three sheets:
📘 Input Actual Sheet – Enter Actual data (KPI Name, Month, MTD, YTD).
📗 Input Target Sheet – Enter Target values for the same KPIs.
📙 KPI Definition Sheet – Define KPI Number, Group, Unit, Formula, and Definition.
Once data is refreshed in Power BI, visuals update automatically — eliminating manual reports and calculations.
🧠 Example KPIs to Track
💰 Financial KPIs – Monthly Revenue, Average Revenue per Member, Retention Rate, Cost per Session.
🏋️ Operational KPIs – Member Attendance %, Class Utilization %, Trainer Efficiency, Equipment Downtime (Hours).
🧍 Customer KPIs – Satisfaction Score, NPS, Referral Rate, Feedback Response %.
🧑🏫 Training KPIs – Sessions per Trainer, Trainer Rating %, Average Workout Duration, Cancellation Rate %.
These metrics provide a 360° view of your performance, helping you enhance both member experience and profitability.
🌟 Advantages of the Fitness & Wellness KPI Dashboard in Power BI
✅ Live Data Visualization – Real-time updates for accurate decision-making.
✅ Comprehensive Analytics – Track MTD, YTD, and Previous Year comparisons.
✅ Improved Business Intelligence – Identify trends, opportunities, and problem areas instantly.
✅ Automation & Accuracy – No manual reporting; Power BI handles all calculations.
✅ Customizable Layout – Add or remove KPIs as per your fitness model.
✅ Scalable & Secure – Suitable for gyms, franchises, and corporate wellness setups.
💡 Best Practices for Effective Dashboard Use
-
🎯 Align KPIs with your organization’s goals.
-
📅 Refresh Excel data monthly or weekly.
-
🟢 Use slicers for targeted analysis.
-
📈 Compare with previous years for long-term growth trends.
-
🤝 Involve trainers, managers, and finance teams in performance reviews.
-
🔁 Continuously refine KPIs based on business evolution.


Reviews
There are no reviews yet.