
Fitness studios operate in a fast-paced, results-driven environment where every membership signup, class attendance, trainer hour, and retention metric directly impacts revenue and long-term growth. However, many studio owners and managers still depend on scattered Excel files, manual reports, or delayed summaries. As a result, they struggle to spot performance gaps, monitor targets, and take timely action.
That is where the Fitness Studios KPI Dashboard in Power BI becomes a powerful game-changer. This ready-to-use dashboard converts raw operational data into clear, interactive, and actionable insights, helping fitness businesses track performance confidently across Month-to-Date (MTD) and Year-to-Date (YTD) periods. Instead of guessing, you gain complete visibility into what is working and what needs immediate attention.
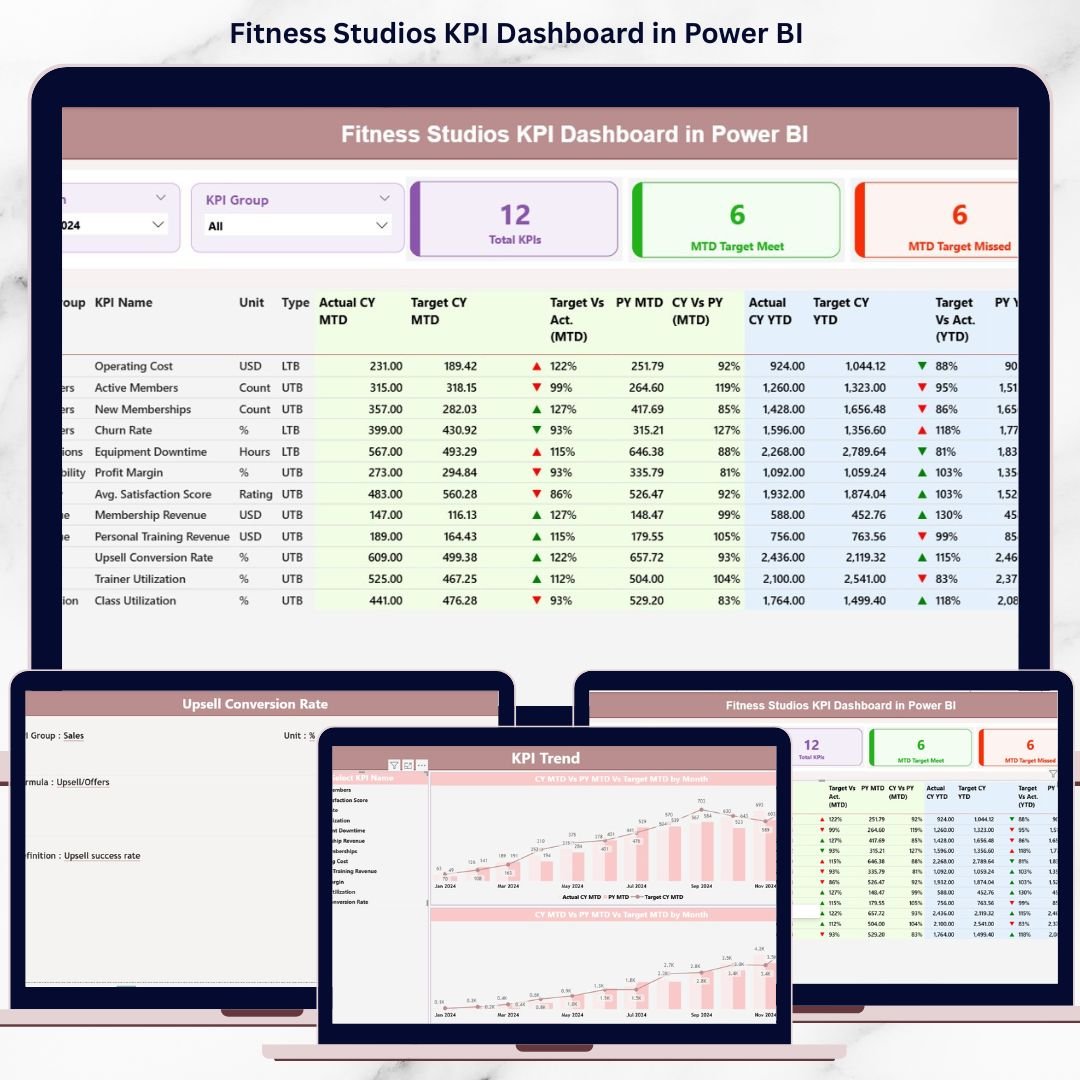
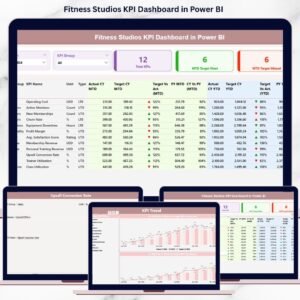
Designed for real-world fitness studio operations, this dashboard combines the simplicity of Excel data entry with the analytical power of Power BI visuals, making performance monitoring both easy and effective.Fitness Studios KPI Dashboard in Power BI
🔑 Key Features of Fitness Studios KPI Dashboard in Power BI
💪 Centralized KPI Monitoring – Track all critical fitness studio KPIs in one structured and interactive dashboard.
📊 MTD & YTD Performance Tracking – Monitor short-term progress and long-term performance simultaneously.
🎯 Target Achievement Indicators – Instantly identify target met or missed KPIs using clear up/down icons.
📈 Trend Analysis with Combo Charts – Analyze historical trends for any KPI with dynamic MTD and YTD charts.
🔍 Interactive Slicers – Filter data by Month, KPI Group, and KPI Name for focused analysis.
📋 Detailed KPI Definitions – Avoid confusion with clear KPI formulas, units, and business explanations.
⚡ Fast Refresh with Excel Data Source – Update data quickly without complex integrations.
📌 Professional, Business-Ready Layout – Clean design suitable for owners, managers, and leadership teams.
📦 What’s Inside the Fitness Studios KPI Dashboard in Power BI
This digital product includes a Power BI Desktop (.pbix) file connected to a structured Excel data source, designed for scalability and ease of use.
📄 Power BI Pages
-
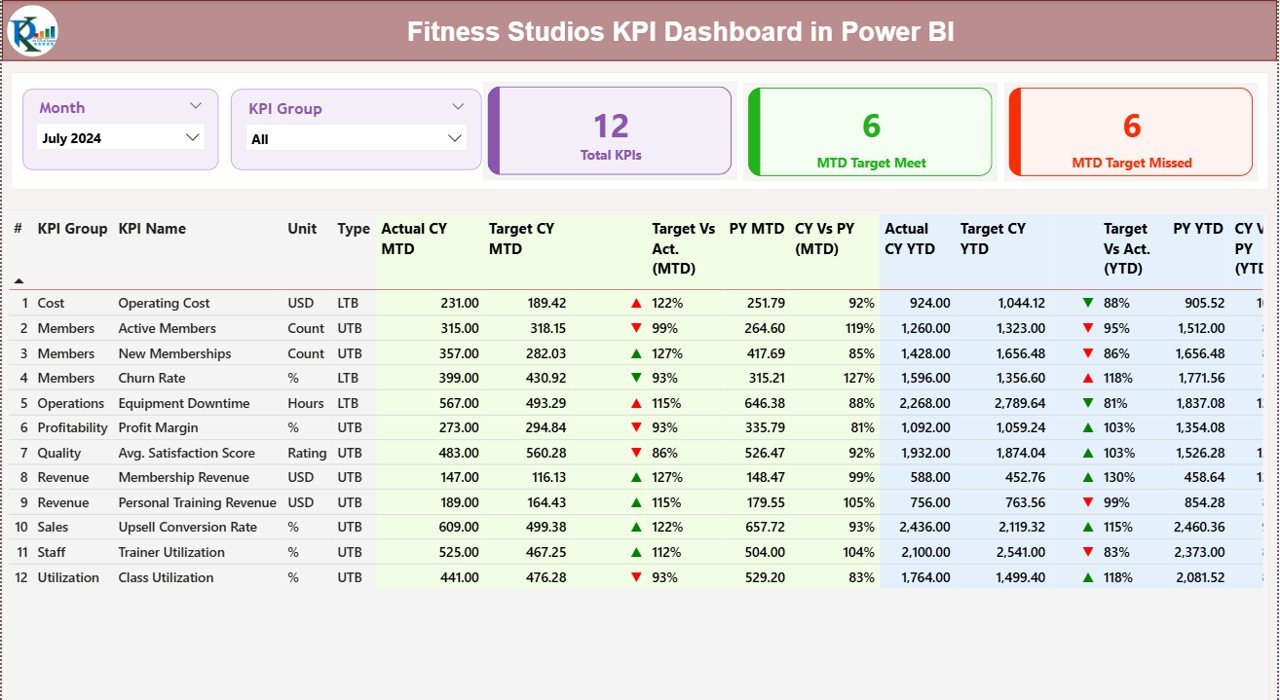
Summary Page – High-level KPI overview with slicers, performance cards, and a detailed KPI table.
-
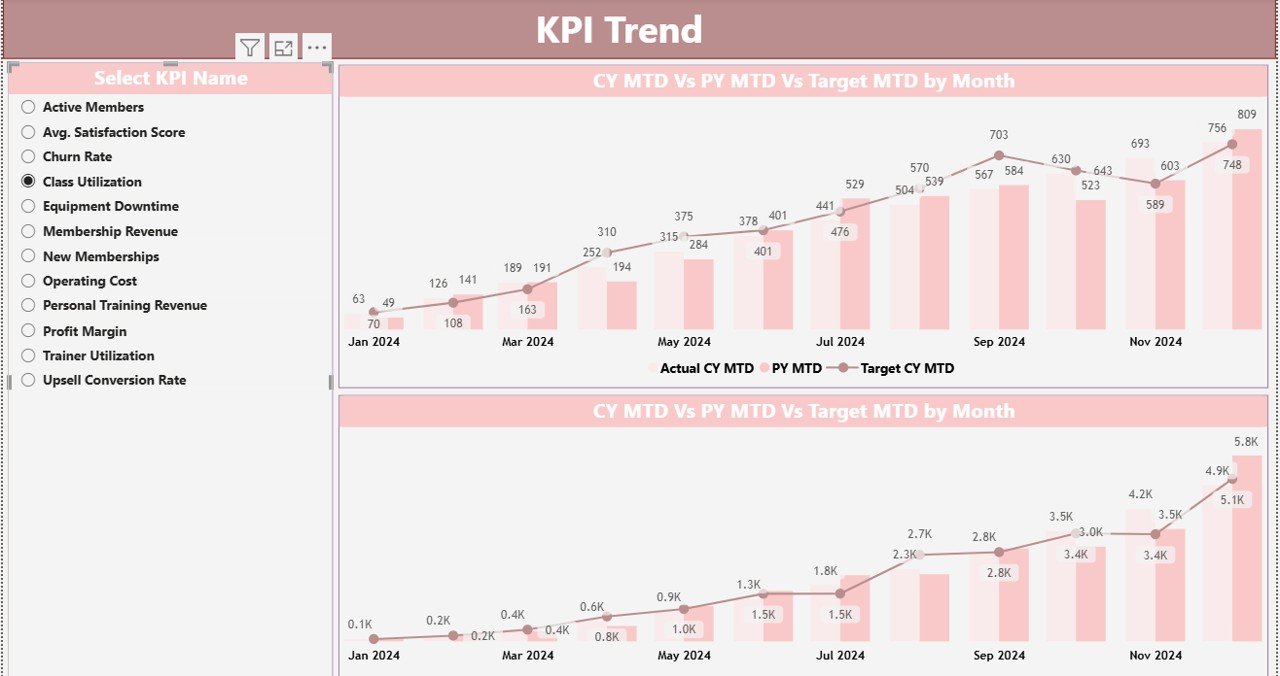
KPI Trend Page – Visual analysis of KPI trends using combo charts for actuals, targets, and previous year data.
-
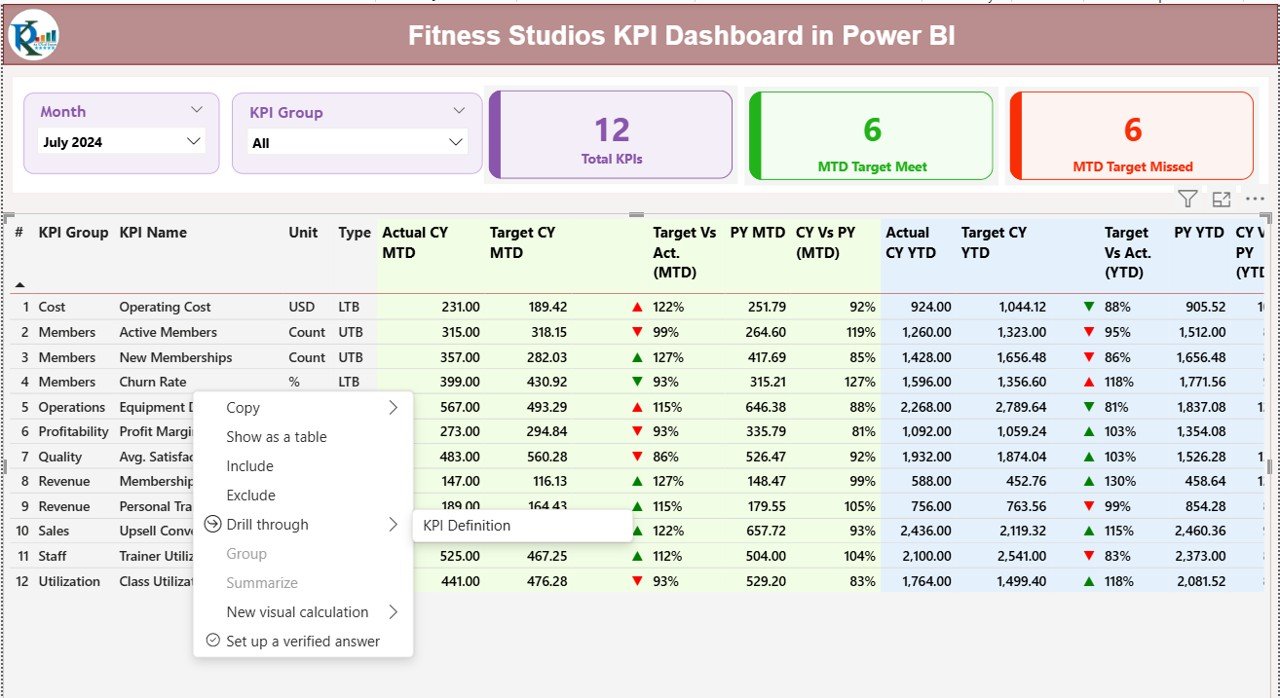
KPI Definition Page – Drill-through documentation explaining each KPI clearly.
📊 Excel Data Source Sheets
-
Input_Actual – Enter MTD and YTD actual performance values.
-
Input_Target – Maintain monthly and yearly target values.
-
KPI Definition – Store KPI names, groups, units, formulas, and types (UTB / LTB).
This structure ensures accuracy, consistency, and easy future expansion.Fitness Studios KPI Dashboard in Power BI
🧭 How to Use the Fitness Studios KPI Dashboard in Power BI
🚀 Step 1: Enter actual KPI values in the Input_Actual Excel sheet.
🎯 Step 2: Update monthly and yearly targets in the Input_Target sheet.
📘 Step 3: Maintain clear KPI definitions in the KPI Definition sheet.
🔄 Step 4: Refresh the Power BI dashboard to load updated data.
📅 Step 5: Use slicers to analyze performance by month or KPI group.
📊 Step 6: Review icons, percentages, and trends to make data-driven decisions.
No advanced Power BI skills are required. The dashboard is intuitive, user-friendly, and business-ready.
👥 Who Can Benefit from This Fitness Studios KPI Dashboard in Power BI
🏋️ Fitness Studio Owners – Track growth, retention, and profitability with clarity.
🏢 Gym & Studio Managers – Monitor daily and monthly operational performance.
📊 Operations & Performance Heads – Identify gaps and improvement opportunities early.
📈 Franchise Managers – Compare performance across locations consistently.
💼 Business Analysts & Finance Teams – Support strategic planning with reliable KPI insights.
Whether you manage a single studio or a growing fitness brand, this dashboard adapts to your needs.


Reviews
There are no reviews yet.