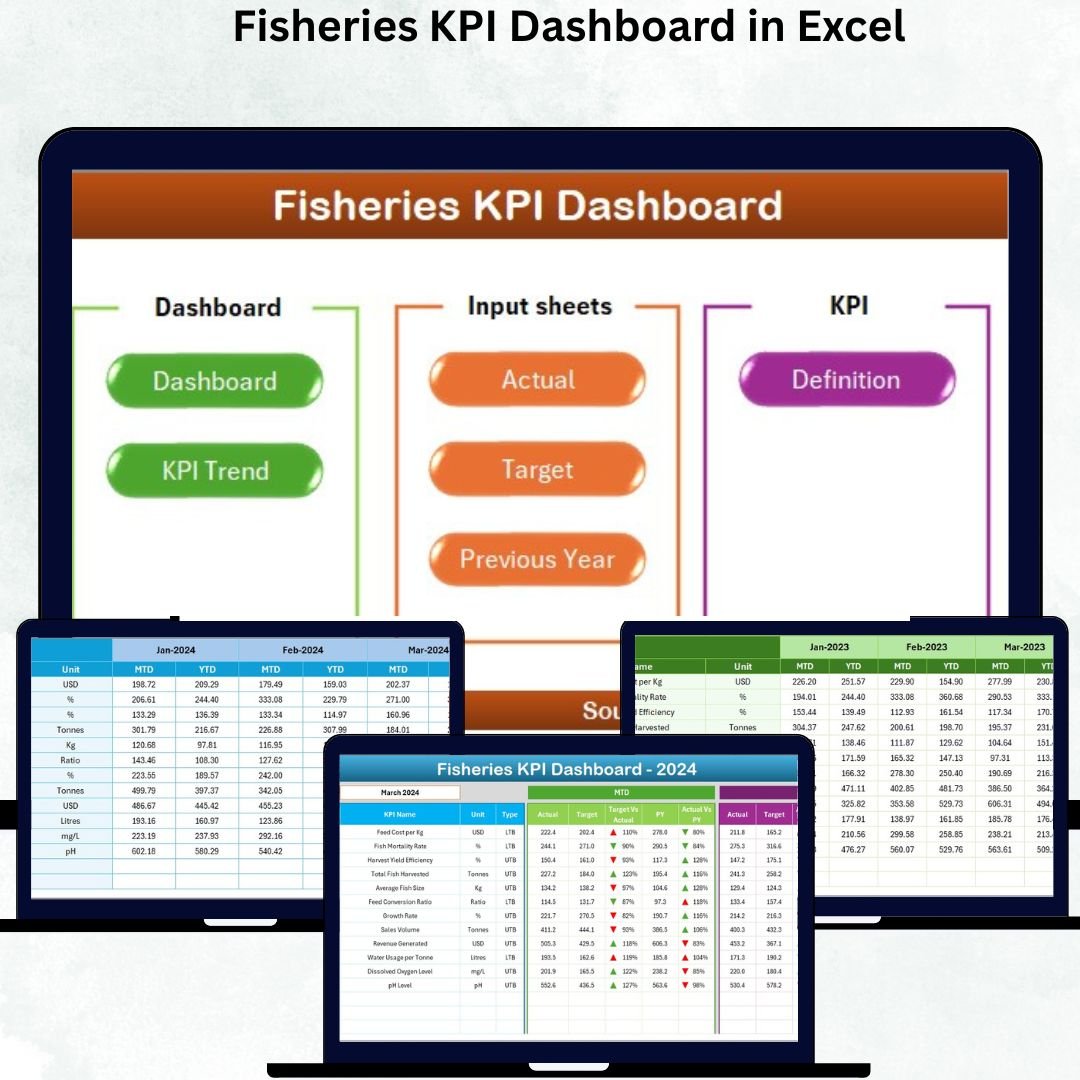
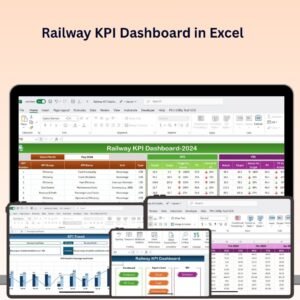
The fisheries and aquaculture sector plays a crucial role in global food security, trade, and livelihoods. However, managing complex operations — from catch performance and vessel utilization to sustainability targets — requires data-driven precision. The Fisheries KPI Dashboard in Excel is your all-in-one, ready-to-use solution to monitor, analyze, and visualize operational and environmental KPIs in one interactive file.
Built entirely in Microsoft Excel, this professional dashboard helps fisheries managers, aquaculture farms, and government agencies track Month-to-Date (MTD) and Year-to-Date (YTD) results with visual clarity. It transforms raw operational data into actionable insights through dynamic charts, automated calculations, and color-coded performance indicators — all within Excel’s familiar environment.
No coding. No external software. Just a powerful, Excel-based performance management system that works for fisheries of any scale.
⚙️ Key Features of the Fisheries KPI Dashboard in Excel
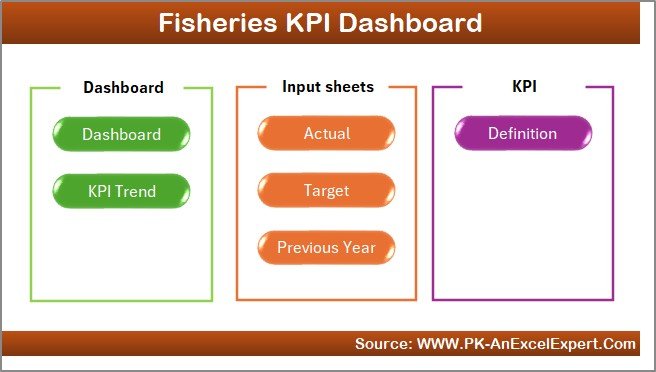
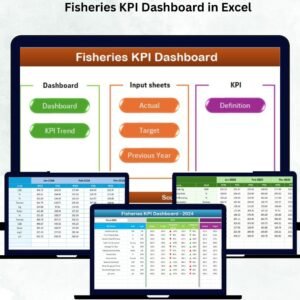
📊 7 Integrated Sheets – Home, Dashboard, KPI Trend, Actual Numbers, Target, Previous Year, and KPI Definition.
📅 Month Selector – Select any month to refresh all visuals instantly.
🎯 MTD & YTD Comparison – Track progress against targets and previous years.
📈 Conditional Formatting – Green/red arrows to highlight performance trends.
💡 Interactive Charts – Visualize KPI performance and trends clearly.
📘 KPI Library – Definitions, formulas, and units stored for transparency.
⚙️ Auto-Update Mechanism – Formulas and charts refresh dynamically.
🧩 Customizable Framework – Add, edit, or remove KPIs anytime.
💻 User-Friendly Navigation – Home sheet buttons for easy movement between pages.
📤 Report-Ready Layout – Perfect for management reporting and audits.
📂 What’s Inside the Fisheries KPI Dashboard
🏠 1️⃣ Home Sheet – Central Navigation Hub
The Home Sheet serves as the control panel for the entire file.
-
Six interactive buttons for instant access to all sheets.
-
Eliminates manual scrolling or searching.
-
Ideal for users with minimal Excel experience.
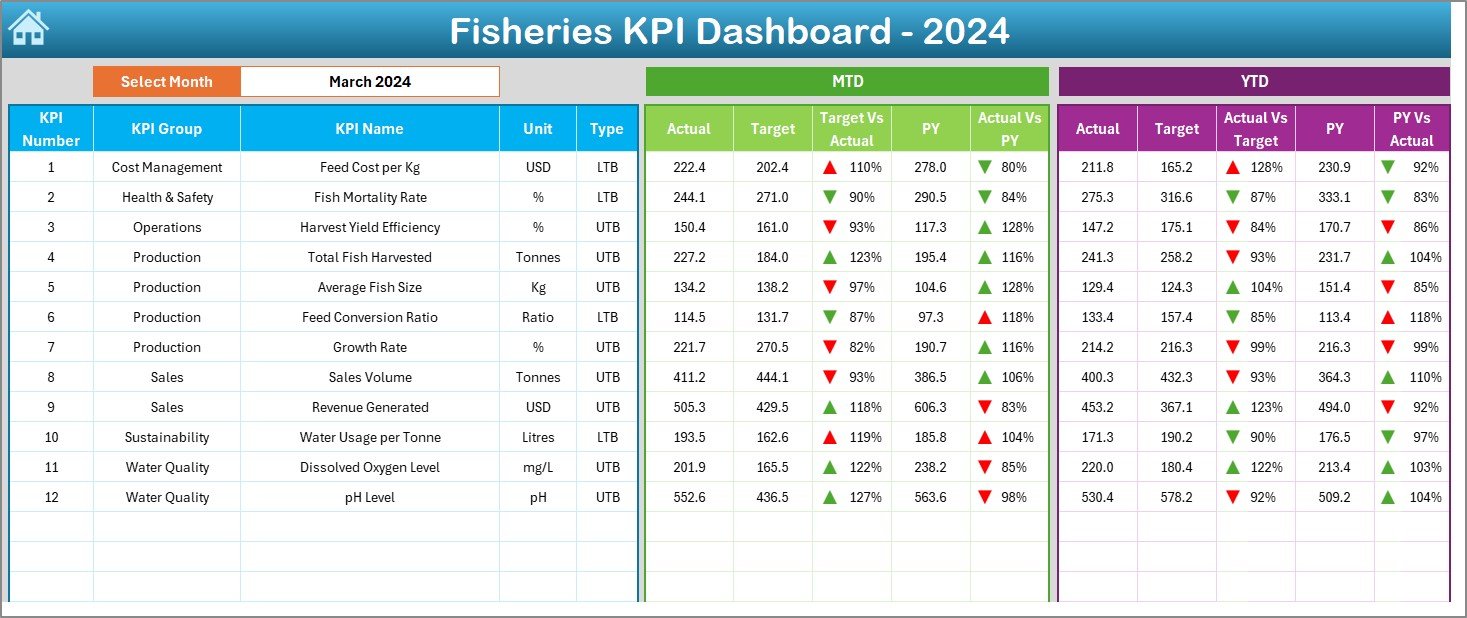
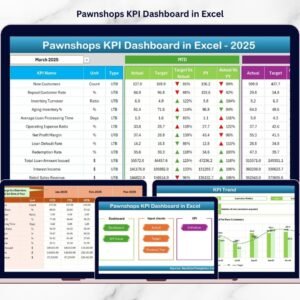
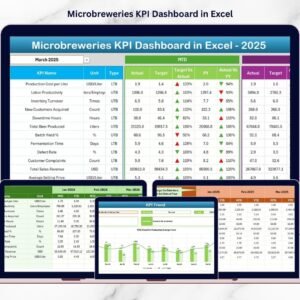
📊 2️⃣ Dashboard Sheet – Performance Overview
Your main performance dashboard — where real-time data comes to life.
-
Month Selector (Cell D3): Pick a month and all metrics auto-update.
-
Displays Actual, Target, and Previous Year data for MTD and YTD.
-
Shows Target vs Actual (%) and Previous Year vs Actual (%) comparisons.
-
Visual arrows:
🟢 Green = Improved performance
🔴 Red = Decline in performance
Example KPIs Tracked:
🐟 Total Catch Volume (Tons)
🚢 Catch per Vessel (kg/day)
📏 Average Size of Fish (cm)
⛽ Fuel Consumption per Ton Caught (L/Ton)
🕒 Equipment Downtime (Hours)
📦 On-Time Shipment Rate (%)
⚰️ Fish Mortality Rate (%)
🍽️ Feed Conversion Ratio (FCR)
🏭 Processing Yield (%)
💰 Revenue per Ton (USD)
This gives a complete snapshot of fisheries’ performance at a glance.
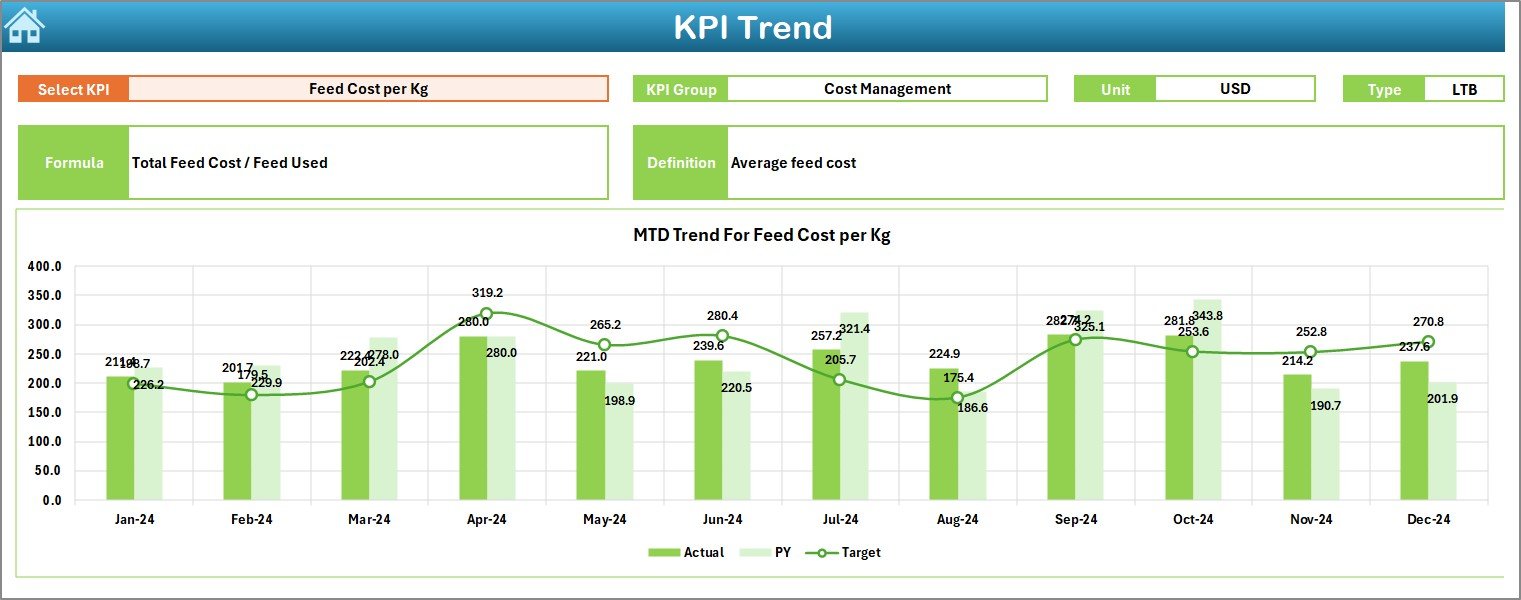
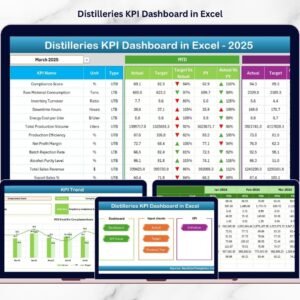
📈 3️⃣ KPI Trend Sheet – Visual Performance Analysis
Drill down into each KPI to understand trends and variations.
-
Dropdown (Cell C3) to select KPI name.
-
Displays KPI details (Group, Unit, Formula, Definition, Type).
-
Dual charts for MTD and YTD performance — Actual vs Target vs Previous Year.
🎯 Helps identify improvement areas, seasonality, and sustainability trends.
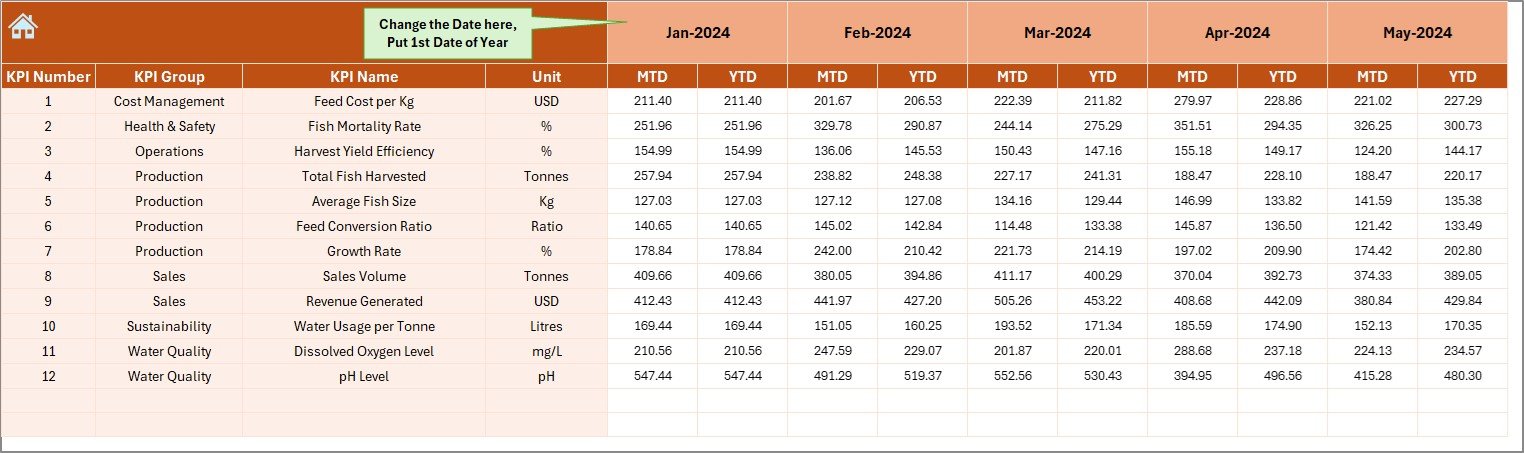
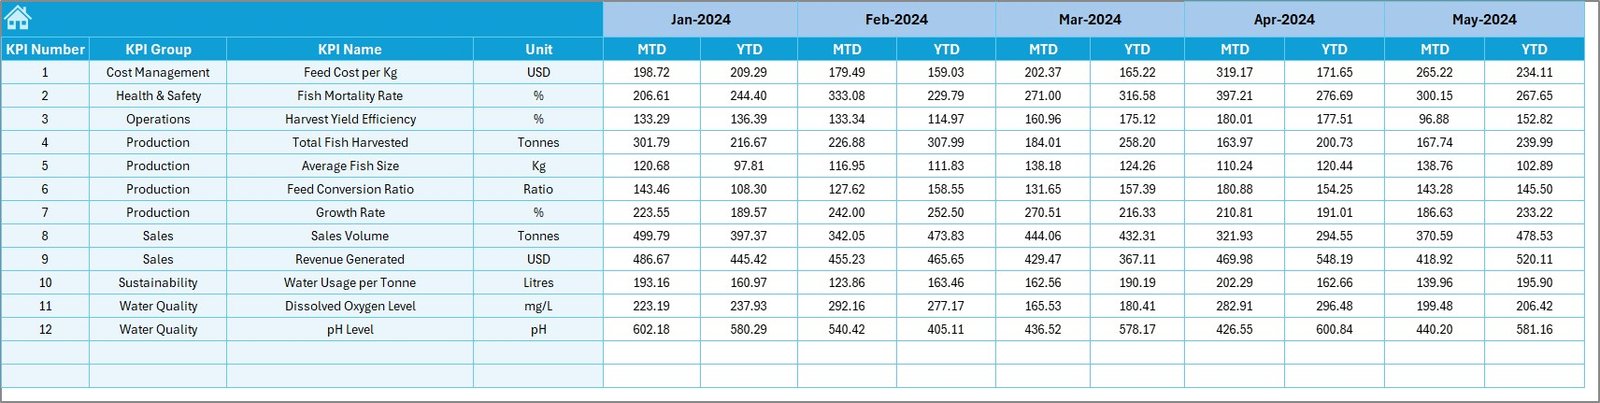
📋 4️⃣ Actual Numbers Input Sheet – Operational Data Source
Input monthly KPI data here.
-
Columns for MTD and YTD values.
-
Reference month set in cell E1 for auto-alignment.
-
Supports structured data entry for accurate reporting.
🎯 5️⃣ Target Sheet – Performance Benchmarking
Define performance targets for each KPI.
-
Mirror layout of the Actual sheet for easy comparison.
-
Enables realistic, measurable goal setting for the year.
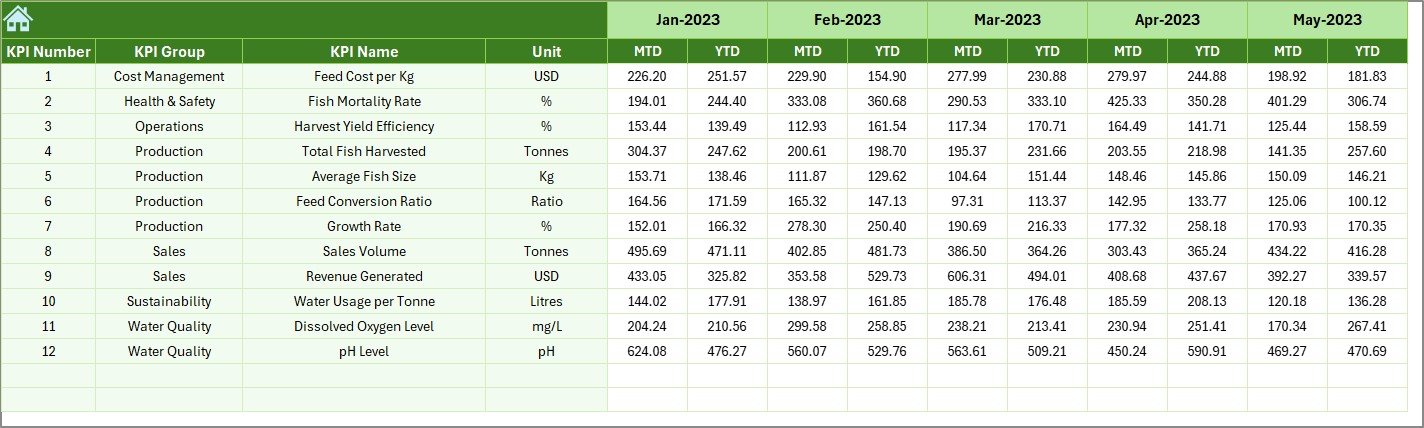
📅 6️⃣ Previous Year Numbers Sheet – Historical Benchmarking
Maintain last year’s KPI results for comparison.
-
Enables Current vs Previous Year performance tracking.
-
Highlights long-term progress and areas for improvement.
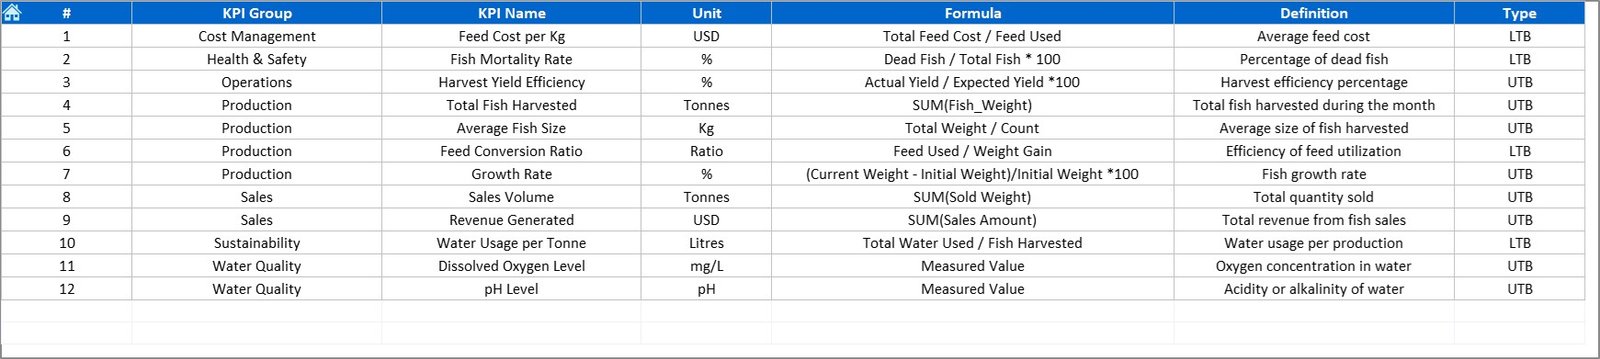
📘 7️⃣ KPI Definition Sheet – KPI Reference Library
Your built-in data dictionary.
Includes:
-
KPI Name, Group, Unit, Formula, Definition, and Type (UTB/LTB).
-
Promotes consistency and standardization across teams.
🌟 Advantages of Using the Fisheries KPI Dashboard in Excel
✅ Centralized Data Hub – Manage all metrics in one file.
✅ Instant Insights – Automatic charts and comparisons.
✅ Visual Clarity – Color-coded arrows and performance charts.
✅ Yearly Comparison – Track growth vs past performance.
✅ Full Customization – Add or modify KPIs anytime.
✅ Beginner-Friendly – No complex formulas or macros needed.
✅ Real-Time Monitoring – Data updates reflected instantly.
✅ Cost-Effective – All the power of analytics, powered by Excel.
💡 Best Practices for Effective Use
📌 Maintain consistent units (e.g., tons, %, liters).
📌 Update data monthly for accurate MTD/YTD tracking.
📌 Review KPI definitions quarterly to ensure alignment.
📌 Protect formula cells to prevent accidental edits.
📌 Export dashboard visuals for reports and presentations.
📌 Automate data imports using Power Query if needed.
🧠 Who Can Benefit from This Dashboard
🐠 Fisheries Managers – Oversee catch, operations, and revenue trends.
🌊 Aquaculture Farms – Track growth efficiency and feed conversion.
⚓ Fleet Supervisors – Monitor vessel productivity and fuel consumption.
📊 Sustainability Officers – Evaluate mortality rates and resource efficiency.
🏛️ Government Departments – Analyze industry-wide data for policy reports.


Reviews
There are no reviews yet.