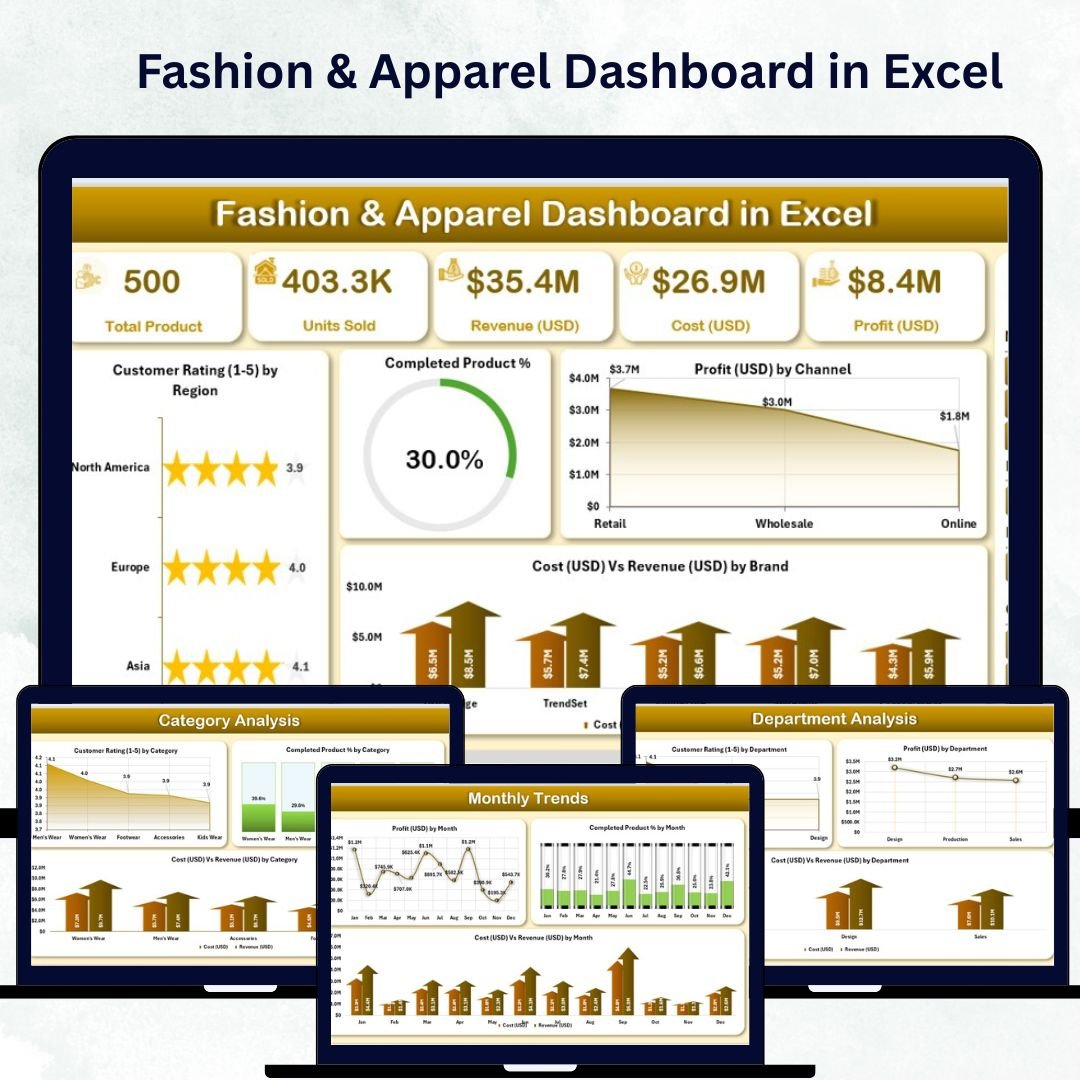
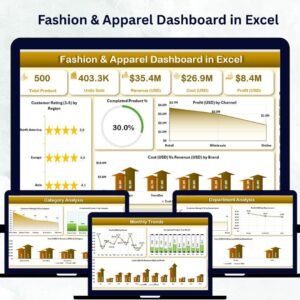
In the fast-moving world of fashion, staying ahead of trends while maintaining profitability is a constant challenge. The Fashion & Apparel Dashboard in Excel brings clarity, speed, and structure to your business decisions. Designed for retailers, designers, and apparel manufacturers, this ready-to-use Excel dashboard consolidates sales, profit, cost, and customer rating data into one visual, interactive file — making performance tracking effortless.
Whether you manage a boutique clothing line or a global brand portfolio, this dashboard delivers an instant overview of your company’s performance across departments, brands, categories, and regions. No coding, no complicated setup — just plug in your data and watch Excel transform it into actionable insights.
⚙️ Key Features of the Fashion & Apparel Dashboard in Excel
The template comes with five analytical pages and two support sheets, each designed to simplify analysis and accelerate decision-making.
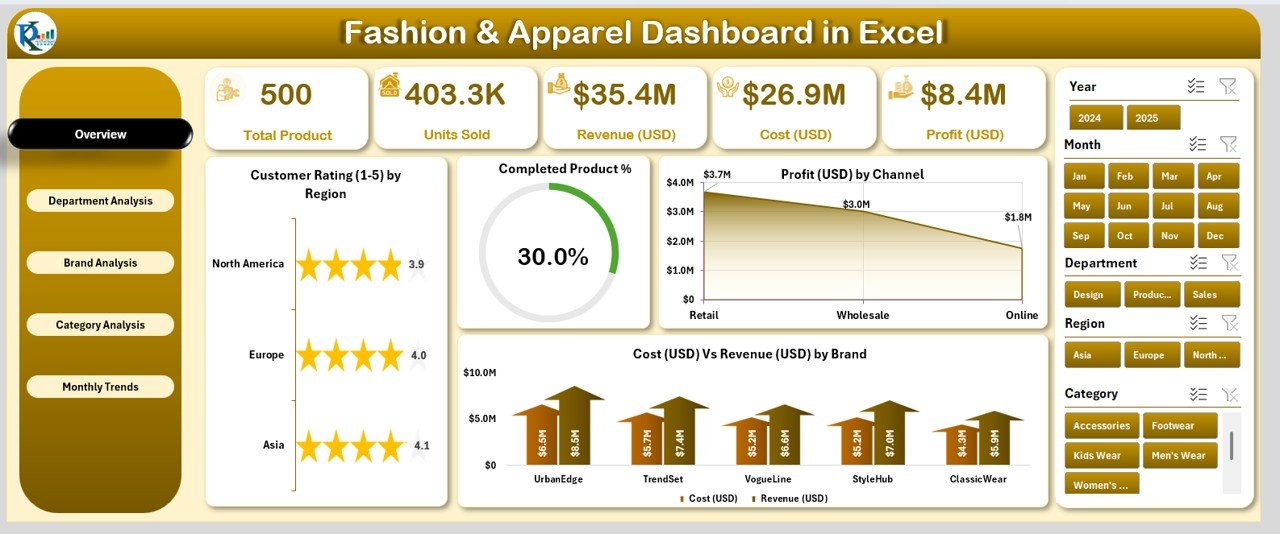
🪞 1️⃣ Overview Page – Your Command Center
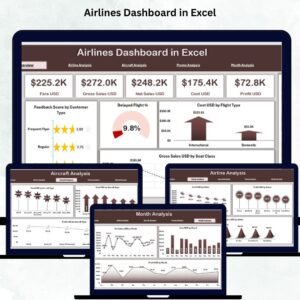
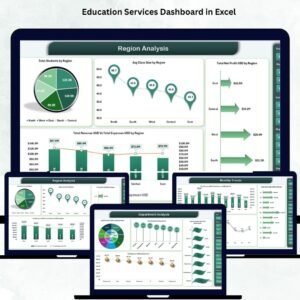
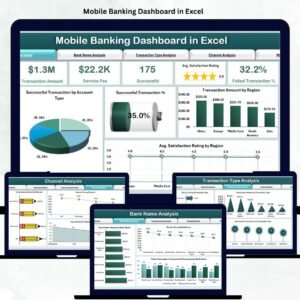
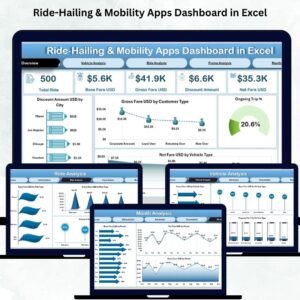
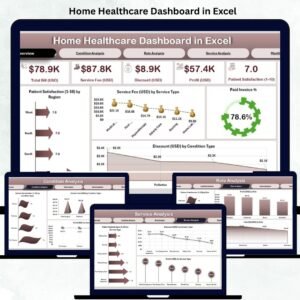
The Overview Page provides a top-level summary of key performance indicators across your entire fashion business.
Highlights:
-
Page Navigator: Switch seamlessly between pages using the left-side navigation panel.
-
5 KPI Cards: Track Total Revenue, Total Cost, Profit Margin, Completed Product %, and Average Customer Rating.
-
Charts Included:
-
Customer Rating (1–5) by Region
-
Completed Product %
-
Profit (USD) by Channel
-
Cost vs Revenue (USD) by Brand
-
This page offers an executive snapshot of overall brand performance, ensuring quick and confident decision-making.
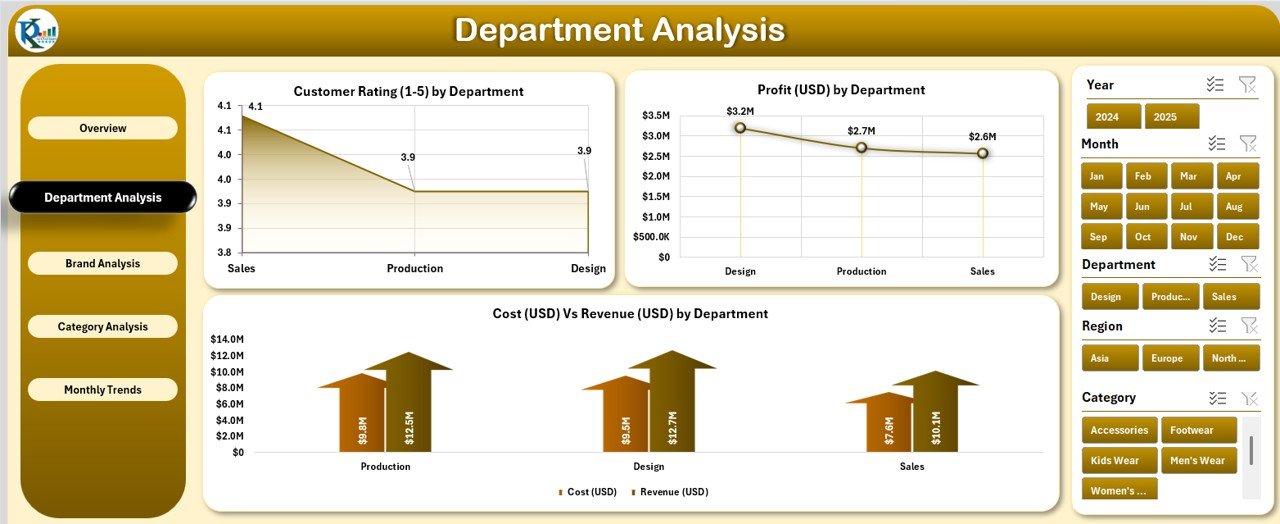
🧥 2️⃣ Department Analysis – Measure Team Performance
Each department — Men’s Wear, Women’s Wear, Footwear, or Accessories — can make or break your business.
Key Visuals:
-
Customer Rating (1–5) by Department
-
Profit (USD) by Department
-
Cost vs Revenue (USD) by Department
This analysis helps department heads focus on profitable product lines and improve efficiency where needed.
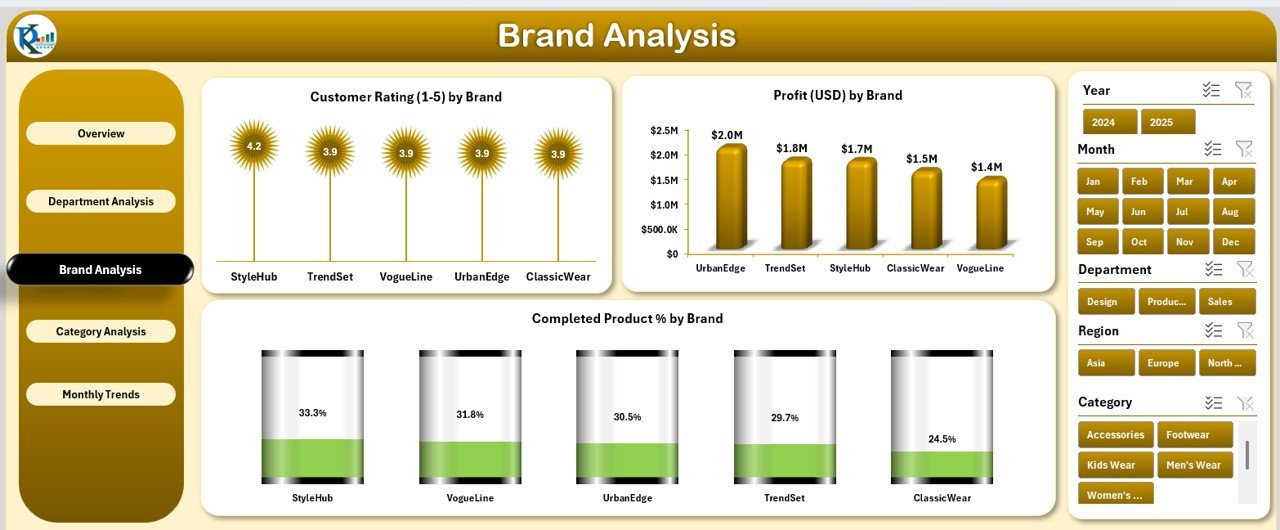
👠 3️⃣ Brand Analysis – Compare Brand Strengths
For multi-brand retailers, the Brand Analysis Page helps you pinpoint your strongest performers.
Charts Displayed:
-
Customer Rating (1–5) by Brand
-
Profit (USD) by Brand
-
Completed Product % by Brand
Quickly see which brands deliver the highest profitability, best quality, and top customer satisfaction.
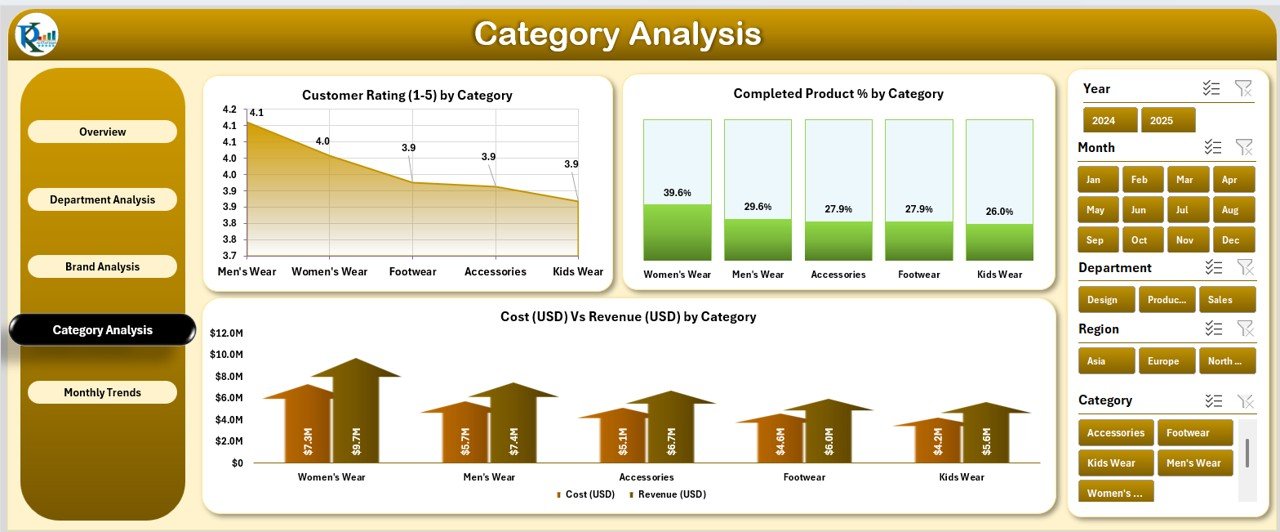
🧢 4️⃣ Category Analysis – Understand Product Trends
Fashion trends shift constantly, and this page helps you stay on top of them.
Charts Featured:
-
Customer Rating (1–5) by Category
-
Completed Product % by Category
-
Cost vs Revenue (USD) by Category
These visuals guide product planning, helping you invest in the right categories for maximum returns.
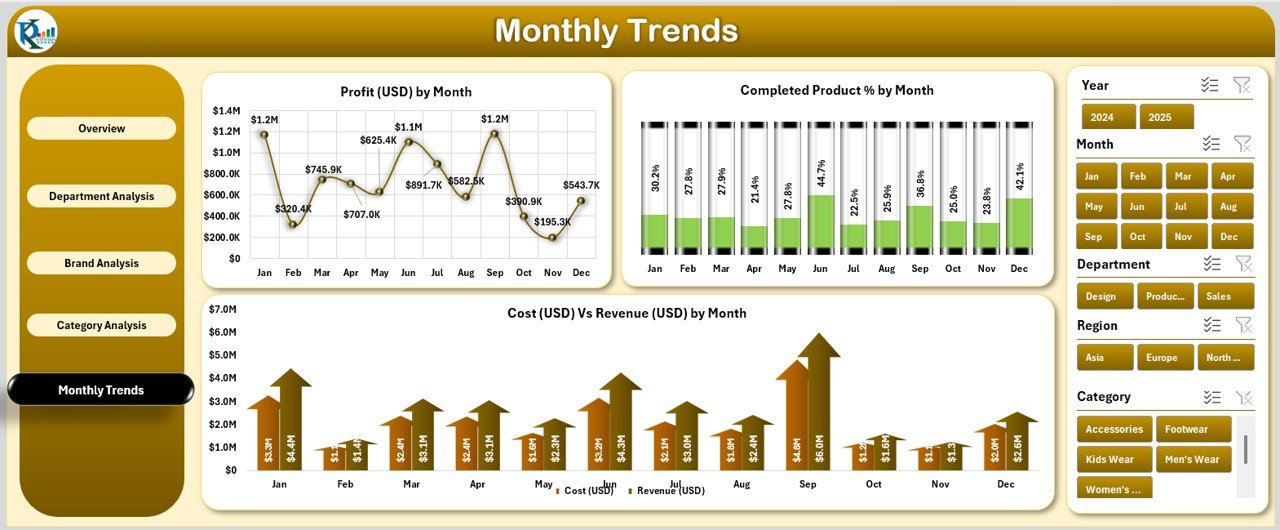
📅 5️⃣ Monthly Trends – Track Performance Over Time
Fashion is seasonal — this page highlights when your sales peak and profits surge.
Charts Included:
-
Profit (USD) by Month
-
Completed Product % by Month
-
Cost vs Revenue (USD) by Month
Plan production, promotions, and inventory around these insights to maximize performance throughout the year.
🧾 Support Sheets – The Dashboard Engine
-
Data Sheet: Enter raw data for brand, category, region, department, cost, revenue, and ratings.
-
Support Sheet: Houses slicer lists, reference tables, and formulas for seamless automation.
Every visual updates instantly when you refresh the data — making reporting fast and error-free.
🧭 What’s Inside the Fashion & Apparel Dashboard
✨ Interactive Excel File: Includes five dashboard pages and support sheets.
💡 Pre-Defined KPIs: Revenue, Cost, Profit Margin, Completed Product %, and Ratings.
🎨 Customizable Layout: Adjust visuals, add charts, or apply your brand colors.
📈 Smart Filters: Analyze by brand, category, department, month, or region.
🔄 Automatic Updates: Refresh once to update all visuals instantly.
Everything you need for complete business visibility — no extra tools required.
🪄 How to Use the Fashion & Apparel Dashboard
1️⃣ Open the File – Start from the Overview Page.
2️⃣ Input Data – Fill the Data Sheet with your latest performance numbers.
3️⃣ Refresh Dashboard – Watch visuals and KPIs update automatically.
4️⃣ Navigate Easily – Use the left-side navigator to explore departments, brands, and categories.
5️⃣ Filter with Slicers – View specific months, regions, or products.
Within minutes, you’ll have a complete, interactive performance report ready for review.
👥 Who Can Benefit from This Dashboard
👗 Retailers: Track brand and store-level performance.
🧵 Manufacturers: Monitor production efficiency and profitability.
👚 Designers: Understand customer preferences through ratings.
💼 Business Owners: View total performance from one place.
📊 Analysts: Turn raw data into clear, actionable visuals.
🌟 Advantages of the Fashion & Apparel Dashboard in Excel
✅ Real-Time Insights: Analyze sales, cost, and profitability instantly.
✅ Centralized Data: No need to juggle multiple spreadsheets.
✅ Customizable Design: Modify visuals and metrics as your business grows.
✅ Time-Saving: Automates manual reporting tasks.
✅ Affordable & Accessible: No subscription or advanced software required.
✅ Beautifully Visual: Professional charts and layouts make reporting engaging.
💡 Best Practices
✔️ Keep your data clean and consistent.
✔️ Update inputs weekly or monthly.
✔️ Focus on essential KPIs for clarity.
✔️ Backup files regularly.
✔️ Customize visuals to match your brand.
Follow these practices to ensure long-term, data-driven success in your fashion business.
🔗 Click here to read the Detailed Blog Post
🎥 Visit our YouTube channel for tutorials
🔗 YouTube.com/@PKAnExcelExpert


Reviews
There are no reviews yet.