Events have become one of the most powerful growth engines for modern businesses. Companies invest significant budgets in conferences, webinars, exhibitions, product launches, and marketing campaigns to generate leads and strengthen brand awareness. However, many organizations still struggle to answer one critical question — Are our events actually delivering ROI?
Without structured measurement, event success often depends on assumptions instead of real data. Teams rely on scattered reports, manual calculations, and inconsistent metrics, which leads to unclear performance insights and inefficient budget decisions.
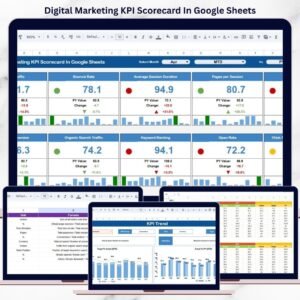
The Event ROI KPI Dashboard in Google Sheets solves this problem with a smart, data-driven approach.
This ready-to-use dashboard helps organizations track, measure, and analyze event performance using structured Key Performance Indicators (KPIs). Instead of managing multiple spreadsheets, users can monitor all event metrics inside a single interactive Google Sheets environment.
Because the dashboard is cloud-based, teams collaborate in real time while maintaining a centralized source of truth. Marketing managers, event planners, and executives gain instant visibility into performance trends, helping them optimize strategies and maximize event returns.
Whether you manage corporate events, marketing campaigns, virtual webinars, or trade shows, this dashboard transforms raw event data into meaningful insights that support faster and smarter decision-making.
🚀 Key Features of Event ROI KPI Dashboard in Google Sheets
✅ Interactive KPI dashboard with automated calculations
✅ MTD and YTD performance tracking for events
✅ Target vs Actual comparison with achievement percentages
✅ Previous year performance benchmarking
✅ Dynamic month selection with automatic updates
✅ Conditional formatting indicators for instant performance status
✅ KPI documentation with formulas and definitions included
✅ Real-time collaboration through Google Sheets cloud access
These features allow teams to evaluate both short-term event success and long-term marketing effectiveness effortlessly.
📦 What’s Inside the Event ROI KPI Dashboard in Google Sheets
This product includes six professionally structured worksheets designed for complete event performance management:
-
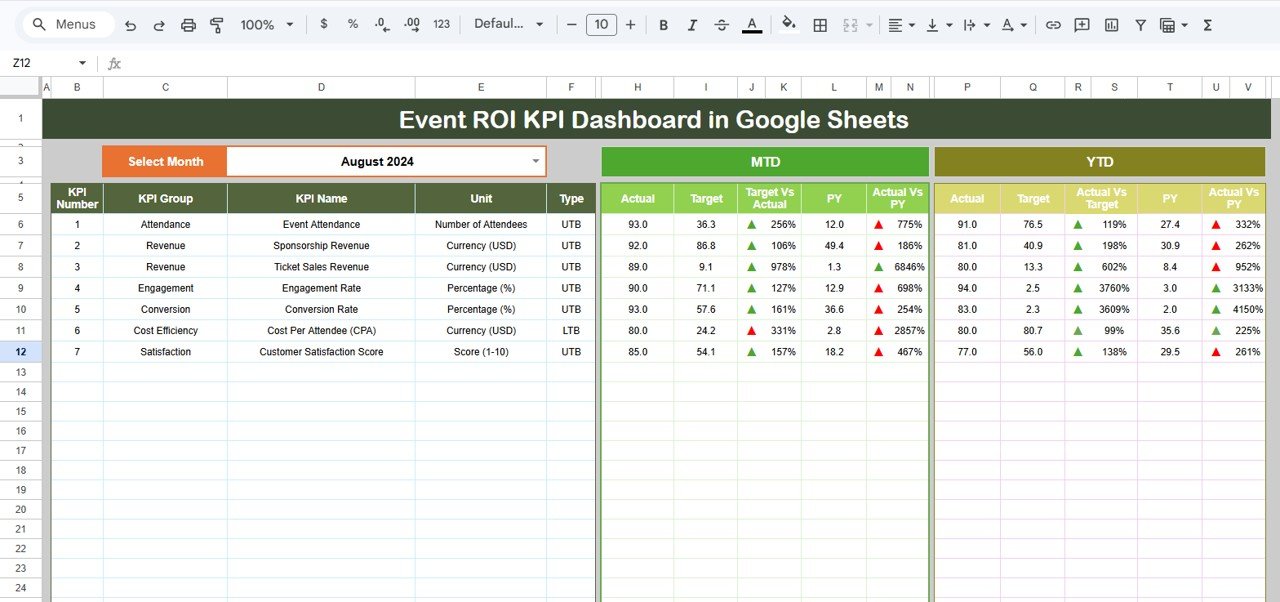
Dashboard Sheet – Central KPI overview with dynamic month selection
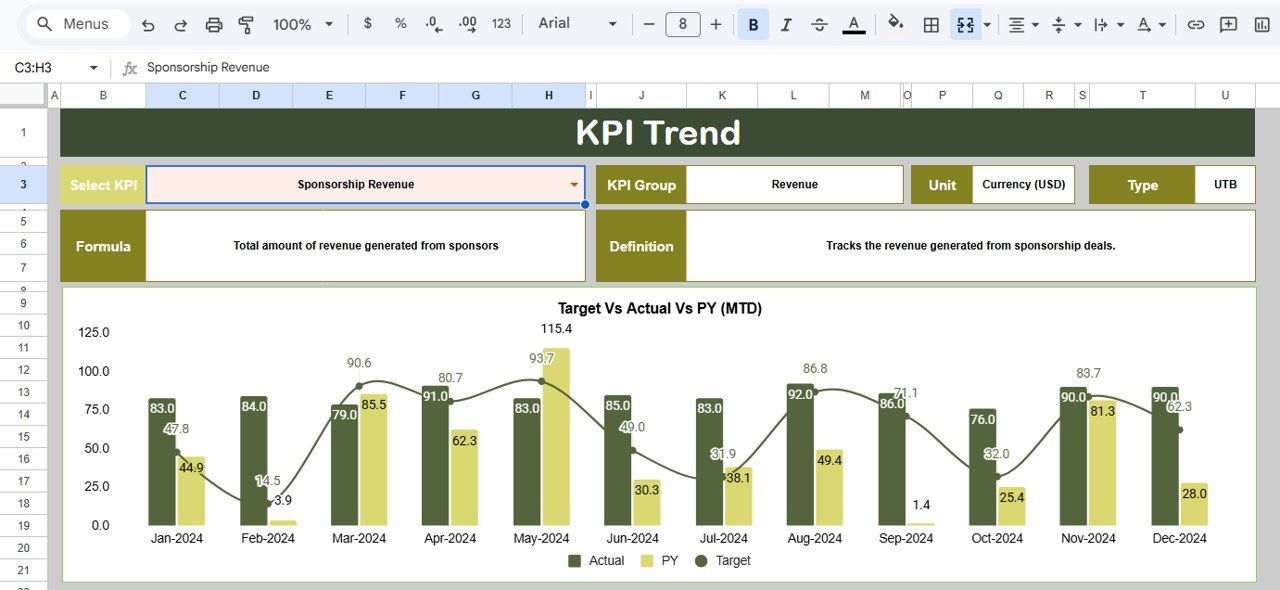
-
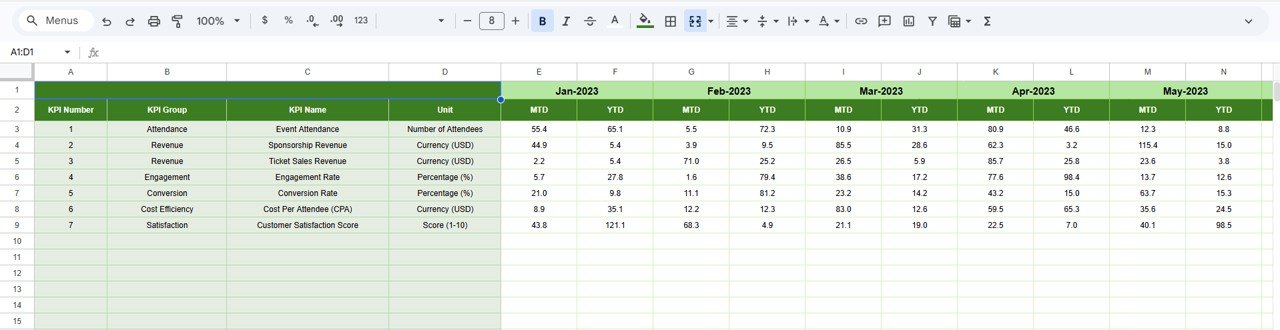
KPI Trend Sheet – Detailed KPI trend and performance analysis
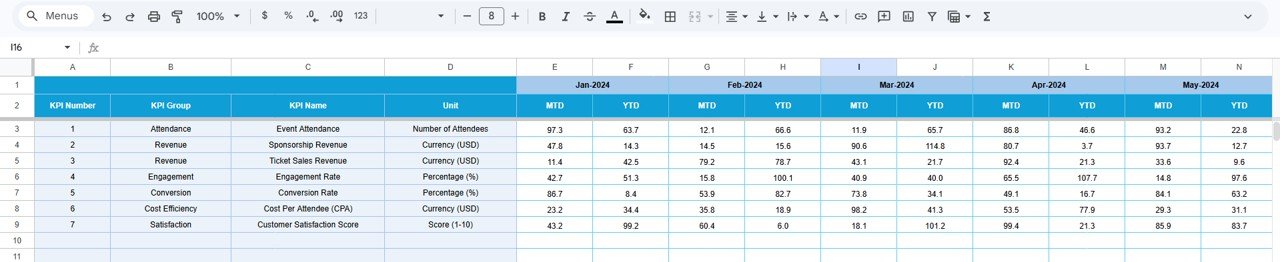
-
Actual Number Sheet – Organized area for entering event performance data
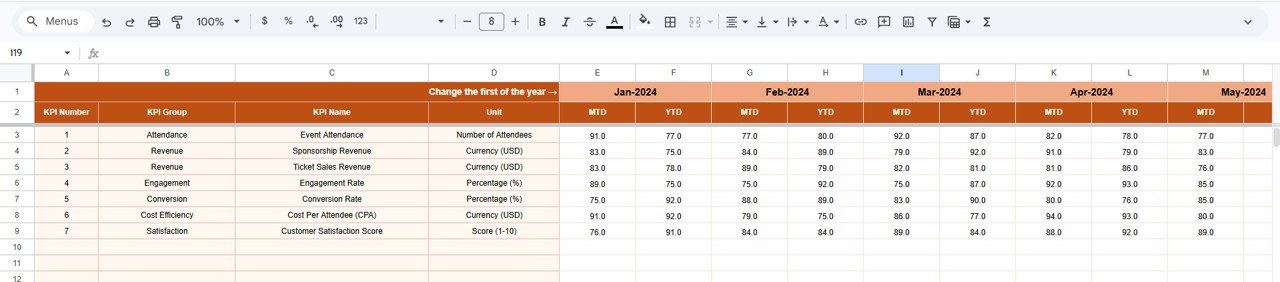
-
Target Sheet – KPI goal-setting and performance planning
-
Previous Year Sheet – Historical benchmarking and comparison
-
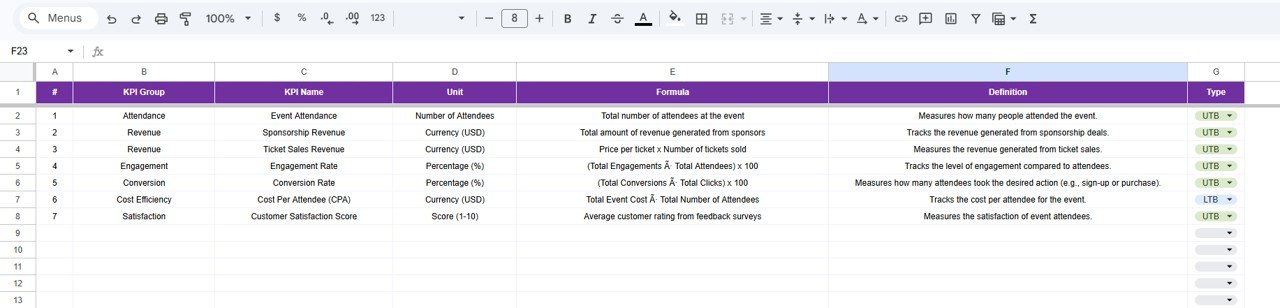
KPI Definition Sheet – KPI formulas, units, and classification documentation
Together, these sheets create a powerful event analytics system that simplifies reporting and improves clarity.
⚙️ How to Use the Event ROI KPI Dashboard in Google Sheets
The dashboard is designed for simplicity and quick implementation:
1️⃣ Define KPIs in the KPI Definition sheet
2️⃣ Enter performance targets in the Target sheet
3️⃣ Add actual event performance data
4️⃣ Input previous year data for benchmarking
5️⃣ Select a reporting month from the dropdown menu
Immediately, charts, comparisons, and KPI indicators update automatically — eliminating manual reporting effort.
🎯 Who Can Benefit from This Event ROI KPI Dashboard
This dashboard is ideal for professionals responsible for event planning and performance evaluation:
-
Marketing Managers tracking campaign ROI
-
Event Managers analyzing event outcomes
-
Business Owners evaluating investment returns
-
Sales Teams measuring lead generation performance
-
Marketing Analysts monitoring trends
-
Executives reviewing strategic performance
Because it connects data, analysis, and reporting in one place, every stakeholder gains actionable insights.
The Event ROI KPI Dashboard in Google Sheets empowers organizations to move beyond guesswork and adopt data-driven event strategies. Instead of focusing only on attendance numbers, businesses can evaluate financial impact, engagement effectiveness, and long-term performance trends.
By improving visibility, automating calculations, and enabling collaboration, this dashboard helps teams optimize marketing budgets, improve future events, and maximize ROI consistently.
If you want to measure event success with clarity and confidence, this dashboard provides a simple yet powerful solution built entirely in Google Sheets.
### Click here to read
Watch the step-by-step video tutorial: