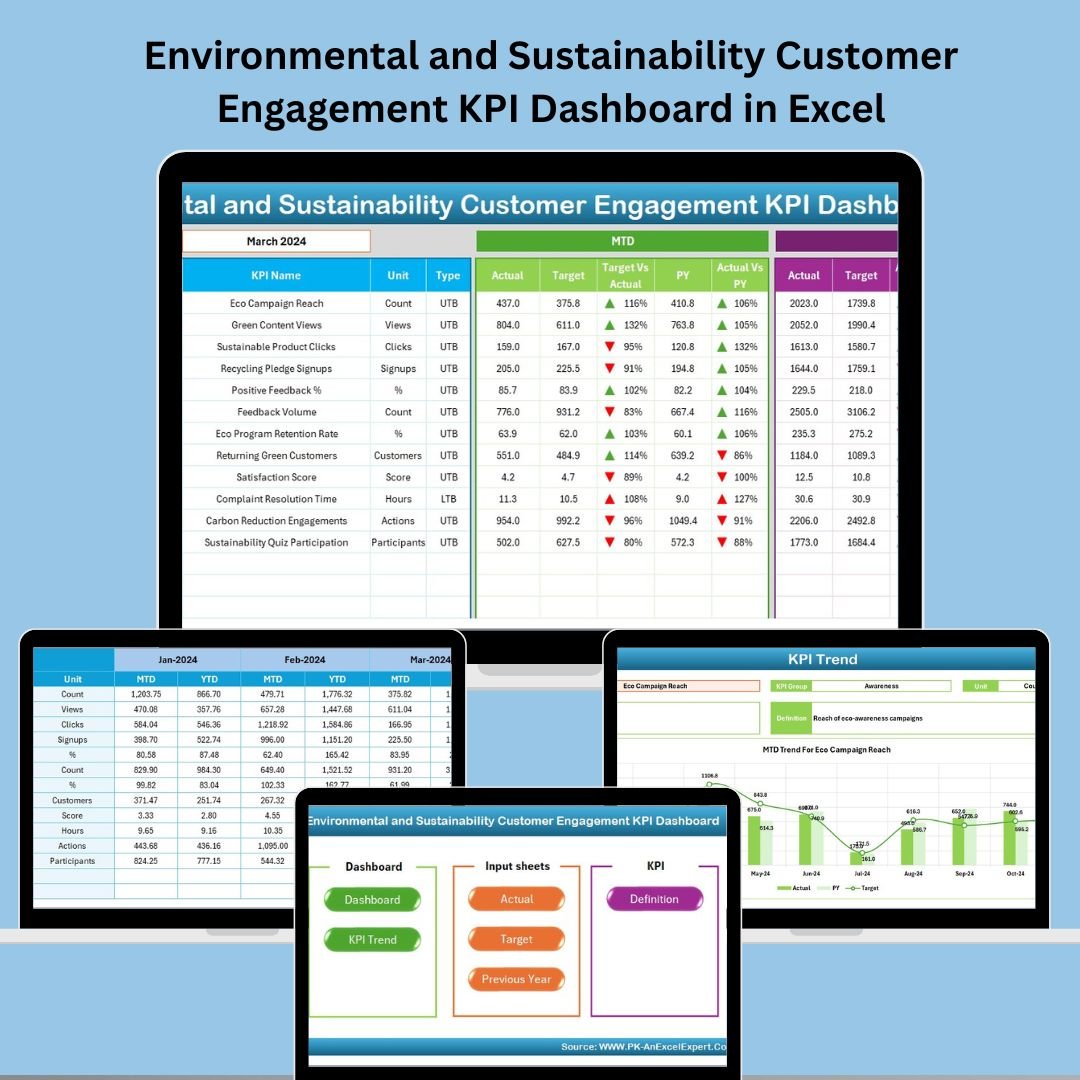
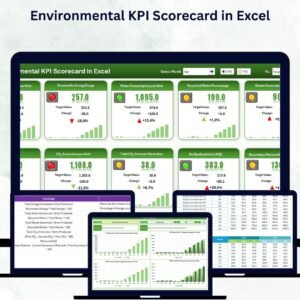
In a world where sustainability is no longer optional but essential, customer engagement in green initiatives defines how brands are perceived. Businesses that proactively measure and improve their environmental efforts gain trust, loyalty, and competitive edge. Our Environmental and Sustainability Customer Engagement KPI Dashboard in Excel is designed to help you do exactly that—track, measure, and optimize your sustainability engagement initiatives with precision and clarity.
This ready-to-use, Excel-based dashboard template turns complex sustainability data into clear, actionable insights. Whether you’re managing recycling programs, evaluating eco-feedback, or tracking awareness campaigns, this dashboard helps you stay aligned with your green goals—all from a tool you’re already comfortable with: Microsoft Excel.
✨ Key Features of Environmental and Sustainability Engagement Dashboard
📌 Pre-Built Excel Dashboard
No need to build from scratch! It includes pre-linked formulas, structured sheets, and drop-downs for seamless usage.
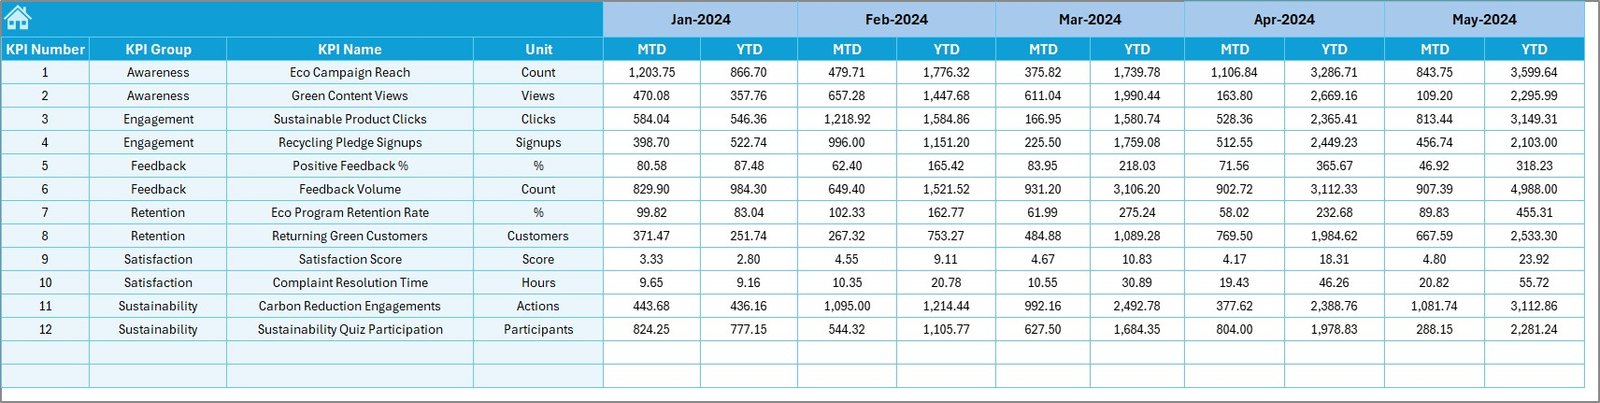
📅 Monthly & Yearly Tracking
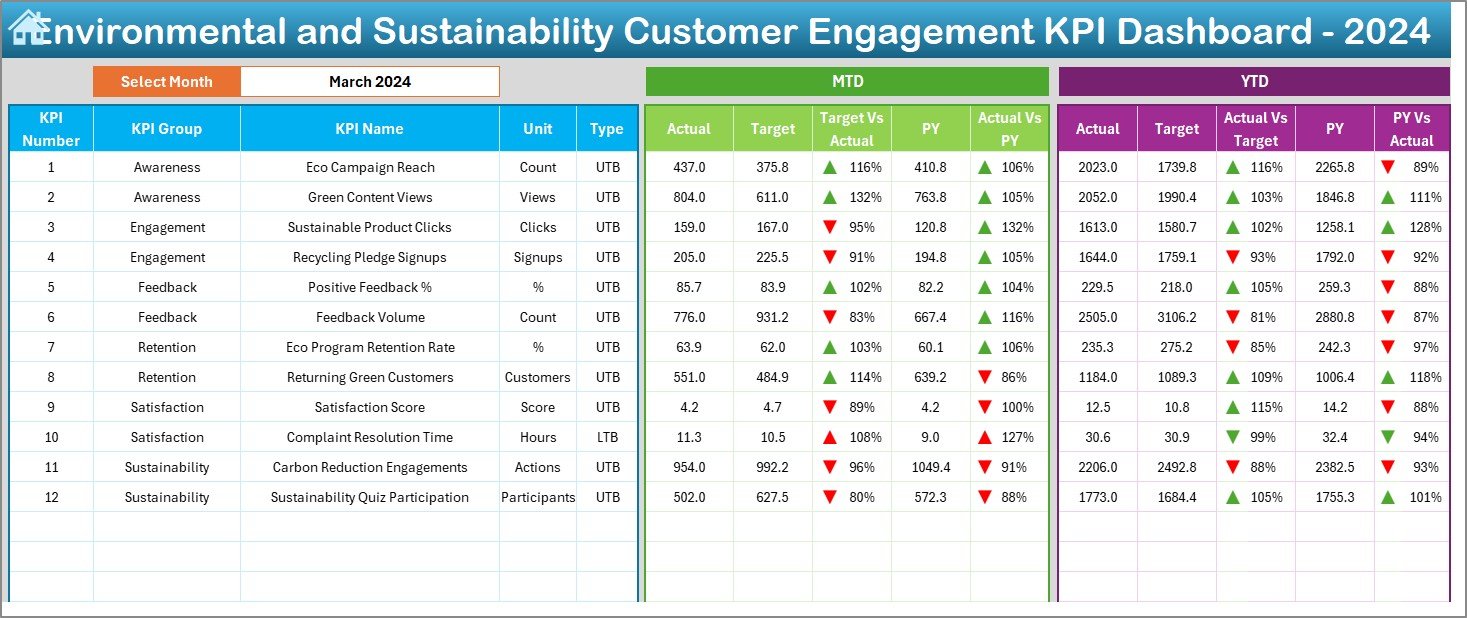
Monitor Month-to-Date (MTD) and Year-to-Date (YTD) metrics with real-time comparison against Targets and Previous Year stats.
📊 Dynamic Visual Indicators
Use visual arrows and conditional formatting to easily spot performance improvements or declines.
📈 Trend Analysis
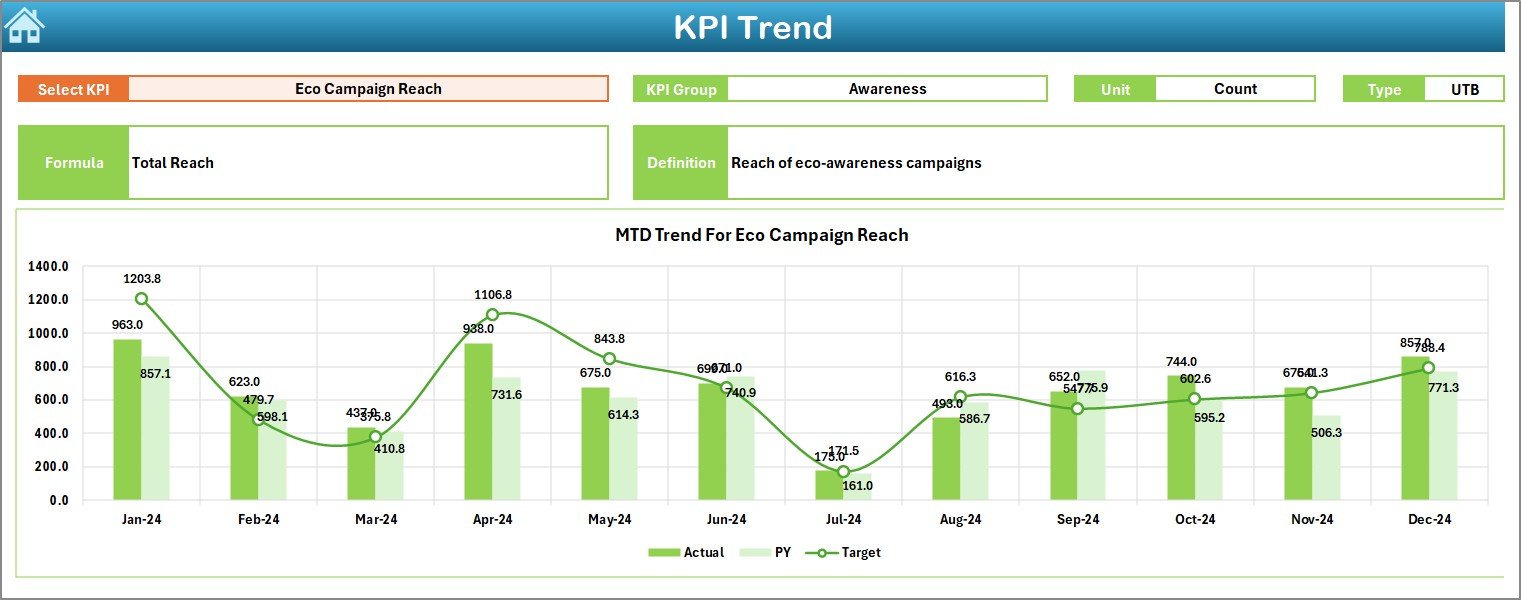
The KPI Trend tab allows deep insights into sustainability performance over time, helping you act proactively.
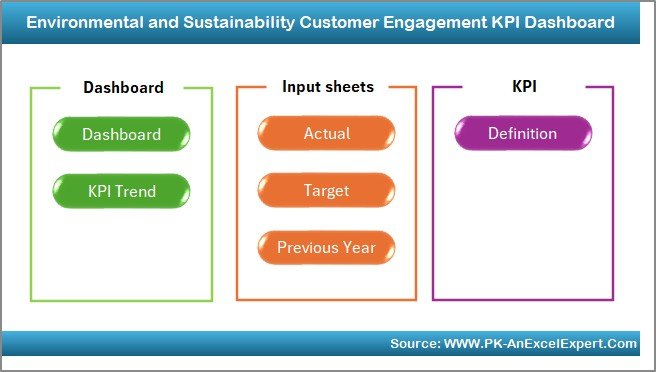
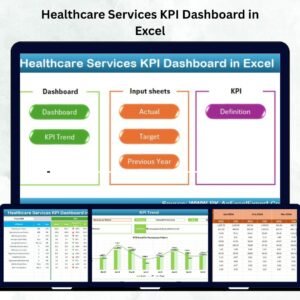
📦 What’s Inside the Dashboard?
This dashboard template includes 7 well-organized worksheet tabs:
-
🏠 Home Sheet: Your navigation hub with clickable buttons for ease.
-
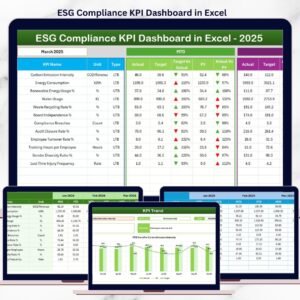
📊 Dashboard: A visual center to monitor MTD/YTD Actuals, Targets, and Previous Year performance with up/down arrows.
-
📉 KPI Trend: Analyze each KPI’s trajectory across months.
-
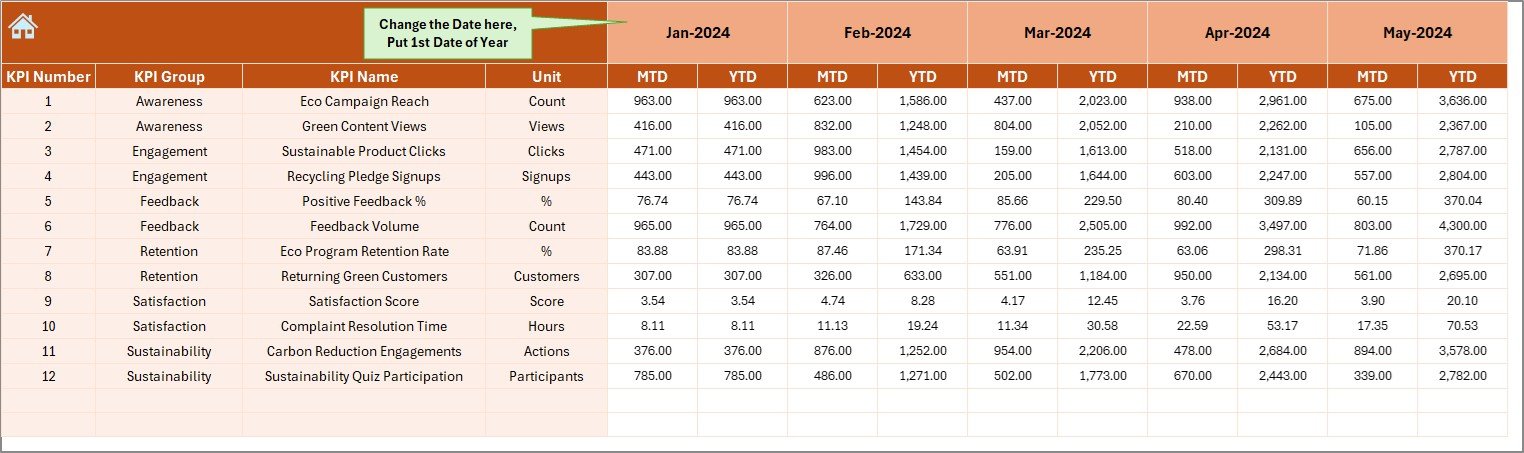
📝 Actual Numbers Input: Easily input monthly performance data.
-
🎯 Target: Define monthly targets for each KPI.
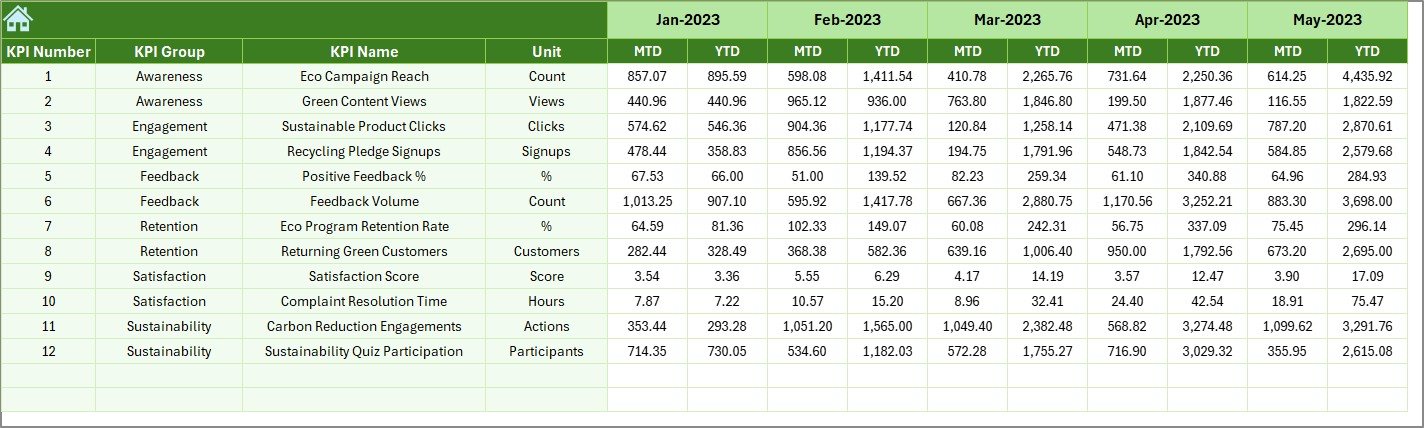
-
📅 Previous Year Numbers: Add last year’s values for comparison.
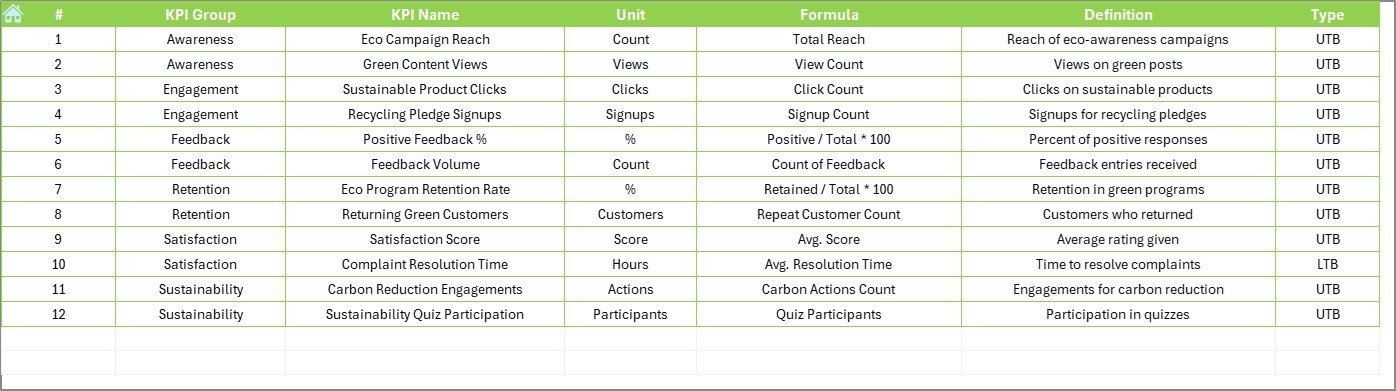
-
📘 KPI Definition: View all KPI formulas, units, and definitions at a glance.
🛠️ How to Use the Product
-
Download and Open the Excel File 📥
-
Navigate via Home Sheet: Use buttons to jump between sheets.
-
Start with KPI Definitions: Review or update existing KPIs.
-
Input Actuals Monthly: Update performance in the ‘Actual Numbers Input’ tab.
-
Set Targets: Enter target values for each KPI in the ‘Target’ tab.
-
Monitor Progress: Instantly view updated results on the Dashboard.
-
Track Trends: Use the KPI Trend sheet for historical pattern analysis.
👥 Who Can Benefit from This Dashboard?
This Excel tool is ideal for:
-
🌱 Sustainability Managers seeking data-driven reporting
-
📢 Marketing Teams tracking campaign effectiveness
-
💼 CSR Professionals reporting to stakeholders
-
🧑🔬 Product Managers measuring green initiatives
-
📈 Business Analysts focused on ESG metrics
✅ Clickbait Benefits
-
💚 Build strong eco-brand trust
-
📊 Back sustainability claims with data
-
⏱ Save time with pre-built structures
-
💸 Avoid expensive BI tools—Excel does it all
-
🌐 Align business and sustainability goals with data
🔗 Click here to read the Detailed blog post
🔗 Visit our YouTube channel to learn step-by-step video tutorials


Reviews
There are no reviews yet.