Managing enterprise assets becomes complex when organizations grow across locations, departments, and business units. Without a structured system, teams struggle to track asset cost, usage, depreciation, warranty cycles, vendor performance, and operational status. The result? Unexpected expenses, poor decision-making, and financial losses.
The Enterprise Asset Monitoring Dashboard in Google Sheets eliminates these challenges by offering a ready-to-use, data-driven, and interactive asset management solution. It helps you monitor asset value, performance history, lifecycle stages, and cost insights — all inside a single Google Sheets dashboard.
This dashboard transforms your asset data into clear visuals, smart KPIs, and automated analytics. Whether you manage IT assets, machinery, office equipment, vehicles, or operational tools, this template gives you complete clarity, better forecasting, and stronger control over your asset ecosystem.
Key Features of the Enterprise Asset Monitoring Dashboard in Google Sheets
This dashboard is designed to give organizations total visibility and smarter decision-making capabilities.
✨ Complete Asset Insights – Track Total Assets, Active Assets, Net Book Value, Depreciation, and Total Cost instantly.
📊 Automated Visual Dashboards – Analyze assets through dynamic charts by location, asset type, status, vendor, and department.
📅 Monthly Trend Analysis – Understand how asset value and depreciation change over time.
🛠️ Warranty & Condition Tracking – Identify which assets are under warranty, active, inactive, damaged, or retired.
🏷️ Vendor Performance Analytics – Compare asset value, depreciation levels, and warranty status across multiple vendors.
☁️ Cloud-Based Collaboration – Real-time updates across departments using Google Sheets.
🔎 Search Functionality – Locate any asset record within seconds with the Search Tab.
💰 Cost-Free & Fully Customizable – Modify dashboards, add new KPIs, and scale without additional software costs.
These features make the dashboard a perfect asset monitoring system for organizations of all sizes.
What’s Inside the Enterprise Asset Monitoring Dashboard in Google Sheets
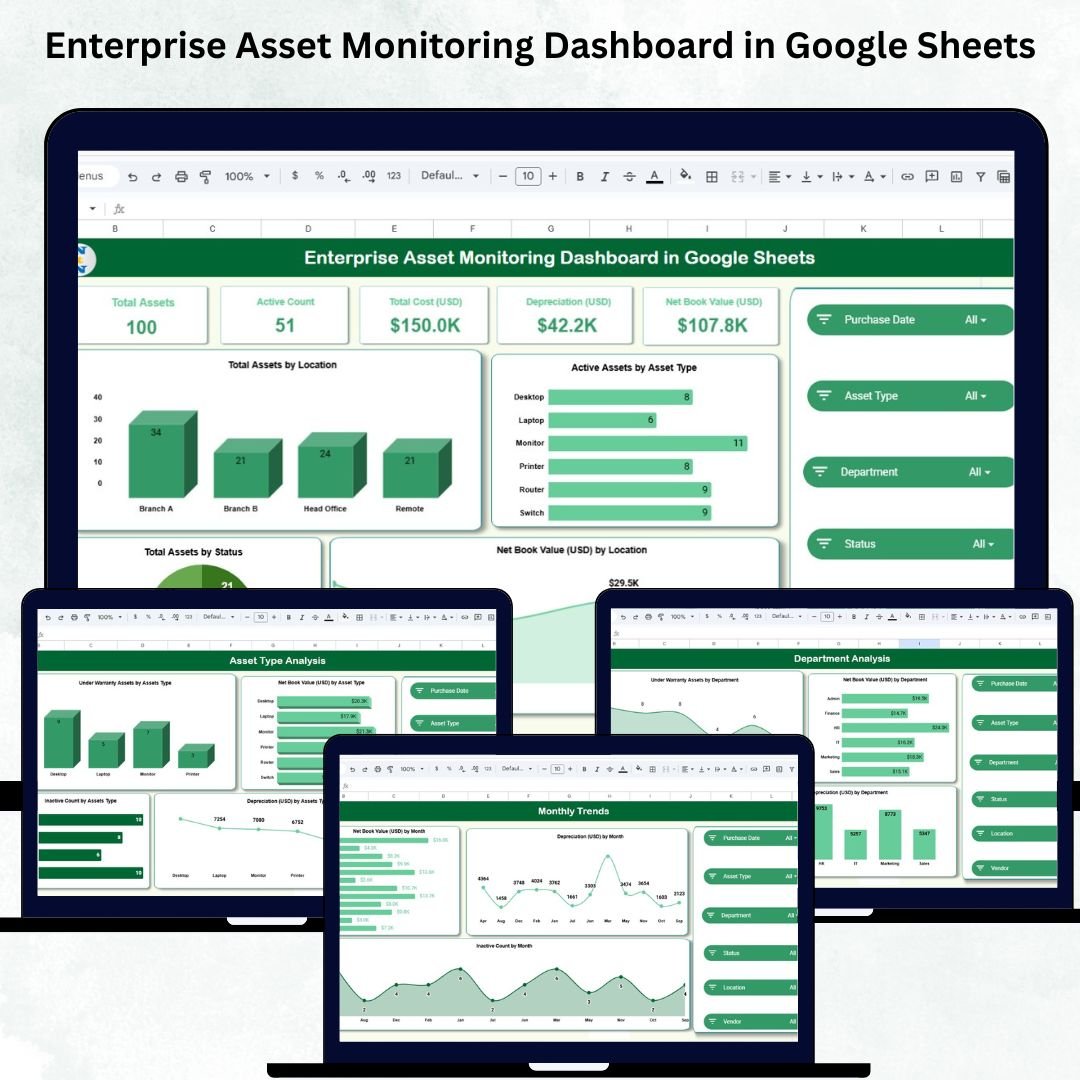
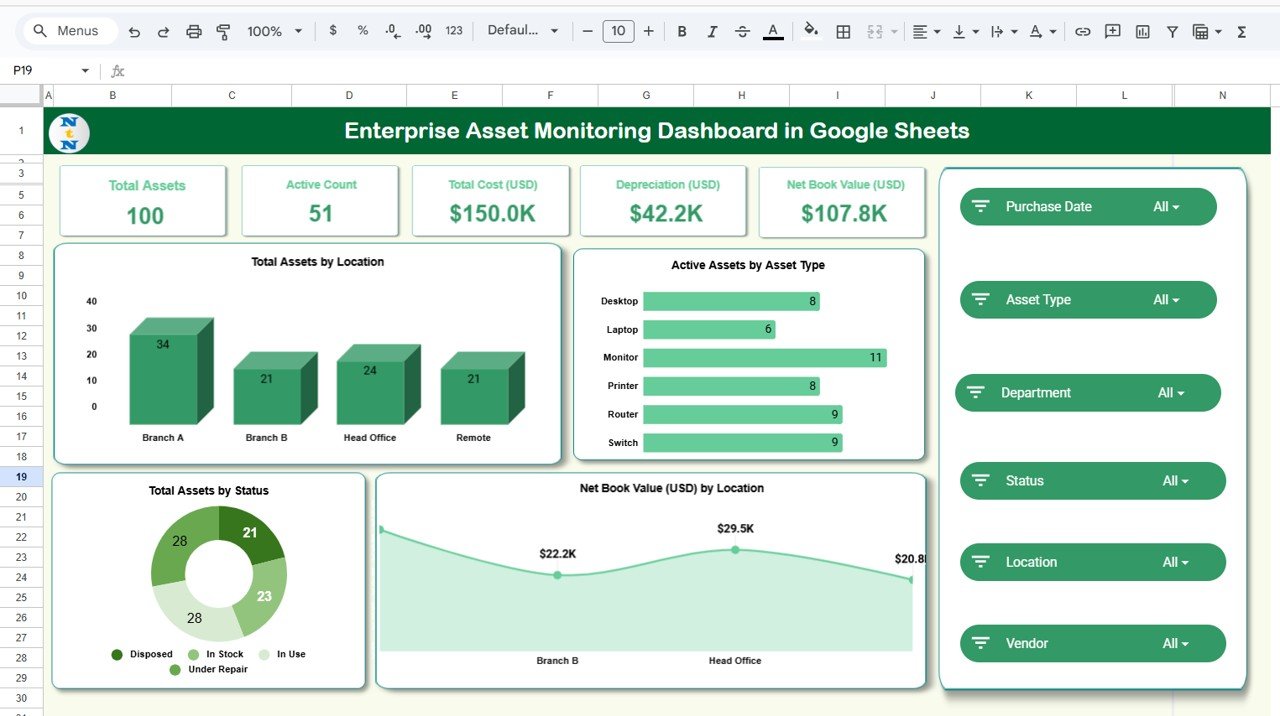
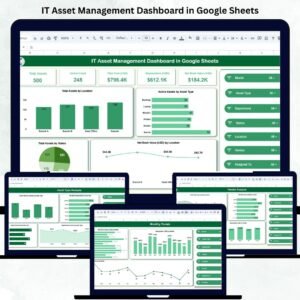
🟦 Overview Sheet Tab
A snapshot of your organization’s asset health with KPI cards including:
-
Total Assets
-
Active Count
-
Total Cost (USD)
-
Depreciation (USD)
-
Net Book Value (USD)
This tab also includes key charts such as:
-
Total Assets by Location
-
Active Assets by Asset Type
-
Net Book Value by Location
-
Total Assets by Status
These insights help leadership quickly assess asset performance and financial exposure.
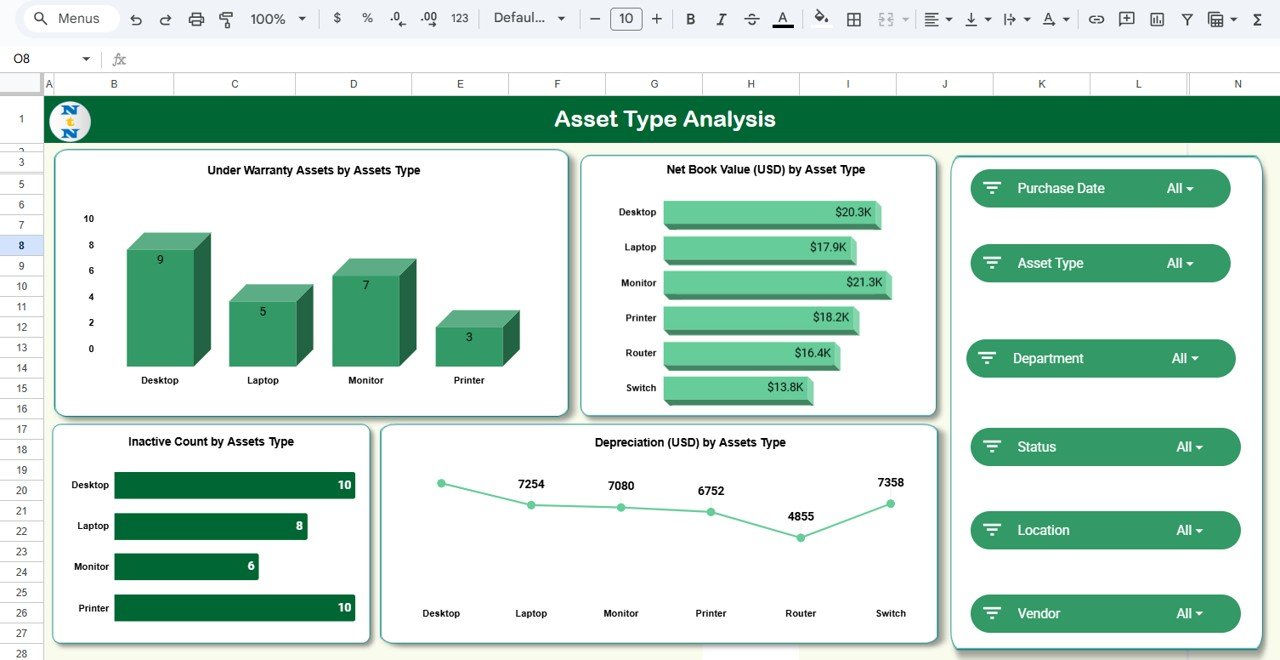
🟩 Asset Type Analysis Tab
Understand asset value and performance by category.
Charts include:
-
Under Warranty Assets by Asset Type
-
Net Book Value by Asset Type
-
Depreciation by Asset Type
-
Inactive Count by Asset Type
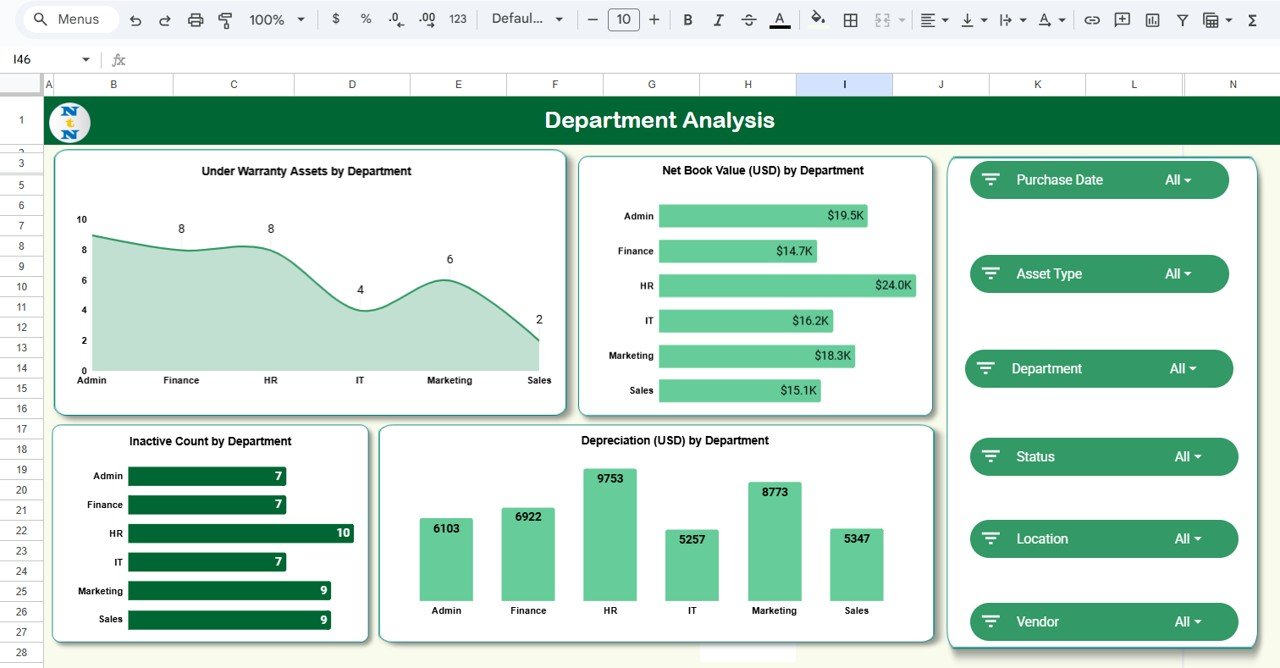
🟧 Department Analysis Tab
Optimize department-level asset allocation and responsibility.
Charts include:
-
Under Warranty Assets by Department
-
Net Book Value by Department
-
Depreciation by Department
-
Inactive Count by Department
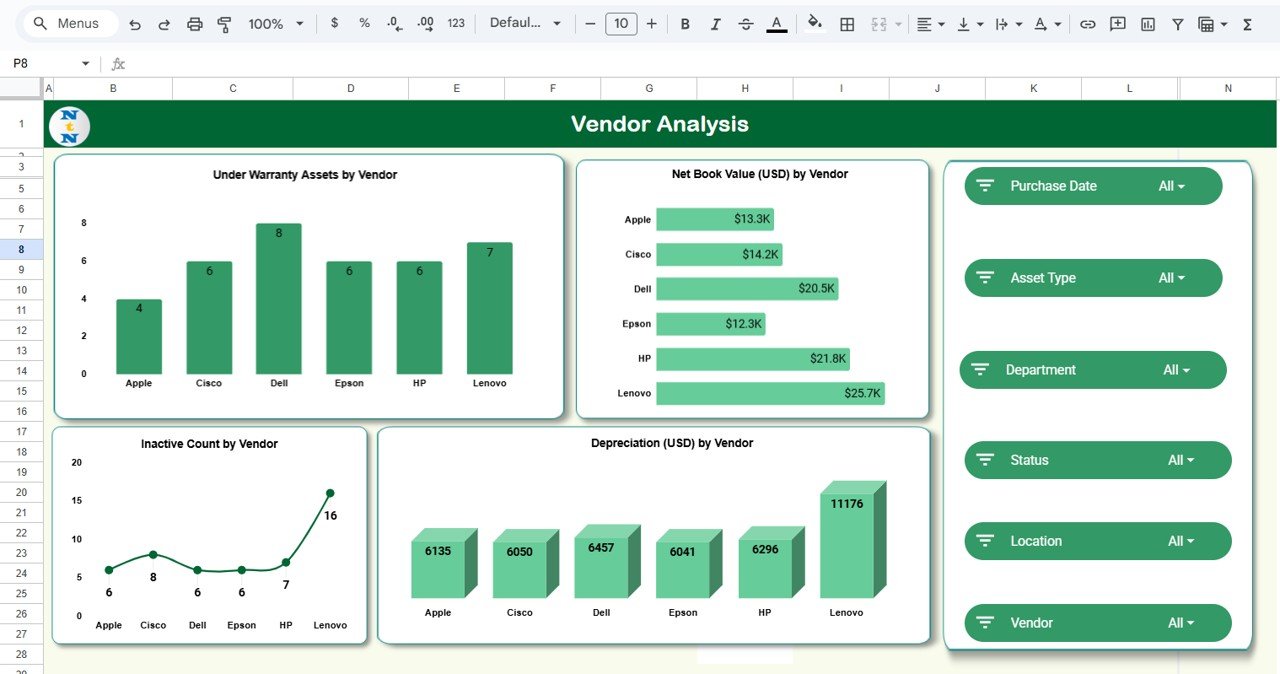
🟨 Vendor Analysis Tab
Evaluate vendors based on:
-
Warranty coverage
-
Depreciation
-
Net Book Value
-
Asset inactivity rate
This helps procurement teams choose better vendors in the future.
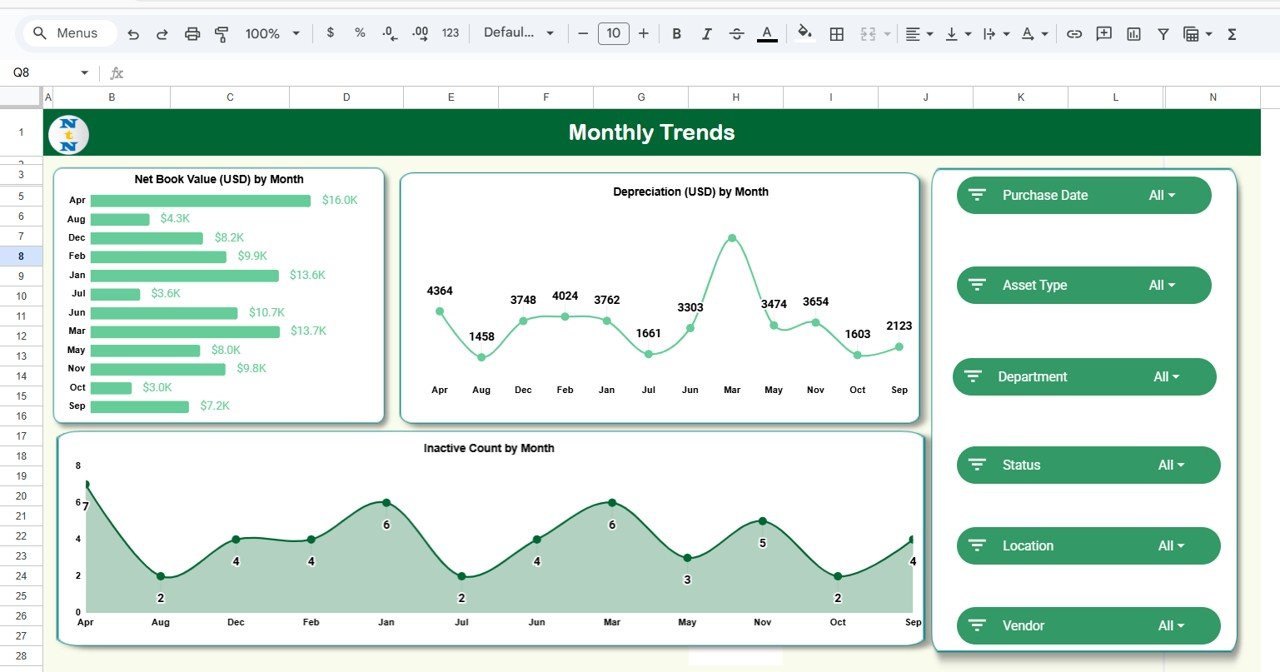
🟪 Monthly Trends Tab
Track long-term performance with charts for:
-
Net Book Value (USD) by Month
-
Depreciation (USD) by Month
-
Inactive Count by Month
Monthly trends help financial planners and operations teams track cost patterns and predict future needs.
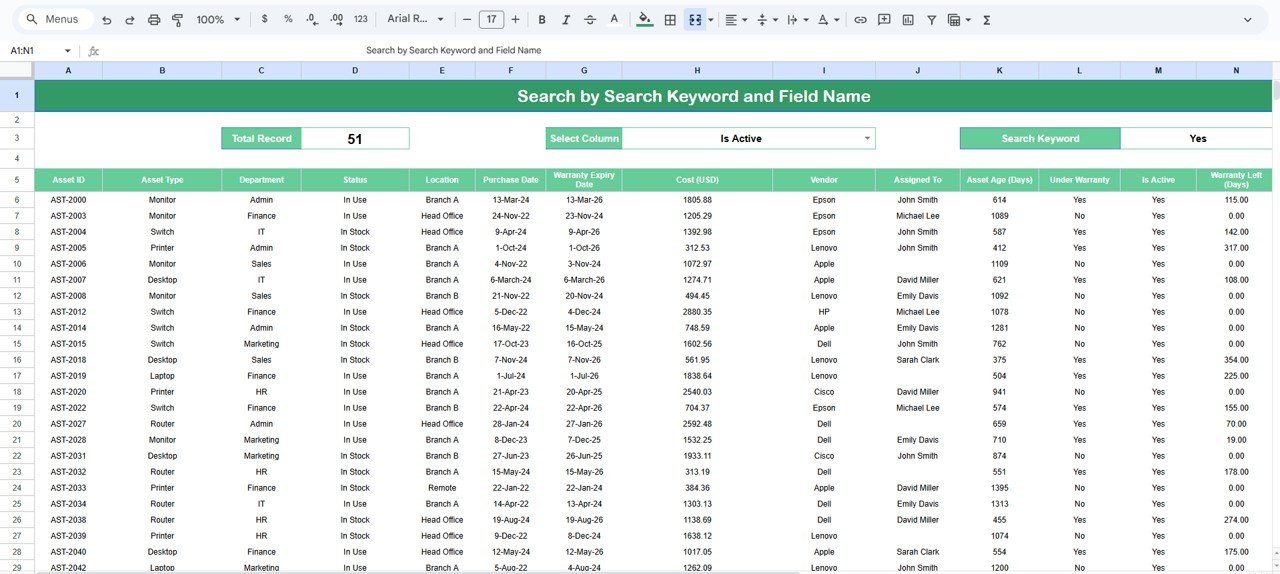
🟫 Search Tab
Quickly filter and locate asset records using keywords or field selections — perfect for audits, meetings, and compliance checks.
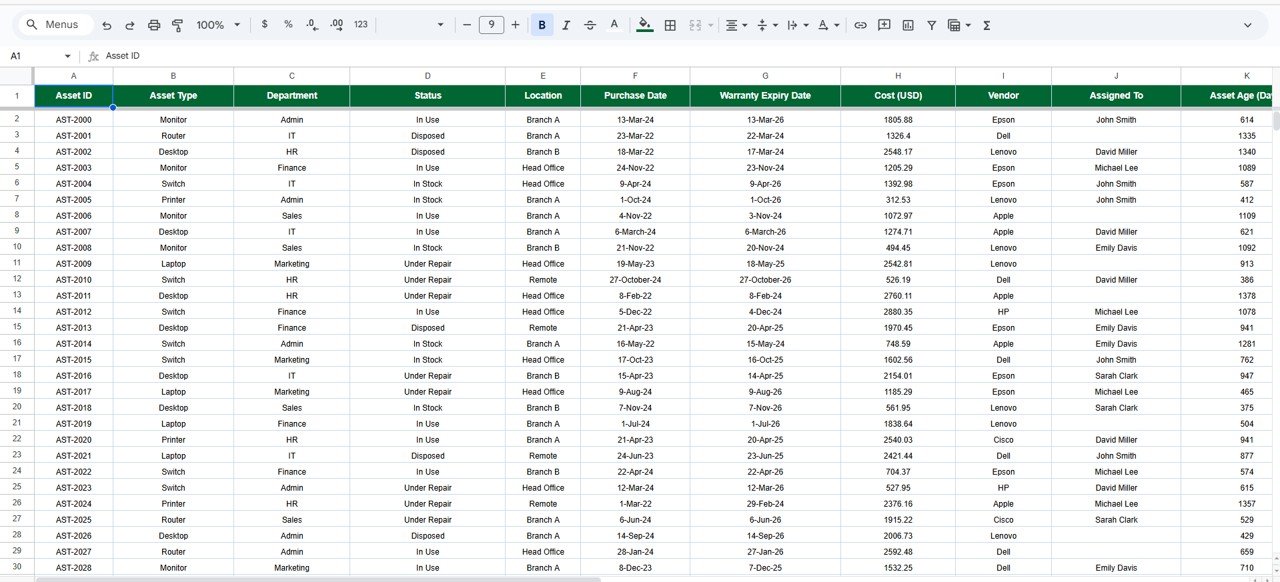
⬜ Data Sheet Tab
The core database storing all asset details including:
Asset ID, Asset Type, Vendor, Location, Purchase Cost, Warranty End Date, Status, Department, Depreciation, Net Book Value, and more.
Updating this sheet automatically refreshes all dashboards.
How to Use the Enterprise Asset Monitoring Dashboard in Google Sheets
Follow these simple steps:
🔹 Step 1: Enter Asset Data into the Data Sheet (cost, type, status, vendor, dates).
🔹 Step 2: Update Status & Warranty regularly to maintain accuracy.
🔹 Step 3: Review KPI Cards for real-time asset health insights.
🔹 Step 4: Analyze Charts to identify high-value assets, inactive items, and vendor performance.
🔹 Step 5: Use Monthly Trends to track depreciation patterns and plan replacements.
🔹 Step 6: Use Search Tab to instantly locate asset details during audits or inspections.
All charts update automatically as your data changes.
Who Can Benefit from This Enterprise Asset Monitoring Dashboard in Google Sheets
🏢 Operations Teams – Monitor asset usage and performance easily.
💻 IT Departments – Track laptops, devices, servers, and accessories.
🏭 Manufacturing Units – Manage machinery, tools, and equipment.
💼 Finance Teams – Get accurate depreciation, asset value, and cost insights.
📦 Procurement Teams – Compare vendor performance and optimize spending.
🏠 Facility Management – Track office assets, furniture, maintenance cycles.
🛠️ Asset & Inventory Managers – Maintain records for thousands of assets.
If your organization depends on physical assets, this dashboard is the perfect solution for visibility and control.
Click here to read the Detailed blog post
Watch the step-by-step video Demo:


Reviews
There are no reviews yet.