Unlock the power of data with our Energy & Utility Dashboard in Power BI, designed specifically for energy and utility companies aiming to optimize operations, reduce downtime, and stay compliant with sustainability goals. Whether you manage solar plants, wind farms, or thermal facilities, this ready-to-use dashboard empowers you with real-time insights to drive efficiency, track emissions, and monitor performance—all from one central place.
🔑 Key Features of the Energy & Utility Dashboard in Power BI
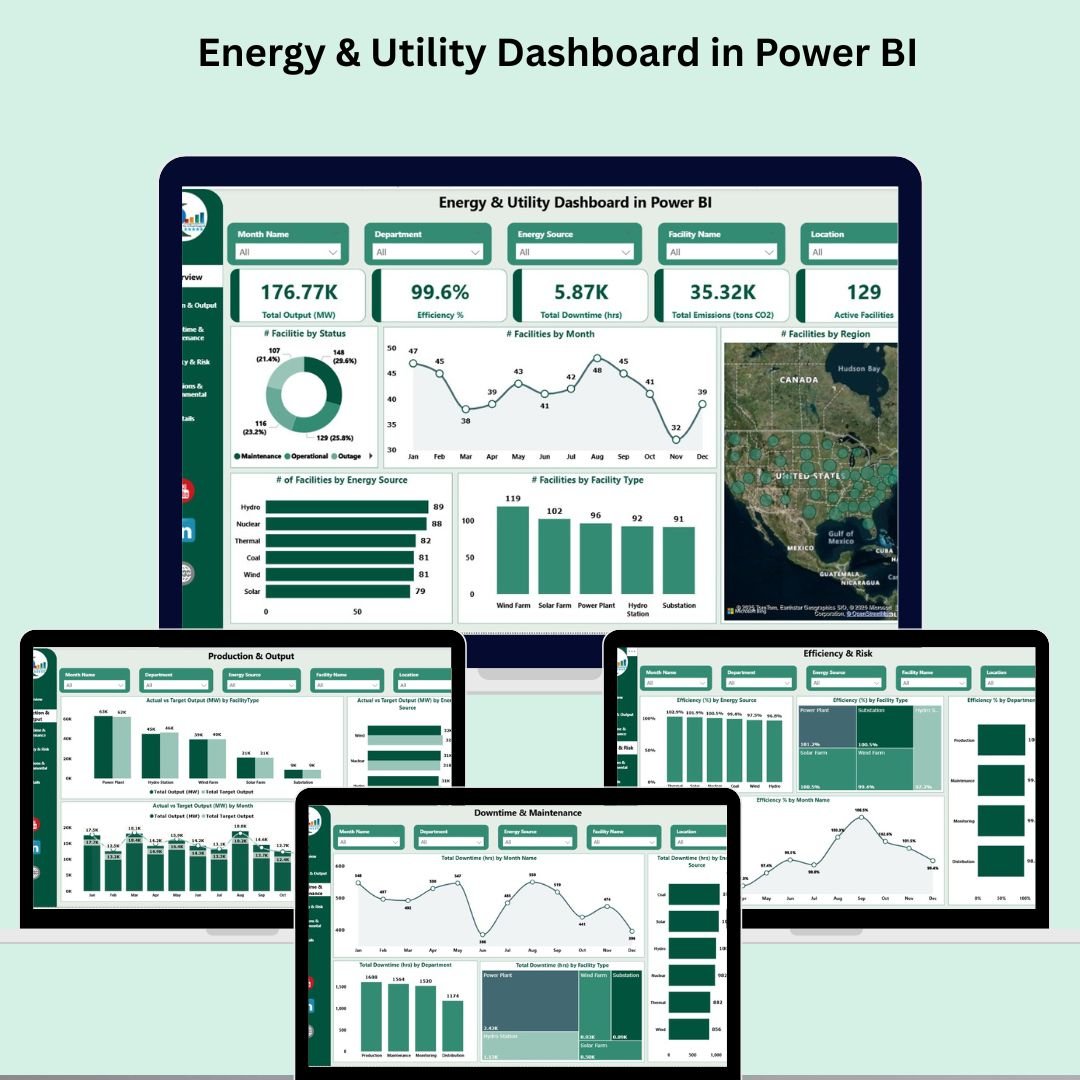
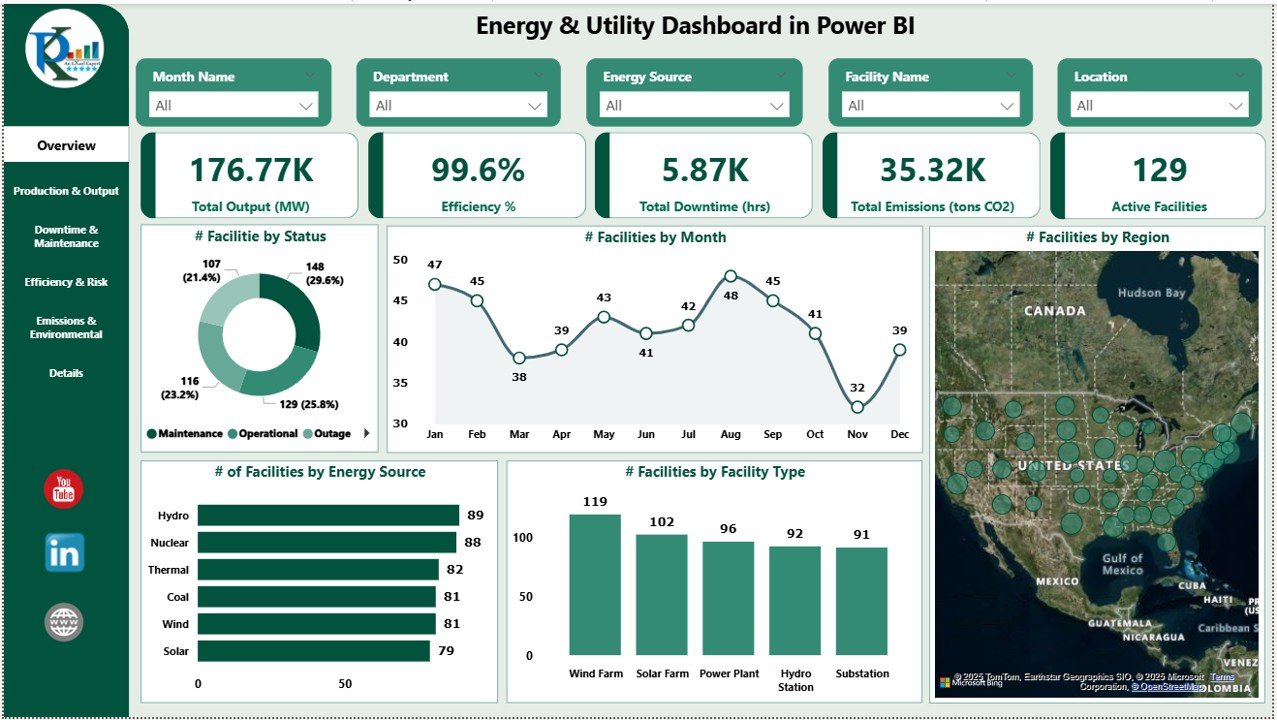
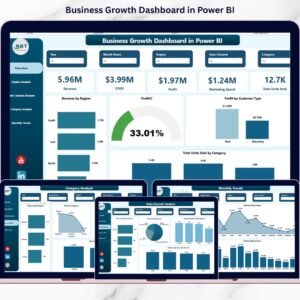
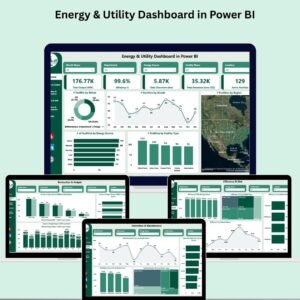
📊 Overview Page – Instant Snapshot
Get a high-level summary of energy performance with dynamic cards showing:
-
Total Output (MW)
-
Efficiency (%)
-
Total Downtime (hrs)
-
Total Emissions (tons CO2)
-
Active Facilities
Also includes charts like:
-
of Facilities by Status, Type, Source, Month, and Region
Perfect for senior managers to assess operations at a glance.
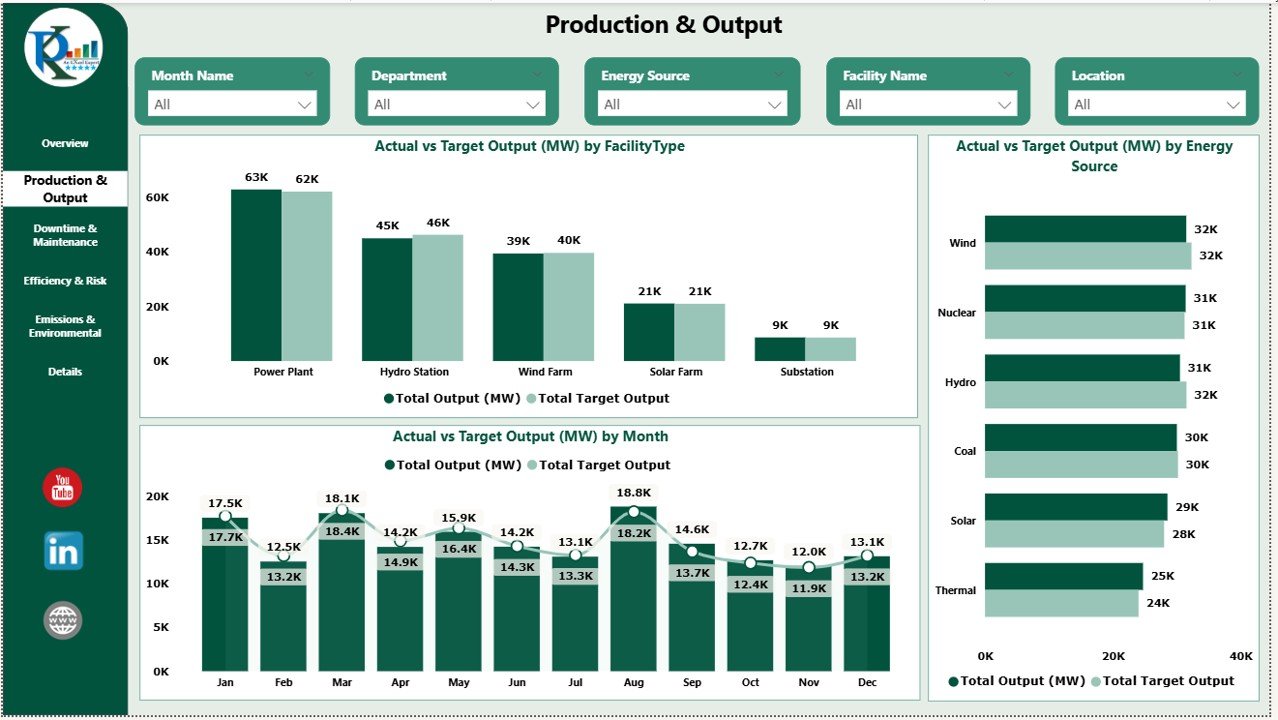
⚙️ Production & Output Page
Track performance against energy targets:
-
Compare actual vs target output by Facility Type, Energy Source, and Month
-
Visualize production trends across all operations
This helps spot underperforming facilities early.
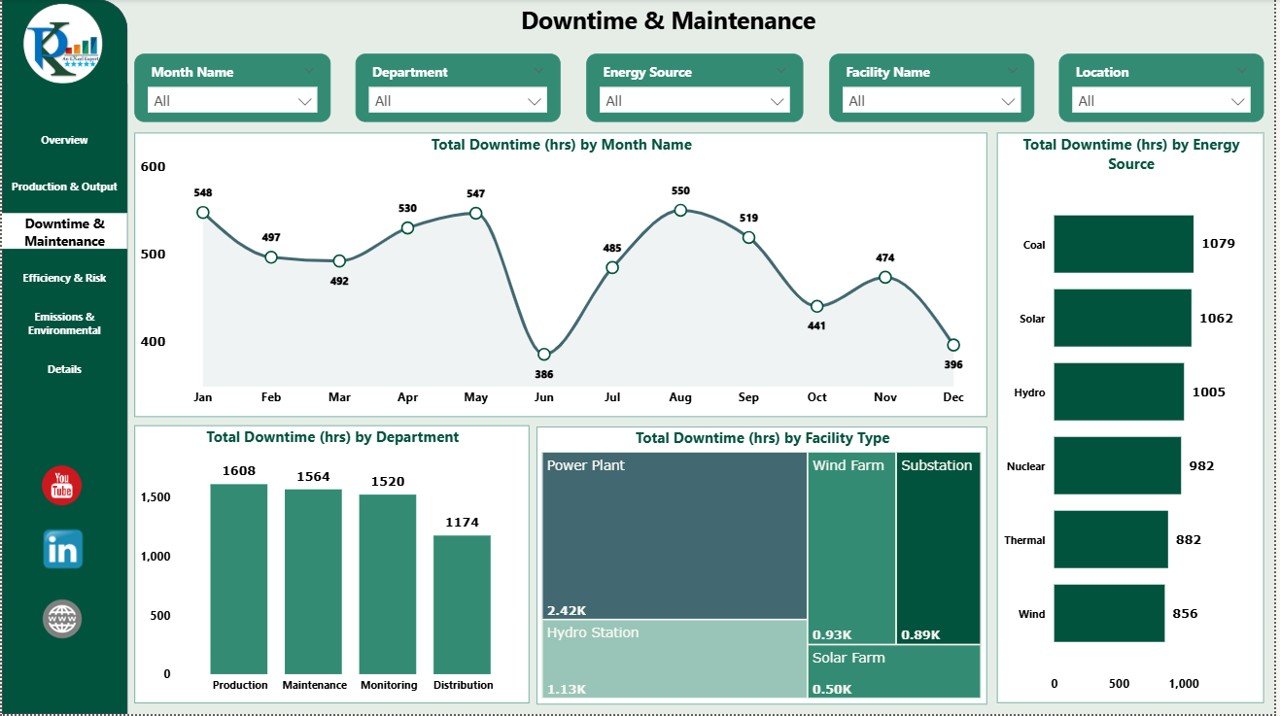
🔧 Downtime & Maintenance Page
Monitor and minimize operational downtime with:
-
Total Downtime by Month, Energy Source, Facility Type, and Department
-
Identify patterns and departmental bottlenecks
Ensure optimal uptime and smoother maintenance planning.
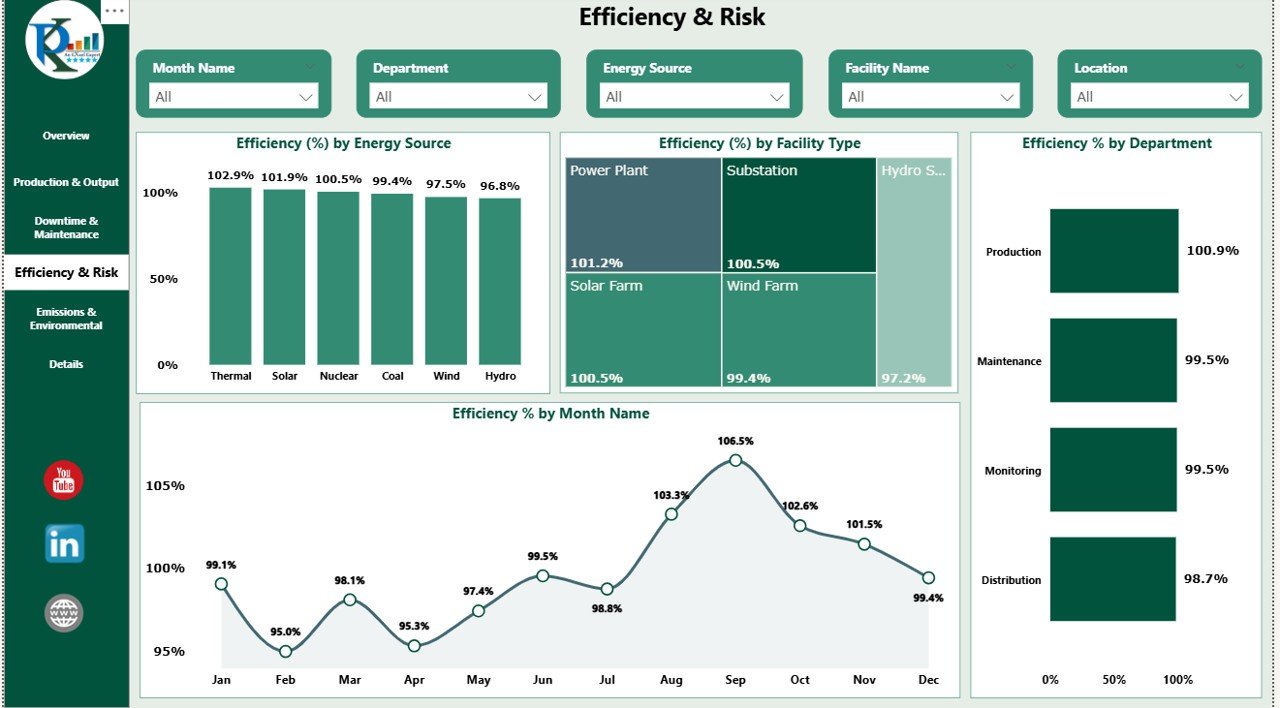
📈 Efficiency & Risk Page
Measure how efficiently your energy sources are performing:
-
View efficiency % by Source, Facility Type, Department, and Month
-
Uncover gaps and areas for improvement
-
Minimize operational risk by analyzing efficiency patterns
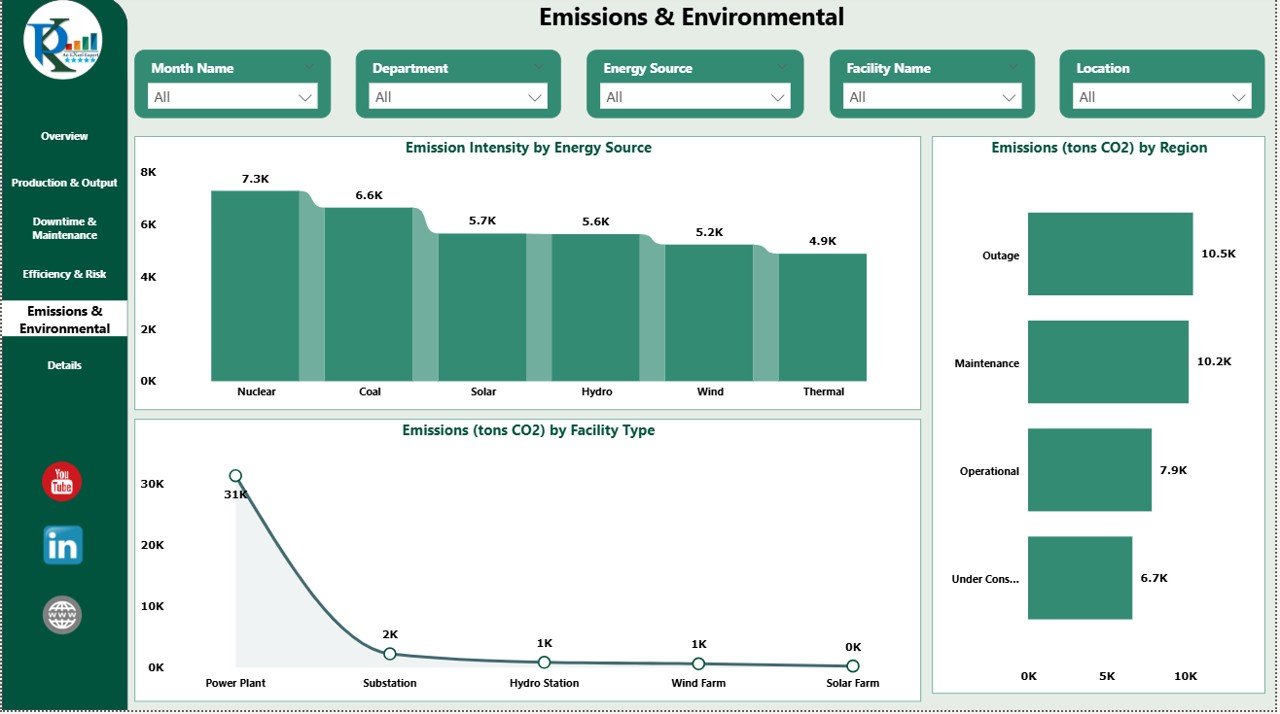
🌍 Emissions & Environmental Page
Stay compliant with environmental regulations and sustainability goals:
-
Track Emission Intensity by Source
-
Analyze emissions (tons CO2) by Region and Facility Type
-
Make data-backed decisions to reduce your carbon footprint
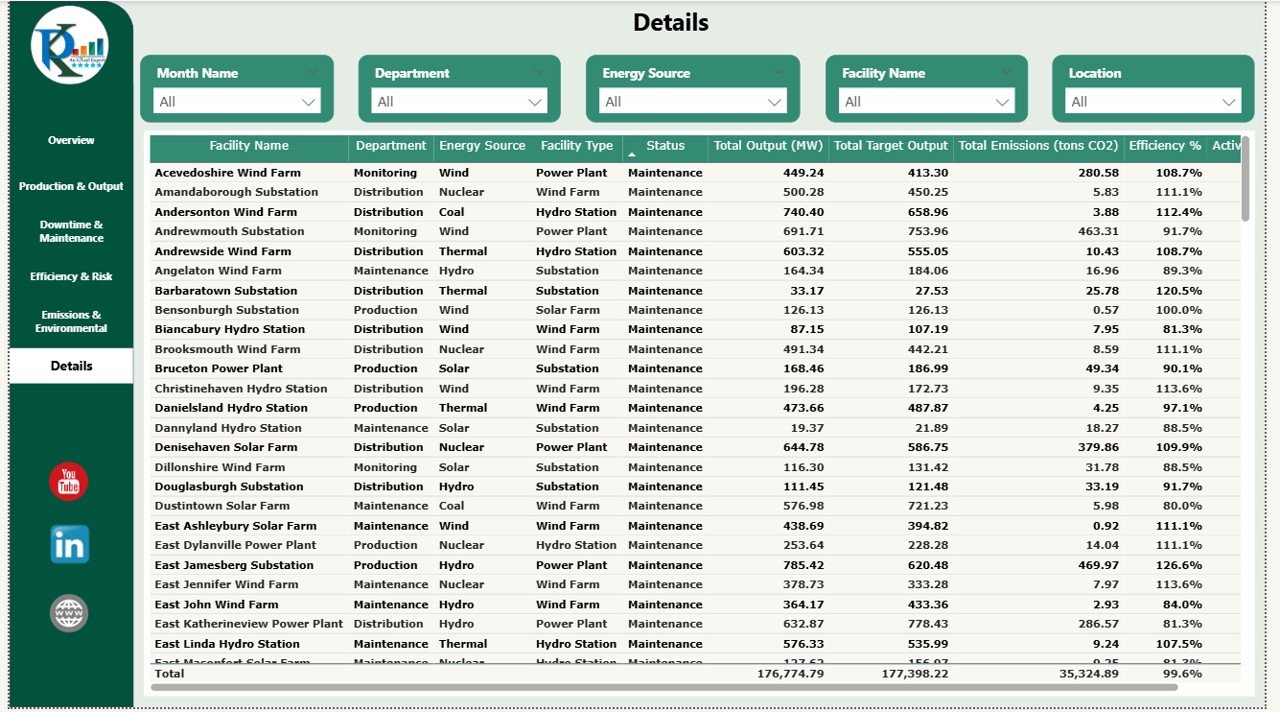
📋 Details Page
A raw data table that supports all visuals, ideal for:
-
Custom filtering
-
Exporting
-
Drill-down analytics
📦 What’s Inside the Energy & Utility Dashboard in Power BI
This powerful Power BI file includes:
✅ 6 Interactive Pages – Overview, Production, Downtime, Efficiency, Emissions & Data Table
✅ Cards and Charts – Dynamic visuals for every KPI
✅ Page-Level Slicers – Filter by Month, Facility Type, Department, Energy Source
✅ Full Customization – Add new charts, tweak visuals, and update KPIs as needed
✅ Excel-Driven Data – Easy data input from Excel sources
No complex configuration. Just load your data and start exploring.
🧠 How to Use the Energy & Utility Dashboard in Power BI
🟢 Step 1: Import your facility-level data from Excel or database
📊 Step 2: Navigate to any page to monitor key metrics
🎯 Step 3: Use slicers to filter by energy source, facility type, or region
🔧 Step 4: Customize layout or visuals to suit your needs
📤 Step 5: Share insights with stakeholders through Power BI workspace
Designed for quick adoption—no advanced Power BI skills required!
🌍 Who Can Benefit from This Dashboard?
🏭 Energy Plant Managers – Monitor facility performance across regions
📉 Maintenance Teams – Spot downtime trends and prioritize actions
📈 Operations & Compliance Officers – Track emissions, efficiency, and reporting metrics
🧑💼 Executives – Make strategic decisions based on live performance indicators
📊 Business Analysts – Use real-time data to run scenarios and improve productivity
Whether you manage a single plant or a national network, this dashboard gives you control and clarity.
✅ Why Choose Our Power BI Energy Dashboard?
✔ 6 Detailed, Interactive Pages
✔ Real-Time Charts and KPIs
✔ Simple Excel Integration
✔ Slicer-Driven Filtering
✔ Fully Customizable
✔ Export-Ready for Reports
It’s your all-in-one solution for sustainable, data-driven energy management.
🔁 Click here to read the Detailed blog post
Click here to read the Detailed blog post


Reviews
There are no reviews yet.