Managing employee leave efficiently is essential for maintaining productivity, controlling workforce costs, and supporting employee well-being. However, many HR teams still rely on scattered spreadsheets, manual calculations, or static reports. As a result, leave data becomes difficult to analyze, trends remain hidden, and decision-making turns reactive.
That is exactly why the Employee Leave Dashboard in Google Sheets becomes a powerful, ready-to-use HR analytics solution.
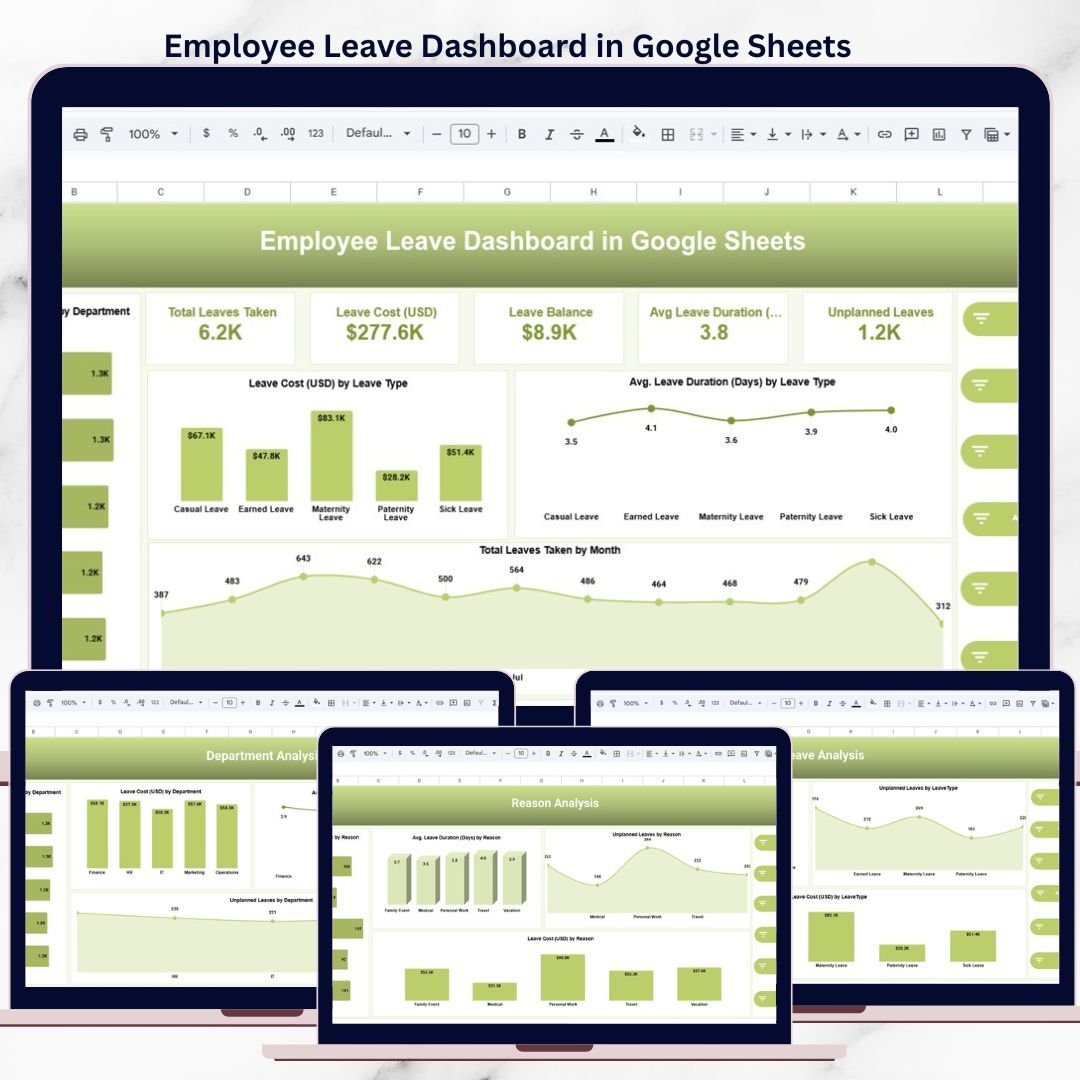
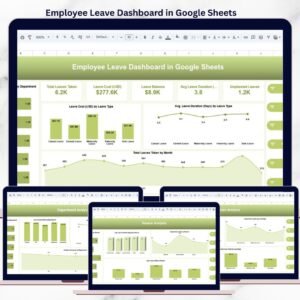
This professionally designed dashboard converts raw employee leave records into clear, interactive, and actionable insights. With automated calculations, dynamic slicers, and visually rich charts, HR teams and managers can instantly understand leave patterns, costs, and risks—without complex formulas or additional software.
Because the dashboard is built entirely in Google Sheets, it is cloud-based, easy to share, and simple to customize. Teams can collaborate in real time and keep leave reporting accurate, consistent, and always up to date.
🚀 Key Features of the Employee Leave Dashboard
📊 Centralized Leave Performance Overview
The dashboard provides a single source of truth for employee leave analytics, including:
-
Total leaves taken
-
Total leave cost (USD)
-
Leave balance
-
Average leave duration (days)
-
Unplanned leaves
These KPIs help HR leaders quickly assess overall leave impact and workforce availability.
📂 Dashboard Structure & Page-Wise Explanation
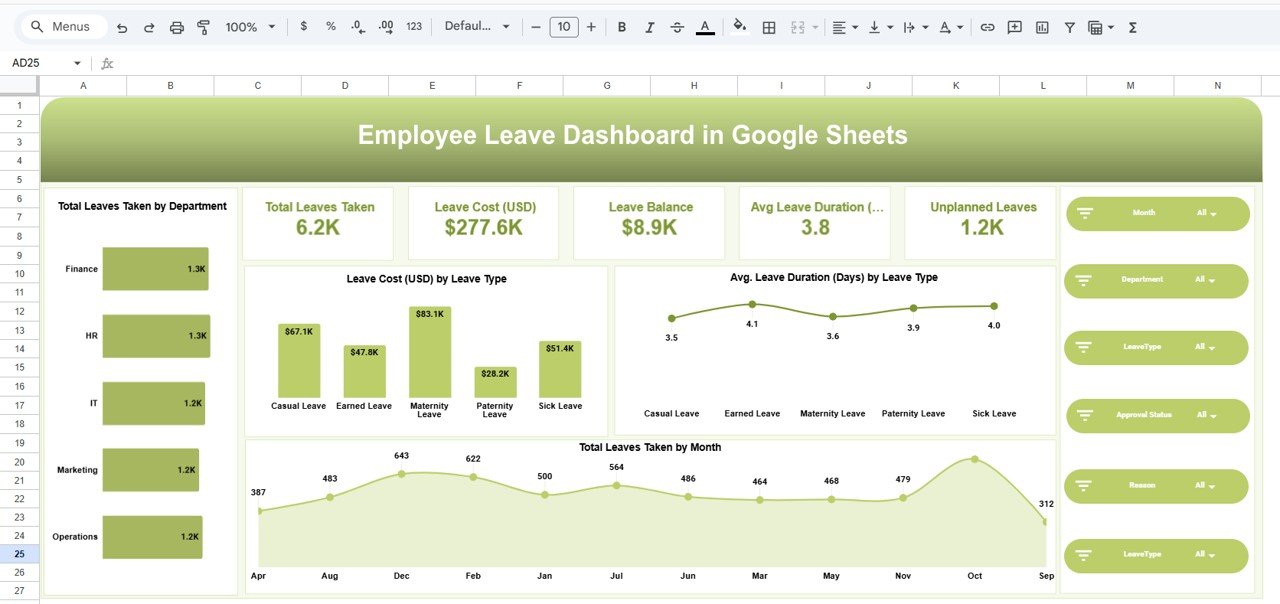
🏠 1. Overview Page – Leave Snapshot
The Overview page delivers a high-level summary of leave performance.
KPI Cards Included
-
Total Leaves Taken
-
Total Leave Cost (USD)
-
Leave Balance
-
Average Leave Duration
-
Unplanned Leaves
Key Visuals
-
Total leaves taken by department
-
Leave cost by leave type
-
Average leave duration by leave type
-
Monthly trend of leaves taken
Interactive Filters
-
Month
-
Department
-
Leave Type
-
Approval Status
-
Reason
All KPIs and charts update instantly based on filter selections.
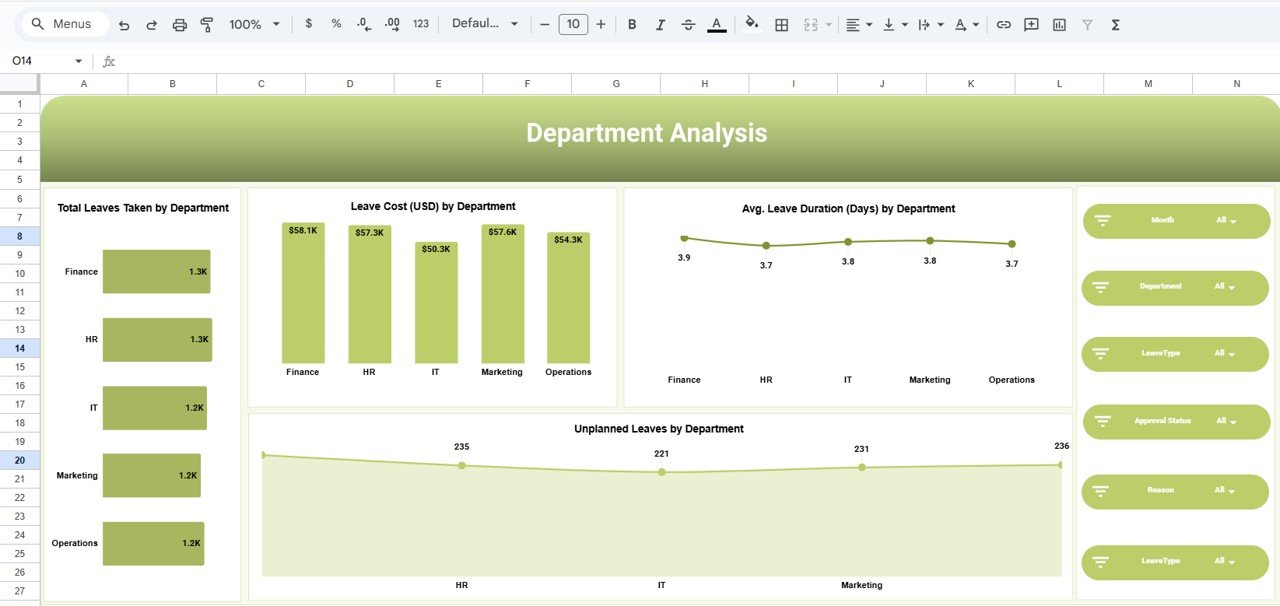
🏢 2. Department Analysis – Department-Wise Insights
This page compares leave behavior across departments.
Analysis Covered
-
Total leaves taken by department
-
Leave cost (USD) by department
-
Average leave duration by department
-
Unplanned leaves by department
Business Value
-
Identify departments with high leave impact
-
Detect burnout or workload issues
-
Support staffing and workforce planning
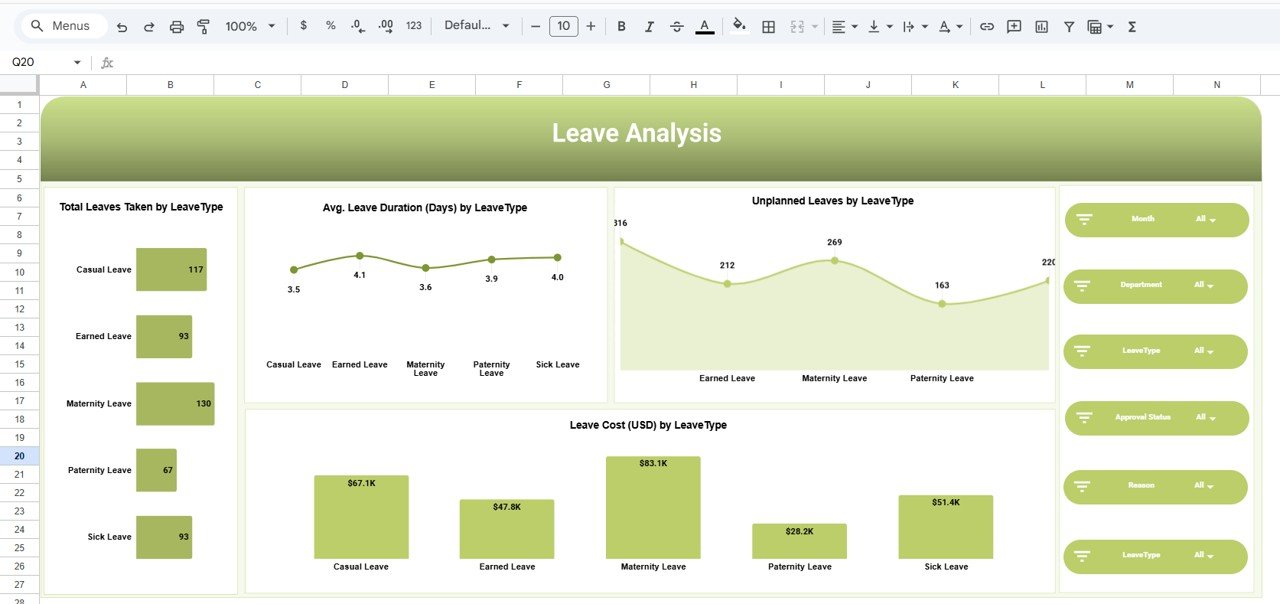
🗂️ 3. Leave Type Analysis – Category-Level View
Different leave types affect operations differently.
Visuals Included
-
Total leaves by leave type
-
Average leave duration by leave type
-
Unplanned leaves by leave type
-
Leave cost by leave type
Typical Leave Types
-
Casual Leave
-
Earned Leave
-
Sick Leave
-
Maternity / Paternity Leave
This analysis supports policy optimization and better leave planning.
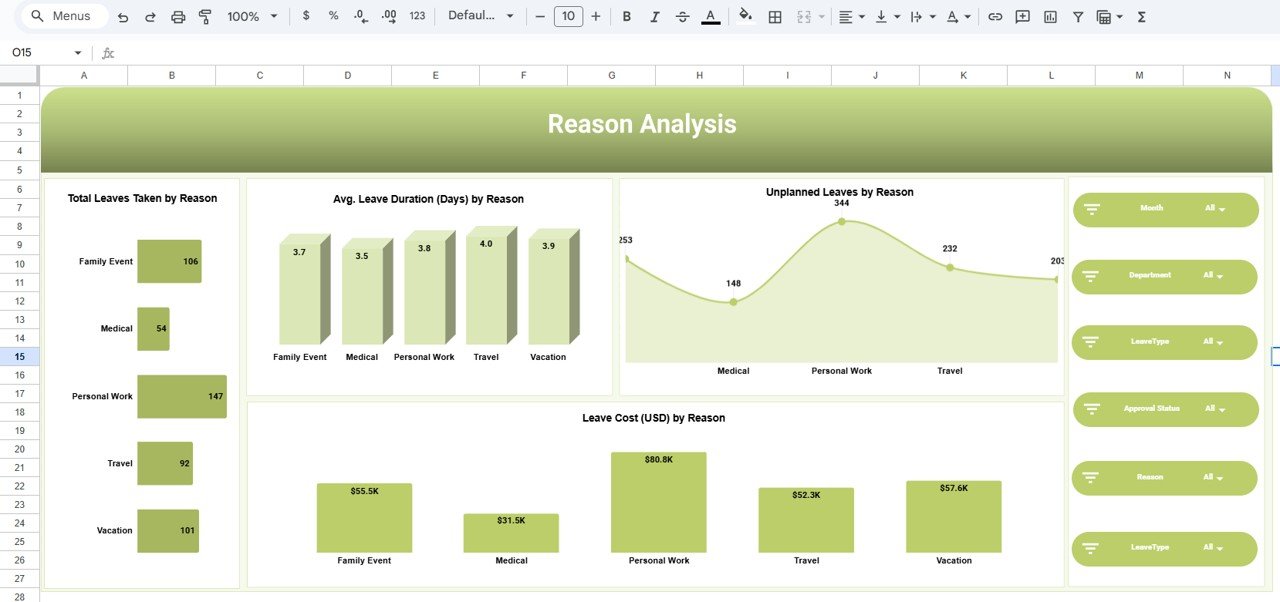
❓ 4. Reason Analysis – Why Employees Take Leave
Understanding leave reasons helps improve HR policies and wellness initiatives.
Key Metrics
-
Total leaves by reason
-
Average leave duration by reason
-
Unplanned leaves by reason
-
Leave cost by reason
Common Reasons
-
Medical
-
Personal Work
-
Family Event
-
Travel / Vacation
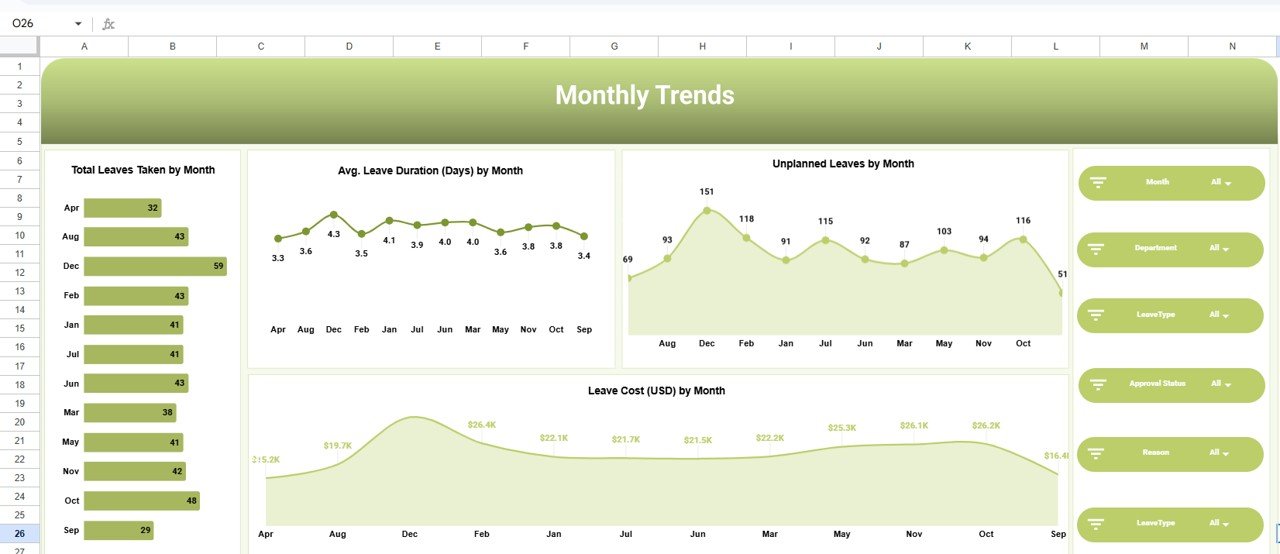
📈 5. Monthly Trends – Time-Based Patterns
This page highlights seasonal and recurring leave trends.
Trend Analysis
-
Total leaves taken by month
-
Average leave duration by month
-
Unplanned leaves by month
-
Leave cost by month
Why It Matters
-
Forecast peak leave periods
-
Optimize staffing schedules
-
Reduce operational disruptions
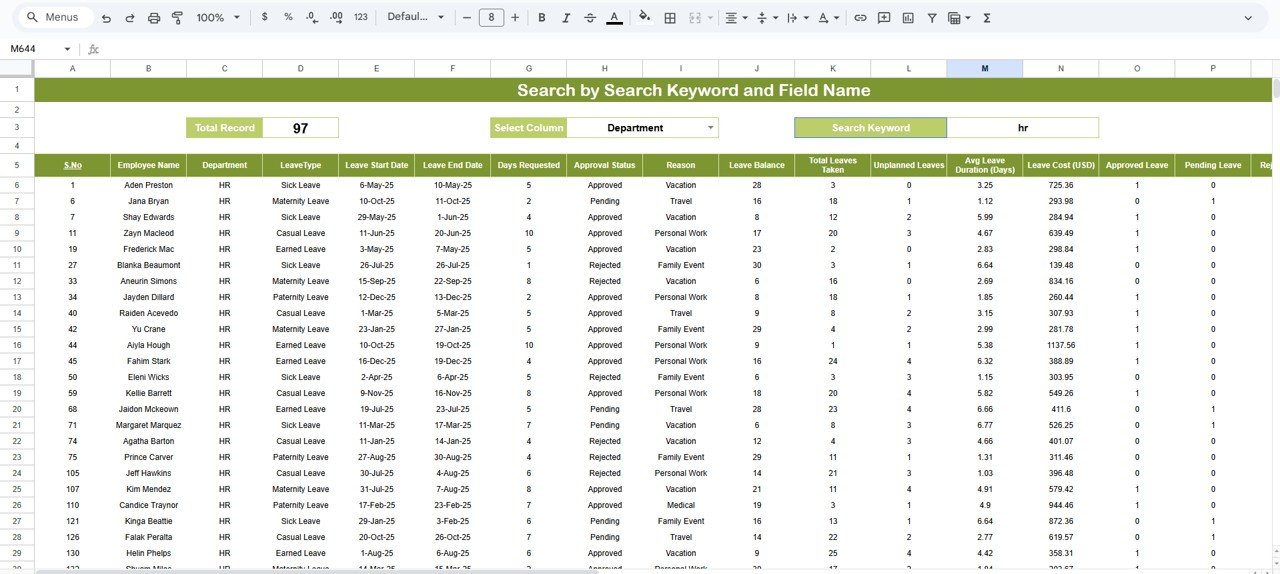
🧾 6. Underlying Data Sheet – Clean & Scalable
The dashboard is powered by a structured, pivot-ready data table with fields such as:
-
Employee Name
-
Department
-
Leave Type
-
Leave Start & End Date
-
Days Requested
-
Approval Status
-
Reason
-
Leave Balance
-
Leave Cost (USD)
-
Month & Year
This ensures scalability and long-term usability.
👥 Who Can Use This Dashboard?
-
HR Managers & HR Analysts
-
Operations & Workforce Planning Teams
-
Business Owners & Leaders
-
People Analytics Professionals
🎯 How This Dashboard Helps
-
Replaces manual leave reporting
-
Improves visibility into leave costs
-
Identifies unplanned leave risks
-
Supports data-driven HR decisions
-
Saves hours of reporting effort
### Click here to read the Detailed blog post
Watch the step-by-step video tutorial:
👉 Visit our YouTube channel to learn step-by-step video tutorials
Youtube.com/@NeotechNavigators


Reviews
There are no reviews yet.