


Emergency Medical Services operate in life-critical environments where delays cost lives, efficiency saves resources, and visibility drives better decisions. However, when EMS performance data is trapped inside spreadsheets or static reports, leaders struggle to identify gaps, track response efficiency, and maintain accountability.
That is exactly why the Emergency Medical Services KPI Dashboard in Power BI is designed as a powerful, ready-to-use performance management solution for modern EMS organizations. This dashboard transforms raw EMS data into clear KPIs, visual indicators, and trend insights—so decision-makers can act faster, smarter, and with confidence.
Built using Power BI for visualization and Excel for data input, this dashboard combines analytical power with everyday usability. You gain real-time insight into response performance, target achievement, and historical trends without complex integrations or advanced technical skills.
🔑 Key Features of Emergency Medical Services KPI Dashboard in Power BI
🚀 Centralized KPI Monitoring
Track all EMS KPIs in one executive-ready dashboard instead of juggling multiple reports.
📅 MTD & YTD Performance Tracking
Monitor Month-to-Date and Year-to-Date actuals against defined targets and previous year benchmarks.
🎯 Target vs Actual Analysis
Instantly identify overperforming and underperforming KPIs using visual status indicators.
📊 Previous Year Comparison
Evaluate progress and regression using CY vs PY comparisons for both MTD and YTD.
📈 Interactive KPI Trend Analysis
Understand why performance changes using combo charts that show trends over time.
🧭 Drill-Through KPI Definitions
Ensure clarity and governance with detailed KPI definitions, formulas, and measurement logic.
⚙️ Excel-Based Data Entry
Update actuals and targets easily using structured Excel sheets—no coding required.

📦 What’s Inside the Emergency Medical Services KPI Dashboard in Power BI
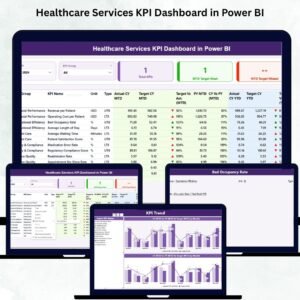
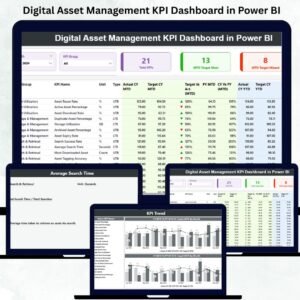
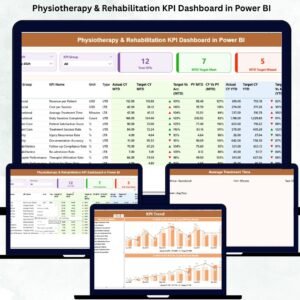
This product includes a fully designed Power BI dashboard with three purpose-built analytical pages:
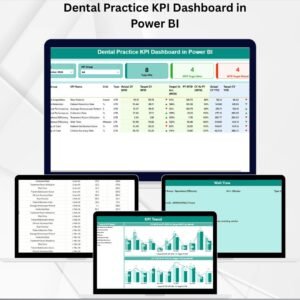
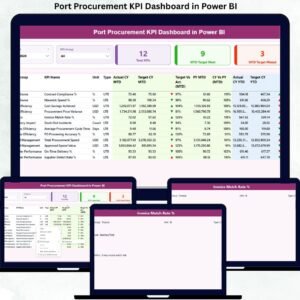
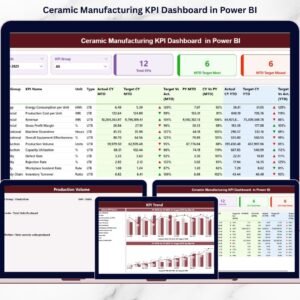
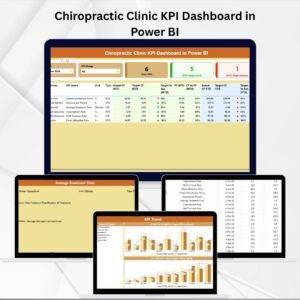
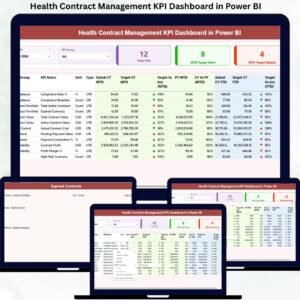
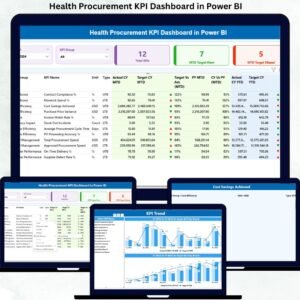
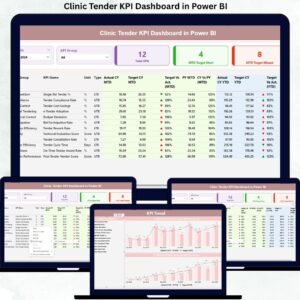
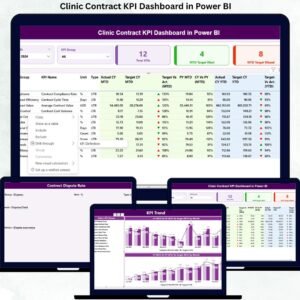
📌 Summary Page
Acts as the control center, showing KPI cards, slicers, and a detailed KPI performance table.
📌 KPI Trend Page
Visualizes MTD and YTD performance using combo charts to highlight trends and patterns.
📌 KPI Definition Page
Provides standardized KPI definitions, formulas, units, and KPI types (LTB / UTB).
📂 Excel Data Source File
Includes structured sheets for:
-
Actual KPI values
-
Target KPI values
-
KPI master definitions
Everything is pre-connected and ready to refresh.
🛠️ How to Use the Emergency Medical Services KPI Dashboard in Power BI
Using this dashboard is simple and intuitive:
1️⃣ Enter actual performance data into the Input_Actual Excel sheet
2️⃣ Define targets in the Input_Target Excel sheet
3️⃣ Maintain KPI metadata in the KPI Definition sheet
4️⃣ Open the Power BI file and click Refresh
5️⃣ Use slicers to analyze KPIs by month or KPI group
6️⃣ Drill through to understand KPI logic and trends
Within minutes, you gain a complete EMS performance overview.
👥 Who Can Benefit from This Emergency Medical Services KPI Dashboard in Power BI
This dashboard is ideal for:
🚑 EMS Directors & Administrators
📋 Emergency Operations Managers
🏥 Hospital & Healthcare Administrators
📊 Quality & Performance Improvement Teams
🏛️ Public Health & City Planning Authorities
📈 Data-Driven EMS Organizations
Whether you manage a small EMS unit or a large emergency response network, this dashboard scales effortlessly.
Click here to read the detailed blog post
Visit our YouTube channel to learn step-by-step video tutorials
Watch the step-by-step video tutorial:


Reviews
There are no reviews yet.