
Electricity projects are complex, capital-intensive, and time sensitive. Power generation plants, transmission upgrades, grid modernization, substations, and utility infrastructure projects require tight budget control, accurate cost tracking, progress monitoring, and risk management. However, when project data is scattered across Excel files and manual reports, visibility drops. As a result, cost overruns increase, delays appear, and management loses control.
Electricity Project Management in Power BI That is exactly why Electricity Project Management in Power BI becomes an essential solution.
Electricity Project Management in Power BI This ready-to-use Power BI dashboard converts raw project data into interactive KPIs, dynamic visuals, and actionable insights. Instead of reacting to problems after they occur, project teams and leadership gain real-time visibility into budgets, costs, forecasts, progress, and risks—all in one professional Power BI dashboard. As a result, organizations move from reactive project tracking to proactive project governance.
🔑 Key Features of Electricity Project Management in Power BI
⚡ Centralized Project Monitoring
Track all electricity projects from a single interactive Power BI dashboard.
💰 Budget & Cost Control
Monitor Budget, Actual Cost, Cost Variance, Remaining Budget, and Budget Utilization % in real time.
📊 Forecasting & Completion Tracking
Analyze Forecast at Completion across regions and clients.
🛡️ Risk-Based Analysis
Understand budget exposure by project risk level.
🏢 Department-Wise Cost Insights
Compare budget, actual cost, and commitments across departments.
🌍 Region & Utility / Client Performance
Evaluate project performance by geography and client.
📅 Monthly Trend Analysis
Track cost, remaining budget, and forecast trends over time.
🧭 Interactive Slicers & Drilldowns
Filter insights instantly by region, department, client, or time.
🚀 Scalable Power BI Performance
Handles large electricity project datasets with ease.
📦 What’s Inside the Electricity Project Management in Power BI Dashboard
This professionally designed dashboard includes five powerful analytical pages, each answering a critical project-management question.
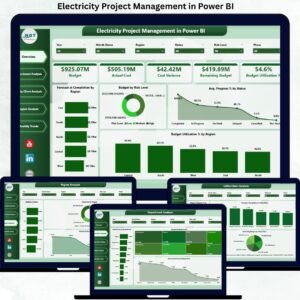
📊 Overview Page

Acts as the executive control panel with KPI cards for:
-
Budget
-
Actual Cost
-
Cost Variance
-
Remaining Budget
-
Budget Utilization %
Includes charts for:
-
Forecast at Completion by Region
-
Budget by Risk Level
-
Average Progress % by Status
-
Budget Utilization % by region
This page instantly highlights budget pressure points and delivery risks.
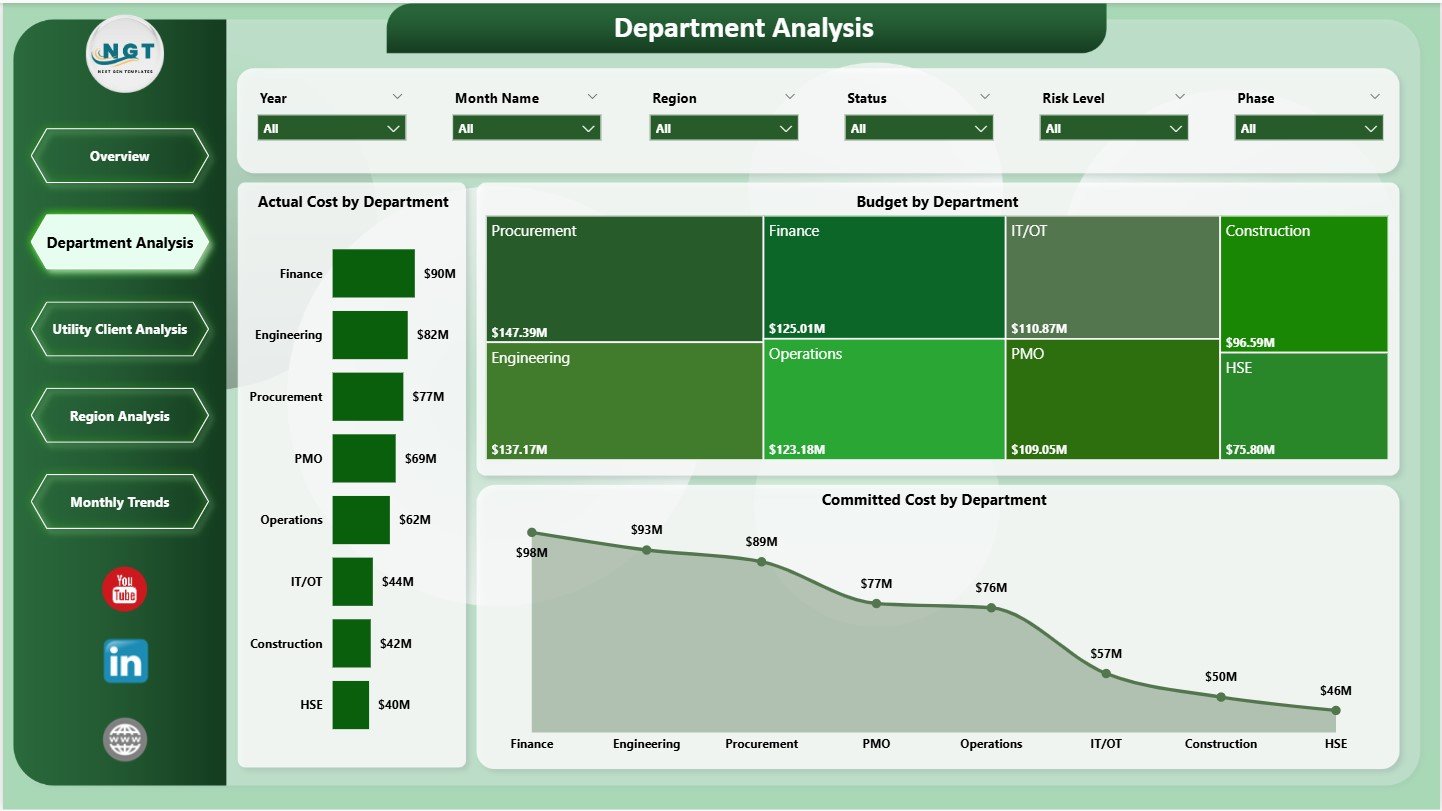
🏢 Department Analysis Page
Provides department-level insights using:
-
Actual Cost by Department
-
Budget by Department
-
Committed Cost by Department
Helps management control departmental spending and resource allocation.
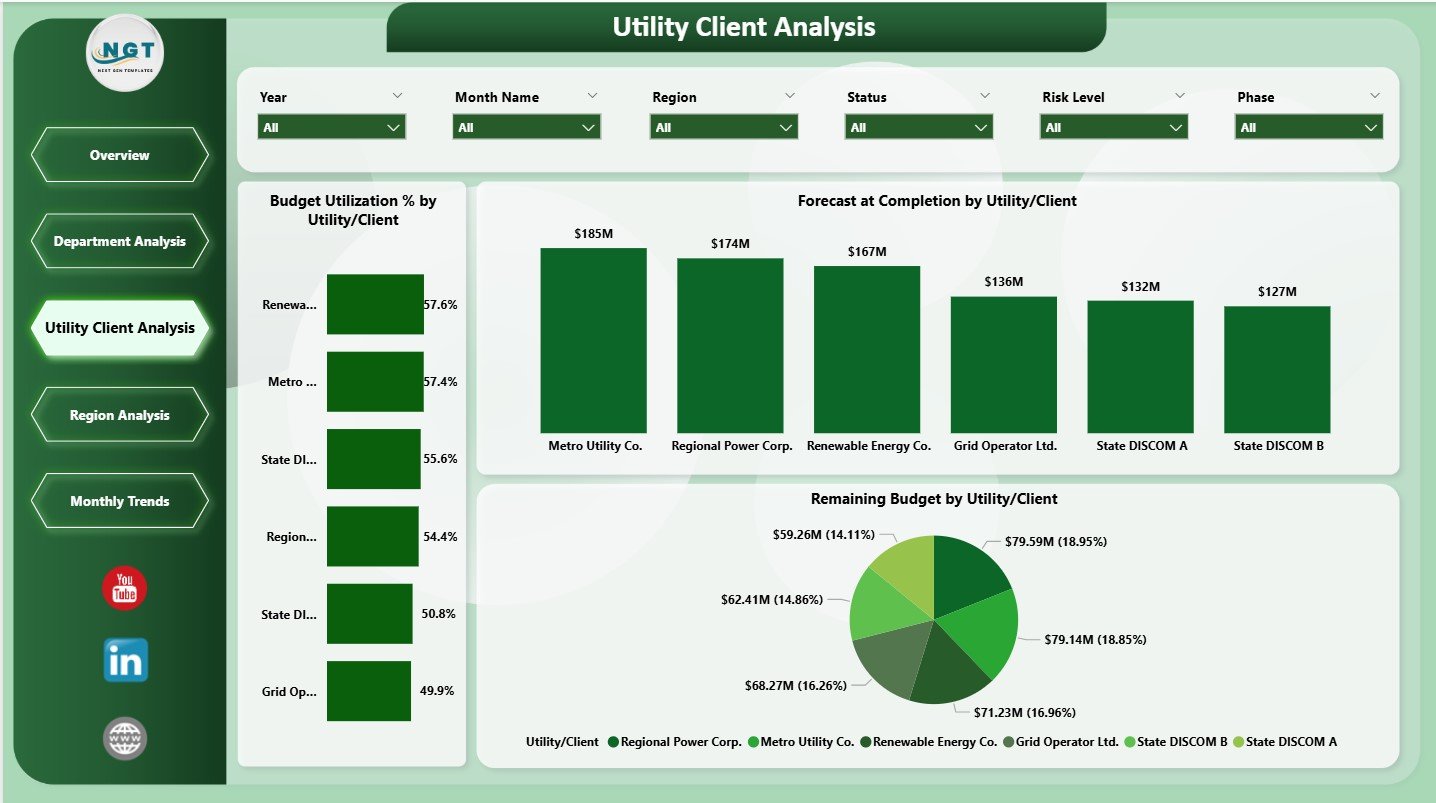
🏗️ Utility / Client Analysis Page
Analyzes performance by utility or client using:
-
Budget Utilization % by Utility / Client
-
Forecast at Completion by Utility / Client
-
Remaining Budget by Utility / Client
Supports better client prioritization and change-management control.
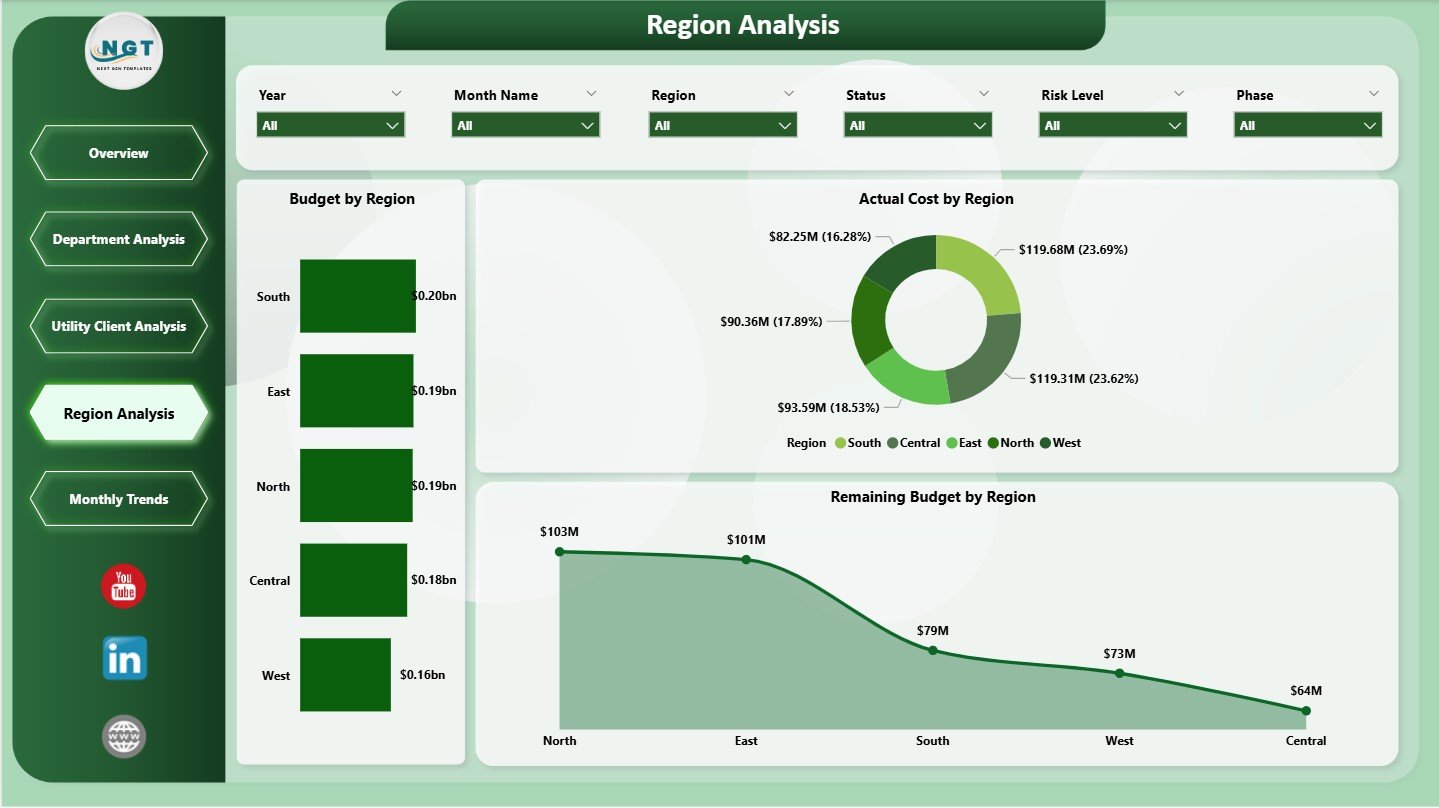
🌍 Region Analysis Page
Delivers geographic performance insights using:
-
Budget by Region
-
Actual Cost by Region
-
Remaining Budget by Region
Improves regional planning and execution strategies.
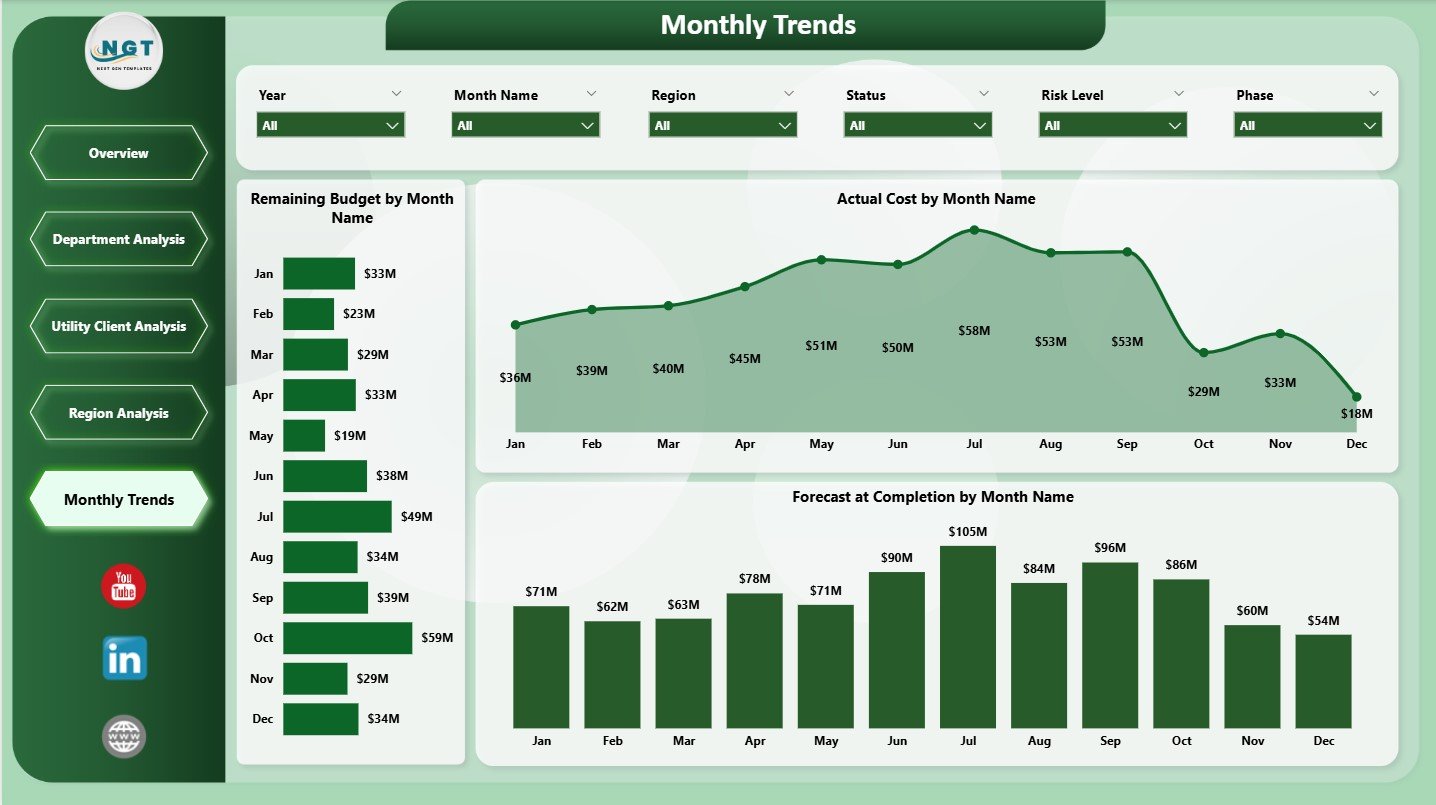
📅 Monthly Trends Page
Tracks time-based performance using:
-
Remaining Budget by Month
-
Actual Cost by Month
-
Forecast at Completion by Month
Helps detect cost spikes and forecast risks early.
▶️ How to Use Electricity Project Management in Power BI
Using this dashboard is simple and business-friendly:
1️⃣ Connect project data from Excel, databases, or ERP systems
2️⃣ Refresh data using Power BI refresh options
3️⃣ Apply slicers to filter by region, department, or client
4️⃣ Review KPIs on the Overview Page
5️⃣ Analyze costs, risks, and forecasts by department or region
6️⃣ Track monthly trends and remaining budgets
7️⃣ Take faster, data-driven project decisions
No advanced Power BI development skills are required for end users.
🎯 Who Can Benefit from Electricity Project Management in Power BI
⚡ Electricity Utilities – Gain centralized project visibility
🏗️ Power Generation & EPC Companies – Control cost and schedules
📊 Project Managers & PMOs – Monitor progress and risk proactively
💰 Finance & Planning Teams – Improve forecasting and cost control
🏢 Engineering & Operations Teams – Track execution performance
🏛️ Senior Leadership – Make confident, data-driven decisions
This dashboard supports both operational execution and strategic planning.
👉 Click here to read the Detailed Blog Post
🔔 Visit our YouTube channel to learn step-by-step video tutorials
👉 YouTube.com/@PKAnExcelExpert


Reviews
There are no reviews yet.