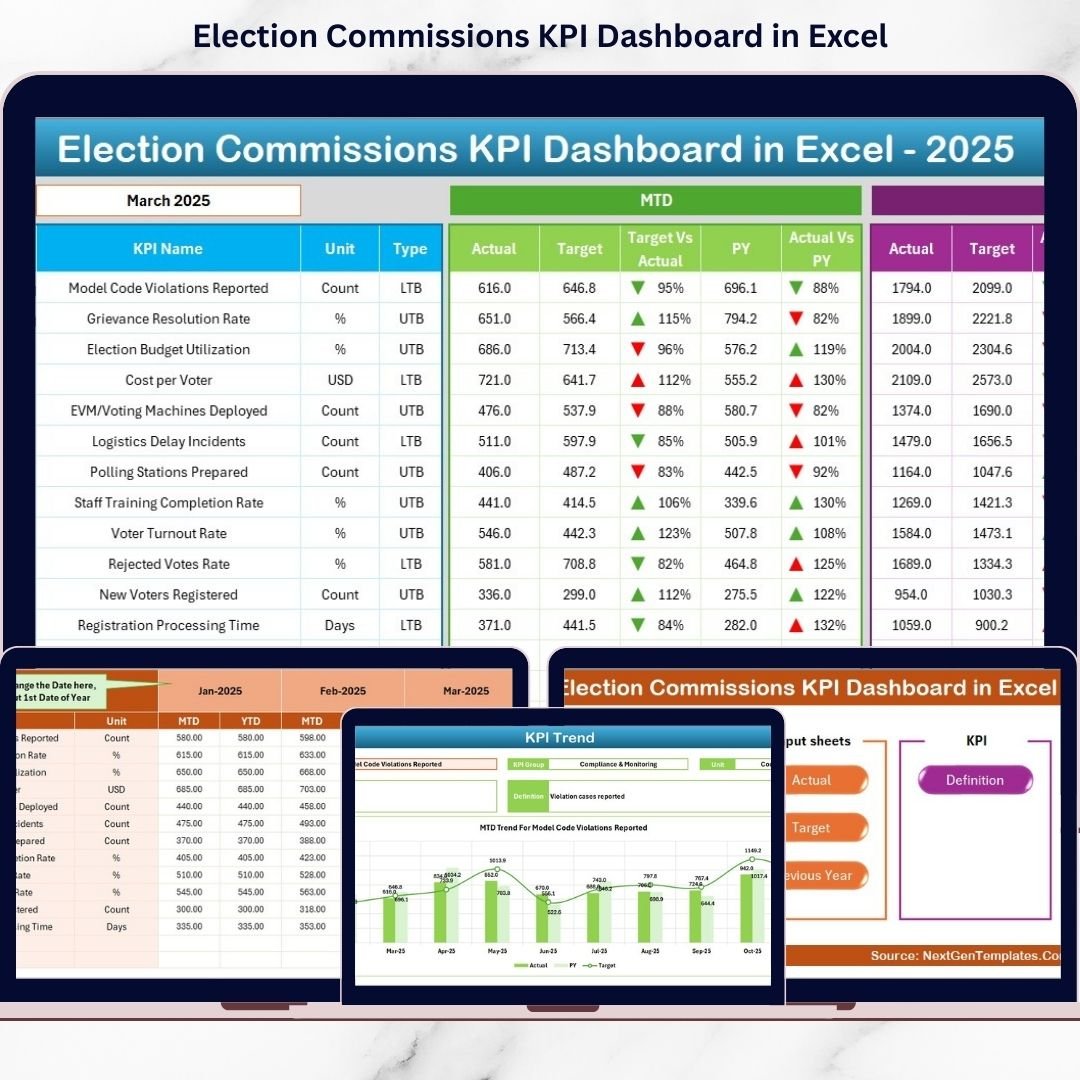
Election operations demand precision, accountability, and transparency. But managing voter turnout, polling readiness, complaint resolution, and operational efficiency across multiple spreadsheets can quickly become overwhelming.What if you could monitor everything in one professional, automated, and easy-to-use system?The Election Commissions KPI Dashboard in Excel is a ready-to-use performance monitoring solution designed specifically for election authorities. It transforms raw electoral data into meaningful insights using structured KPIs, automated comparisons, and dynamic analysis tools.
Instead of juggling multiple reports, you simply select a month and instantly review MTD (Month-To-Date) and YTD (Year-To-Date) performance. With built-in comparisons against targets and previous year data, this dashboard helps you make faster and smarter decisions.
This is not just an Excel file. It is a complete electoral performance control system.
🔥 Key Feature of Election Commissions KPI Dashboard in Excel
📊 7 Structured Worksheets – Organized system covering summary, dashboard, trend analysis, and input sheets.
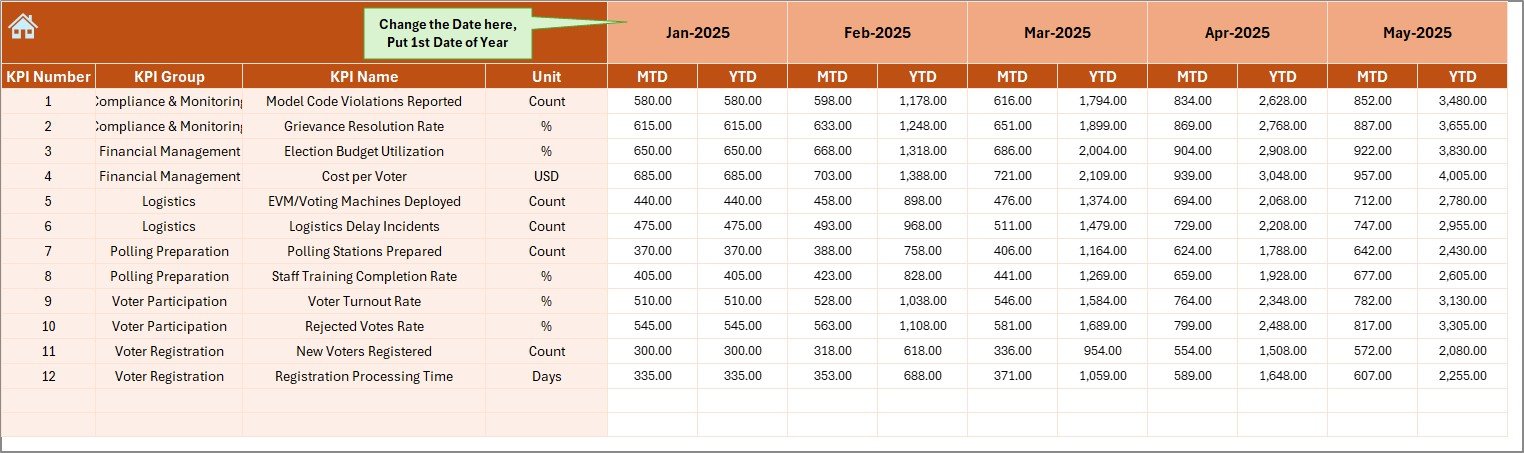
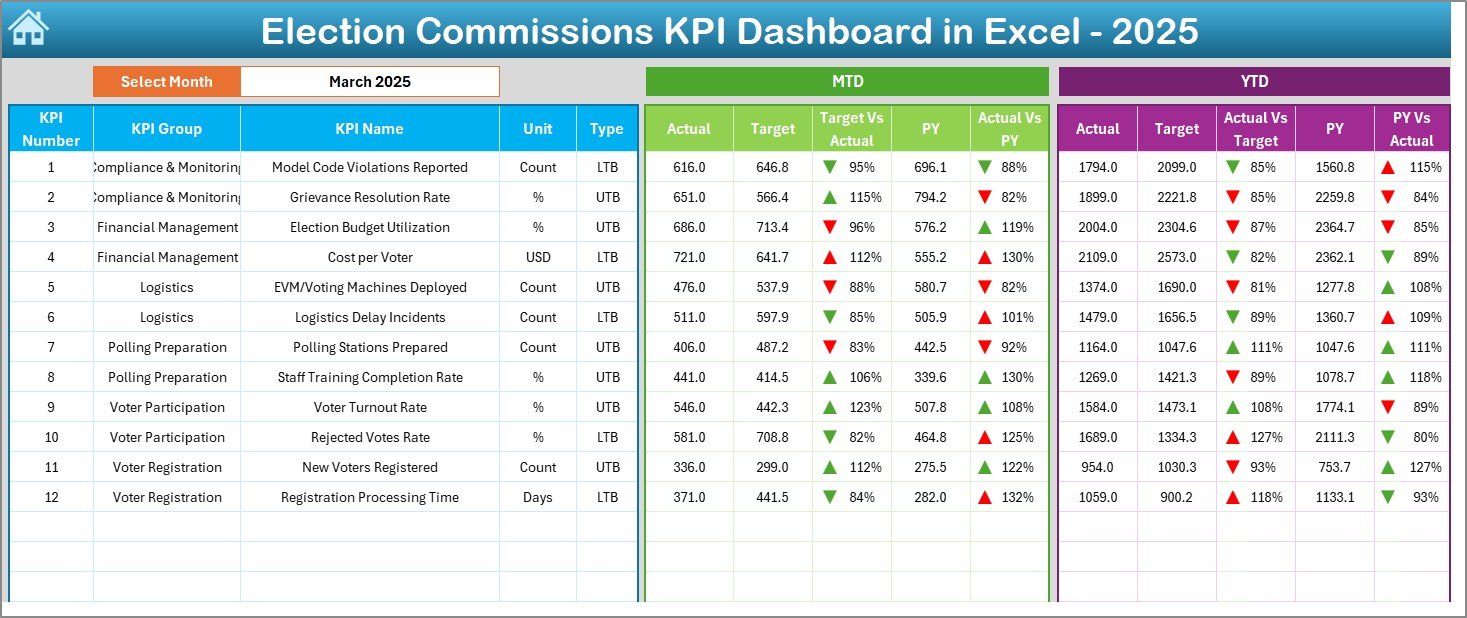
📅 Monthly Selection (Cell D3) – Choose any month and watch the entire dashboard update automatically.
📈 MTD & YTD Comparison Engine – Compare Actual vs Target and Actual vs Previous Year instantly.
🔼🔽 Performance Arrows – Conditional formatting visually highlights improvement or decline.
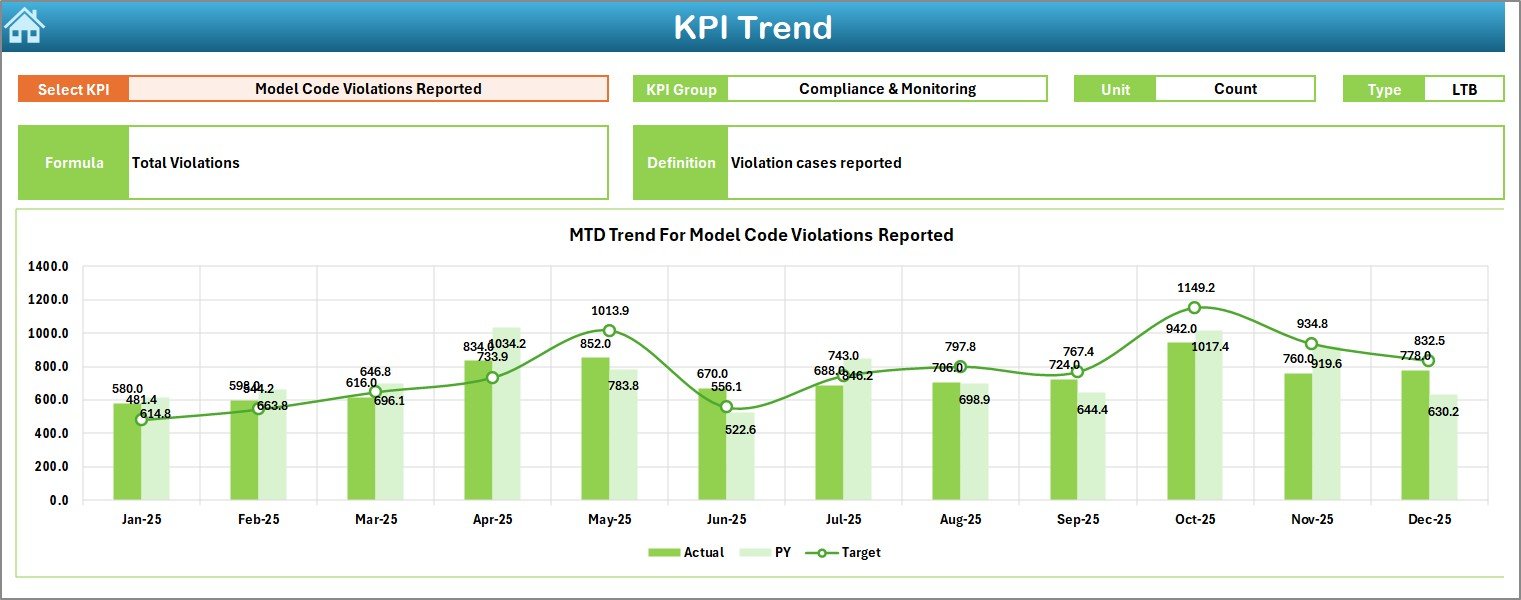
📉 Trend Analysis Charts – Analyze KPI performance across months with dynamic charts.
📂 Centralized Reporting – All electoral KPIs in one single, professional dashboard.
⚙️ Fully Customizable KPIs – Define operational, financial, voter engagement, and transparency KPIs.
🛡️ No Advanced Software Needed – Built completely inside Microsoft Excel.
📦 What’s Inside the Election Commissions KPI Dashboard in Excel
This powerful Excel template includes 7 carefully designed worksheets:
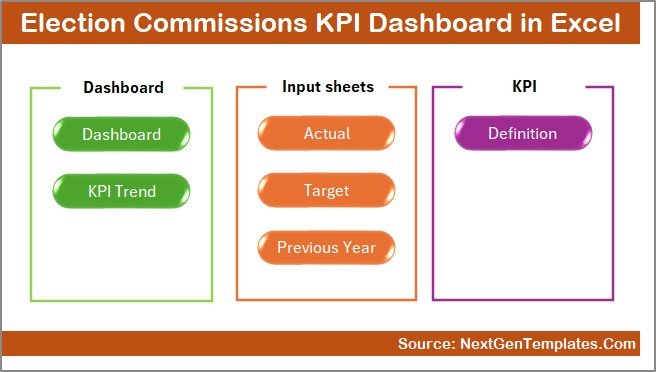
1️⃣ Summary Sheet – Navigation control center with 6 quick-access buttons.
2️⃣ Dashboard Sheet – Main KPI monitoring page showing:
-
MTD Actual, Target, Previous Year
-
YTD Actual, Target, Previous Year
-
Target vs Actual comparison
-
Previous Year vs Current comparison
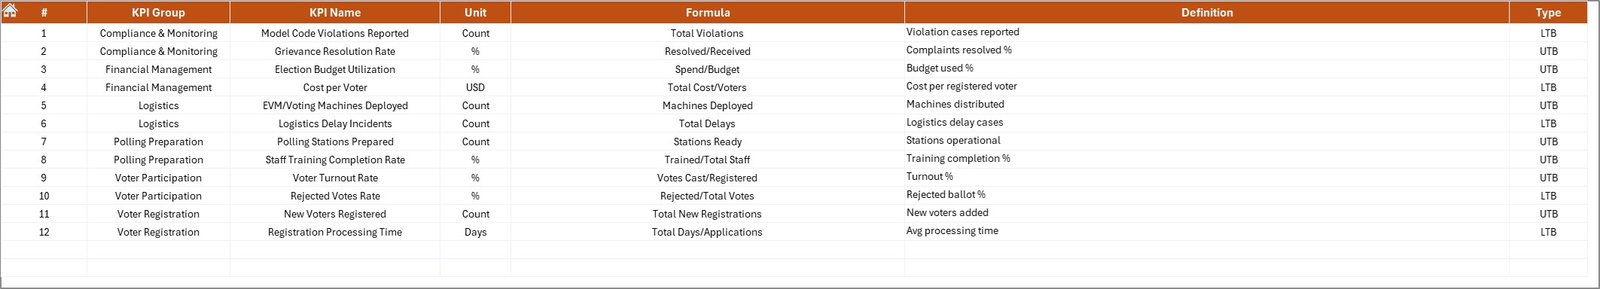
3️⃣ Trend Sheet – Select any KPI (Cell C3) and view:
-
KPI Group
-
Unit & Type (LTB/UTB)
-
Formula & Definition
-
MTD Trend Chart
-
YTD Trend Chart
4️⃣ Actual Numbers Input Sheet – Enter monthly actual data.
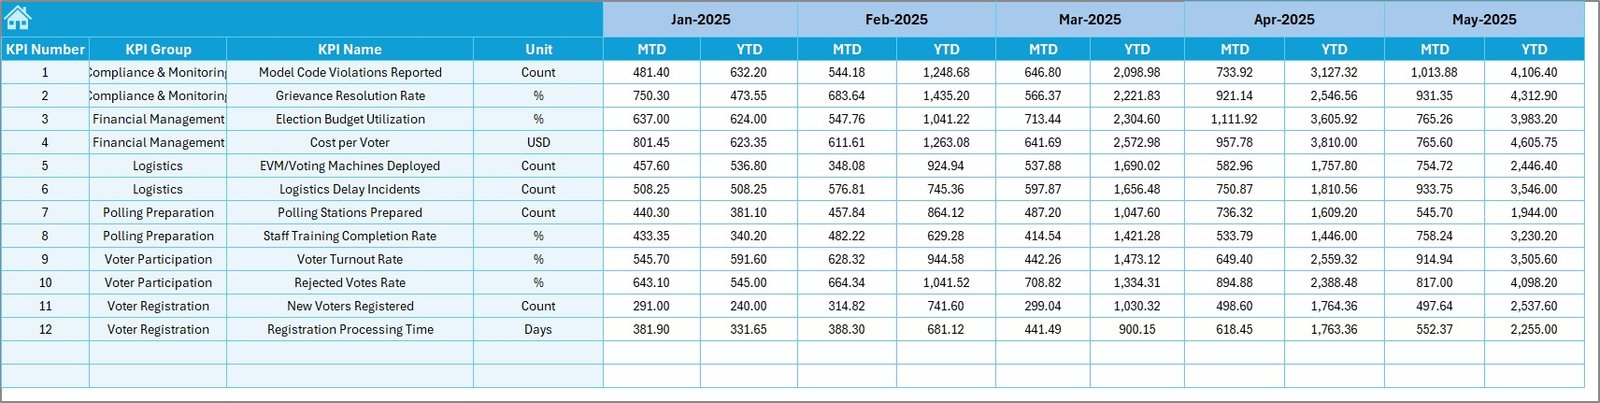
5️⃣ Target Sheet – Define monthly and yearly performance targets.
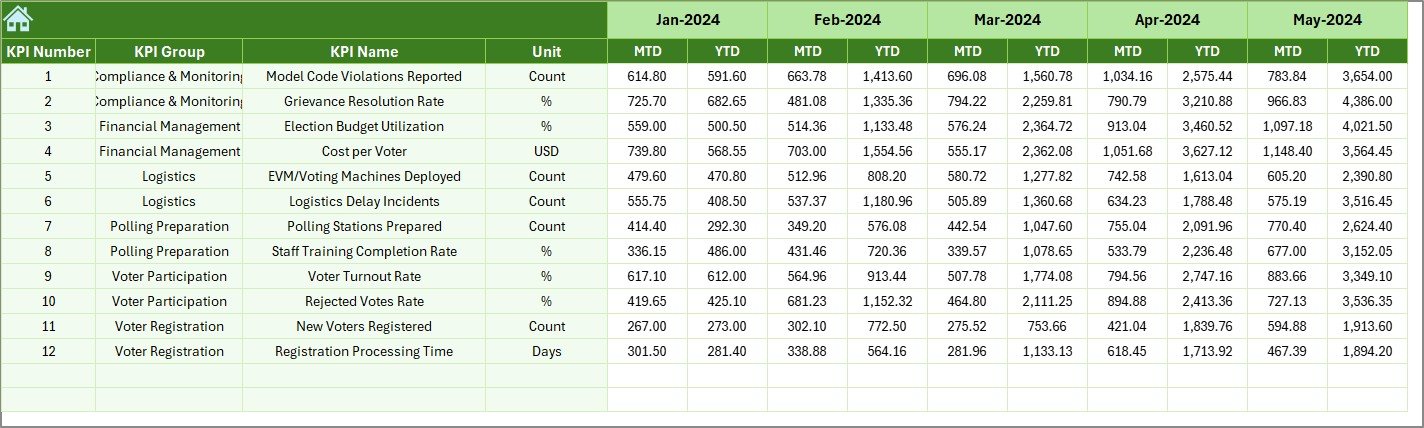
6️⃣ Previous Year Sheet – Store historical data for performance comparison.
7️⃣ KPI Definition Sheet – Document KPI Name, Group, Unit, Formula, and Definition.
Everything is connected. Update once — reflect everywhere.
🧭 How to Use the Election Commissions KPI Dashboard in Excel
Using this dashboard is simple and structured:
-
Open the Excel file.
-
Define KPIs in the KPI Definition sheet.
-
Enter monthly and yearly targets.
-
Input previous year data.
-
Add current actual numbers monthly.
-
Go to the Dashboard sheet.
-
Select a month from cell D3.
-
Review MTD & YTD comparisons instantly.
-
Use the Trend sheet for deep KPI analysis.
No complex formulas to write. No coding required. Just structured monitoring.
🎯 Who Can Benefit from This Election Commissions KPI Dashboard in Excel
🏛️ National Election Commissions – Monitor country-wide performance metrics.
🏢 State & Regional Election Offices – Track local electoral operations efficiently.
📊 Electoral Monitoring Teams – Analyze trends and performance gaps.
💼 Administrative Leadership – Make data-driven decisions using clear visual insights.
📋 Audit & Compliance Departments – Maintain transparency and structured reporting.
Whether you manage a small election office or a large national body, this dashboard adapts to your needs.
This dashboard allows you to track critical KPIs such as:
-
Polling stations prepared on time
-
Staff training completion rate
-
Ballot distribution accuracy
-
Voter turnout percentage
-
Youth participation rate
-
Complaint resolution rate
-
Budget utilization percentage
-
Cost variance
By centralizing monitoring, it reduces reporting delays and improves accountability.
Stop relying on scattered files and manual calculations. Start managing electoral performance with confidence and clarity.
The Election Commissions KPI Dashboard in Excel helps you strengthen transparency, improve operational efficiency, and support data-driven election management.
Click here to read the Detailed blog post
Watch the step-by-step video tutorial: