

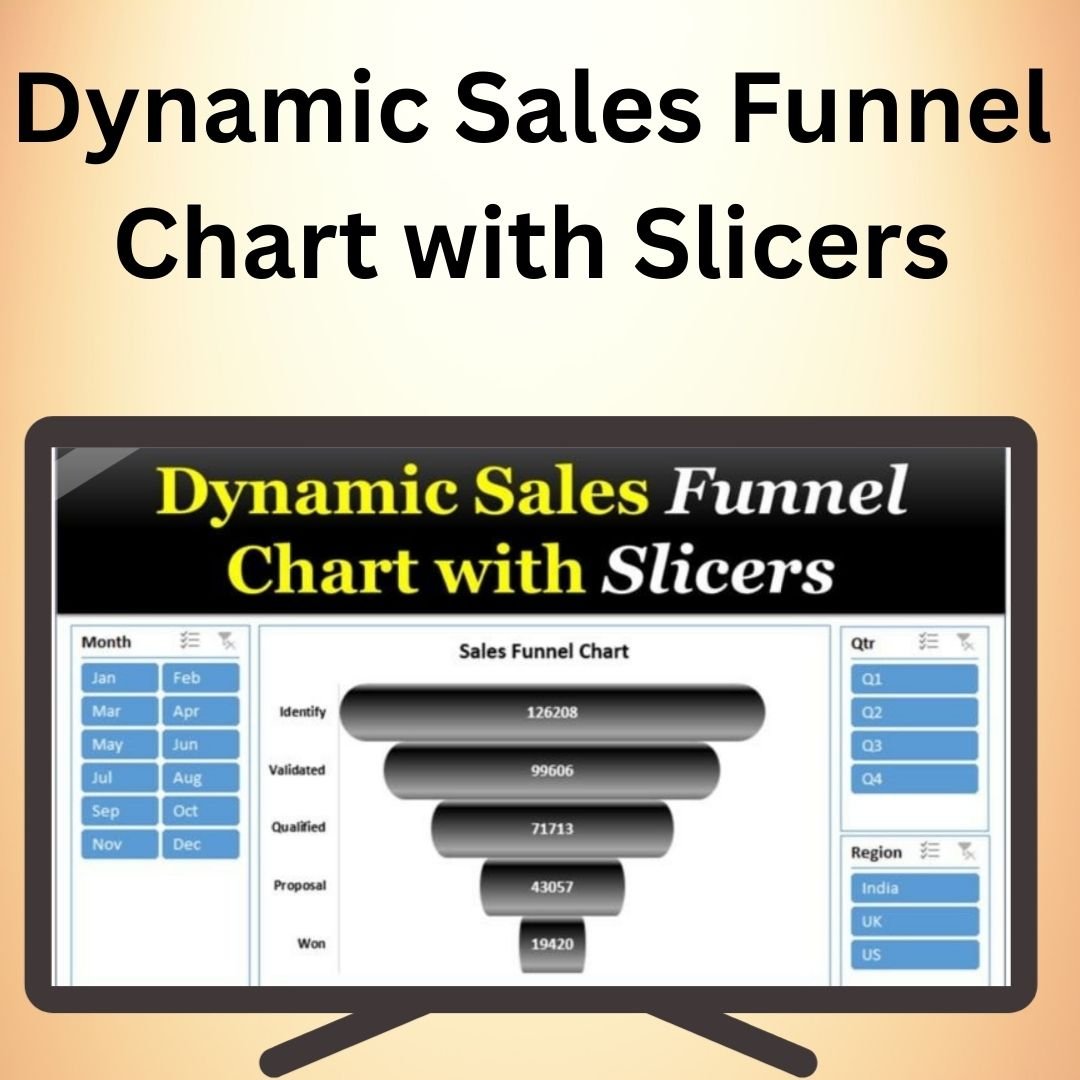

The Dynamic Sales Funnel Chart with Slicers in Excel is an interactive and visually engaging tool designed to help you visualize your sales process from start to finish. This dynamic chart gives you an in-depth look at each stage of your sales funnel, helping you identify bottlenecks, track progress, and make data-driven decisions to optimize your sales pipeline. With the added functionality of slicers, this tool allows you to filter and analyze data in real-time, providing greater flexibility and deeper insights.
The Dynamic Sales Funnel Chart is ideal for sales managers, business analysts, and anyone involved in tracking sales performance. The chart automatically updates as data changes, allowing you to stay up-to-date with your sales figures and assess performance at any given moment. This tool simplifies complex sales data, making it easier to interpret and present in reports or presentations.
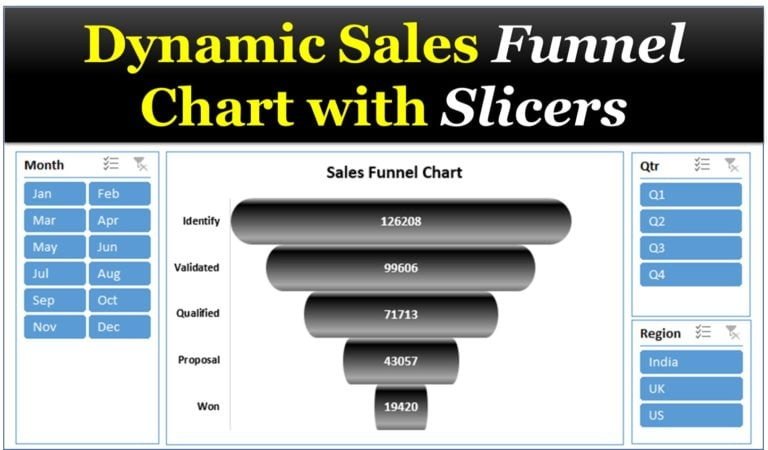
Key Features of the Dynamic Sales Funnel Chart with Slicers in Excel
📌 Interactive Funnel Visualization
The Sales Funnel Chart provides a visual representation of your sales pipeline, allowing you to see how potential leads progress through different stages. With the added slicers, you can easily filter the data to view specific segments, such as by region, sales team, or product type.
🛠 Customizable Slicers
Use slicers to filter and drill down into the data by various categories. This functionality gives you the ability to dynamically adjust the chart’s view, making it ideal for real-time analysis and decision-making. You can slice your data by time periods, regions, or any custom dimension you need to explore.
💡 Real-Time Data Updates
As new data is entered or updated in your Excel sheet, the Dynamic Sales Funnel Chart automatically refreshes to reflect the changes. This ensures that you always have the most accurate, up-to-date information at your fingertips.
🔢 Sales Stage Tracking
The funnel chart clearly illustrates the different stages of your sales process, from lead generation to closing deals. By tracking each stage, you can identify where prospects are dropping off and where to focus your efforts to improve conversions.
🚀 Improved Sales Performance Insights
This chart helps you analyze sales performance by visualizing how leads move through the sales pipeline. By identifying patterns, trends, and problem areas, you can optimize your sales process and increase overall performance.
📊 Customizable Design
You can customize the chart’s design to match your company’s branding or presentation style. Adjust colors, labels, and other design elements to make the chart both functional and visually appealing.
⚙ User-Friendly Interface
Creating and customizing the Dynamic Sales Funnel Chart is easy, even for beginners. With clear instructions and a simple setup, you can integrate this tool into your sales analysis process without the need for advanced Excel skills.
🚀 Why You’ll Love the Dynamic Sales Funnel Chart with Slicers in Excel
✅ Interactive Filtering – Use slicers to filter and analyze data dynamically. ✅ Real-Time Data Updates – Automatically refreshes as your data changes. ✅ Customizable Design – Tailor the chart to suit your specific needs and branding. ✅ Sales Stage Tracking – Track leads as they progress through your sales funnel. ✅ Improved Decision-Making – Gain valuable insights into your sales performance.
📂 What’s Inside the Dynamic Sales Funnel Chart with Slicers in Excel?
- Sales Funnel Visualization: A dynamic chart representing your sales pipeline.
- Customizable Slicers: Filter data by different dimensions for in-depth analysis.
- Real-Time Data Updates: The chart automatically updates as your data changes.
- Clear Setup Instructions: Step-by-step guide to create and use the funnel chart.
🔍 How to Use the Dynamic Sales Funnel Chart with Slicers in Excel
1️⃣ Download the Template – Instant access to the Excel file upon purchase. 2️⃣ Input Your Sales Data – Enter your sales data into the provided fields. 3️⃣ Customize Slicers – Use slicers to filter data by region, time period, or other dimensions. 4️⃣ Visualize and Track – Watch your sales data come to life with the interactive funnel chart. 5️⃣ Analyze and Present – Use the chart for deeper insights and more informed decision-making.
🎯 Who Can Benefit from the Dynamic Sales Funnel Chart with Slicers in Excel? 🔹 Sales Managers
🔹 Business Analysts
🔹 Marketing Teams
🔹 Project Managers
🔹 Data Analysts
🔹 Anyone looking to visualize and optimize their sales process
Improve your sales tracking and performance analysis with the Dynamic Sales Funnel Chart with Slicers in Excel. This easy-to-use tool helps you visualize your sales pipeline and make informed decisions that drive success.
Click here to read the Detailed blog post
https://www.pk-anexcelexpert.com/dynamic-sales-funnel-chart-with-slicers/
Visit our YouTube channel to learn step-by-step video tutorials
Watch the step-by-step video tutorial:
Compatibility and Requirements
- Works in Microsoft Excel desktop (Excel 2016 or later, or Microsoft 365).
- The chart is filtered with Excel slicers. Microsoft explains them in Use slicers to filter data.
Frequently Asked Questions
What does the Dynamic Sales Funnel Chart show?
It shows each stage of your sales process, from lead generation to closing deals, so you can see where prospects drop off.
What can I filter with the slicers?
You can filter by region, sales team, product type, time period or any other dimension in your data.
Does the chart update when I change the data?
Yes. The funnel refreshes as you enter or update sales data.
Can I change the colors and labels?
Yes. You can adjust colors, labels and other design elements to match your branding.
Is setup help included?
Yes. The file comes with step-by-step setup instructions for building and using the funnel chart.
Related Sales Funnel and Slicer Chart Templates
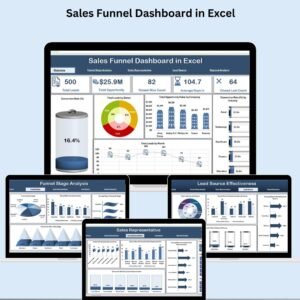
- Sales Funnel Dashboard in Excel: a full dashboard built around the sales funnel
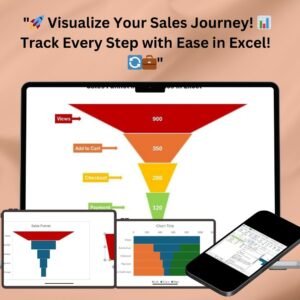
- Sales funnel infographic chart in Excel: an infographic style funnel chart
- Sales Funnel Report in Excel: a printable funnel report
- Excel Magic: Connect Charts & Slicers in Seconds: link charts and slicers quickly
- Data Analyst’s Chart & Visualization Pack: 10 chart templates for Excel and Google Sheets
Browse all Excel charts and visualizations or the Excel sales and marketing templates.













Reviews
There are no reviews yet.