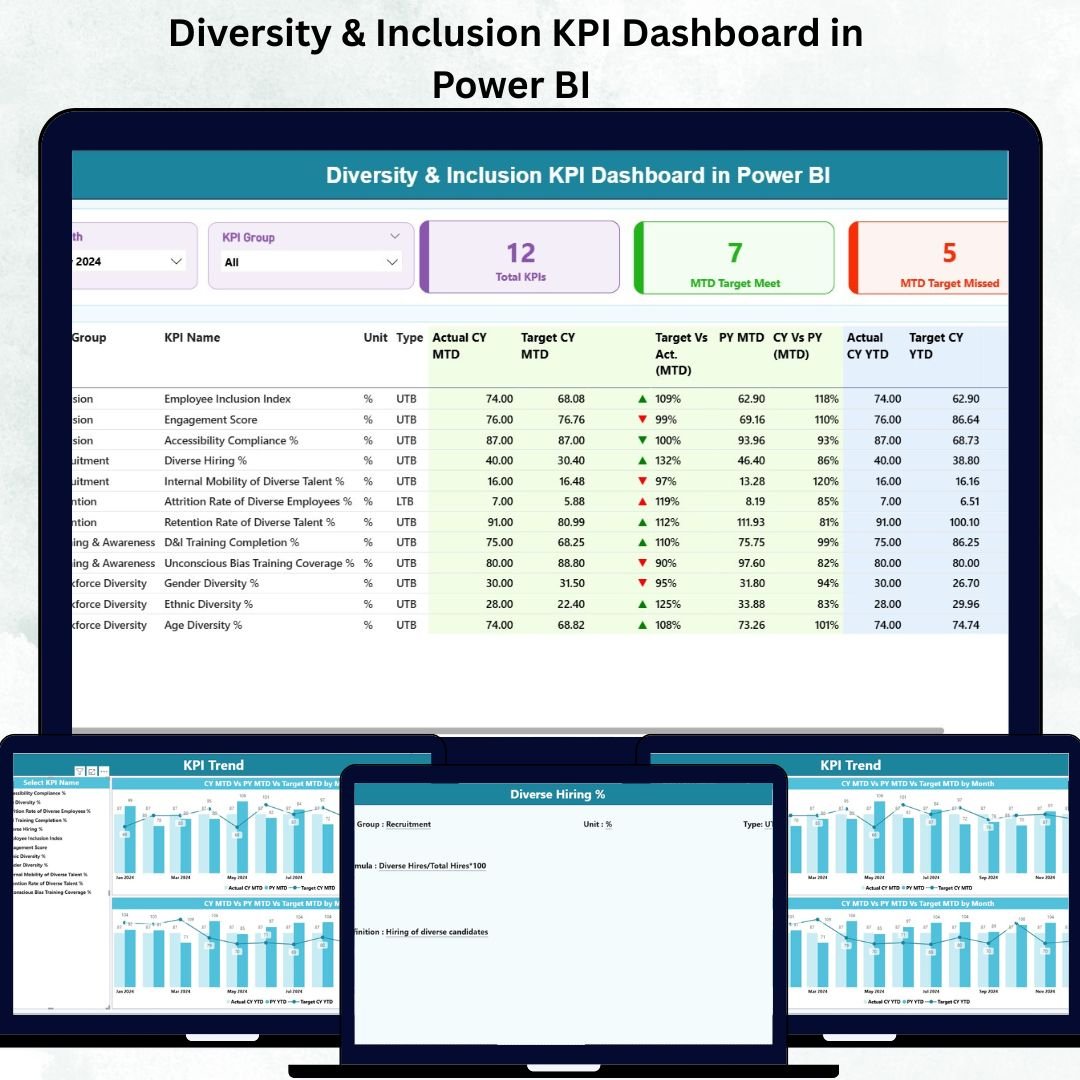
In today’s inclusive and competitive workplace, diversity isn’t just a moral responsibility — it’s a strategic advantage. Organizations that prioritize diversity and inclusion (D&I) experience higher innovation, improved collaboration, and stronger financial performance. But to manage D&I effectively, you need more than intent — you need data-driven insights.
That’s where the Diversity & Inclusion KPI Dashboard in Power BI comes in. 🎯 This ready-to-use Power BI dashboard helps HR professionals, DEI managers, and executives monitor workforce diversity metrics, measure progress, and make informed decisions — all from a single interactive platform.
Built on Excel data, this dashboard transforms complex HR numbers into easy-to-understand visuals. Whether you want to analyze gender ratios, track minority representation, review pay equity, or assess hiring trends, this solution gives you the clarity to act confidently and inclusively.
⚙️ Key Features of the Diversity & Inclusion KPI Dashboard in Power BI
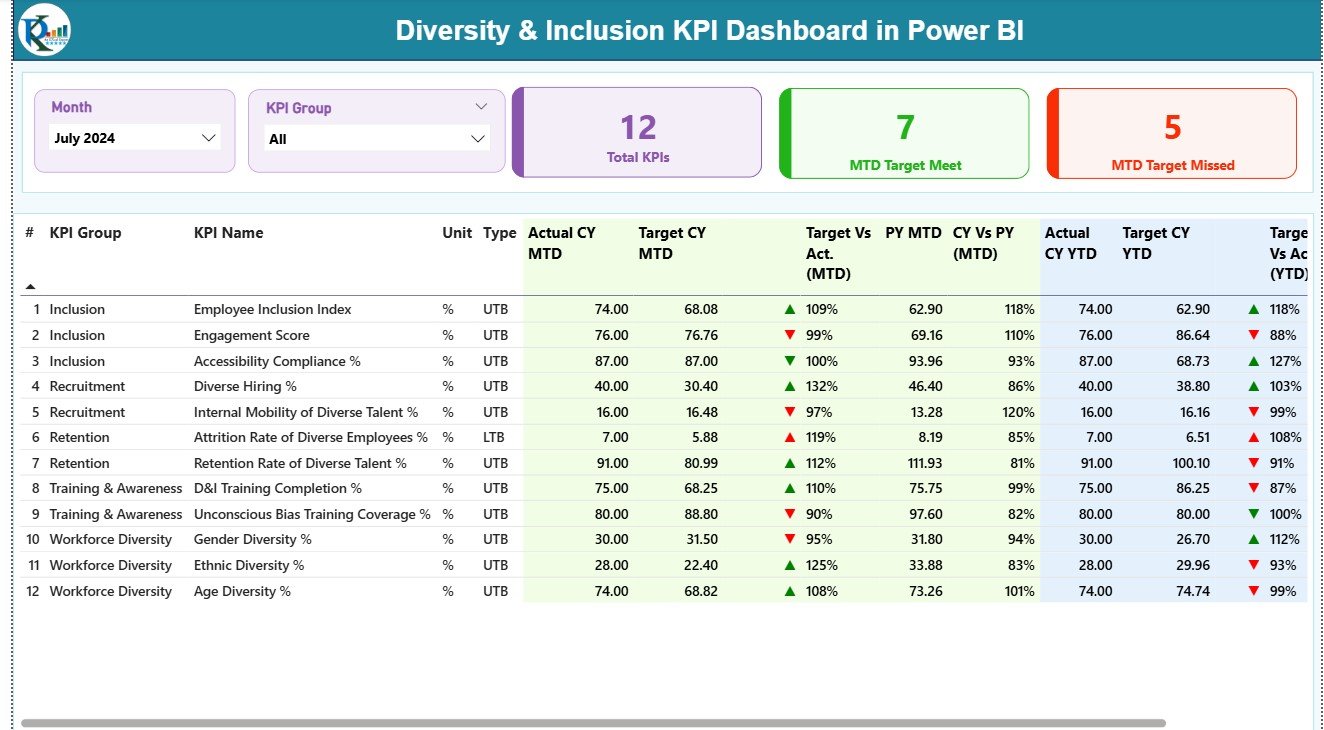
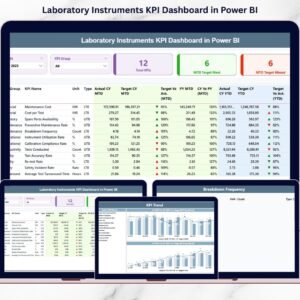
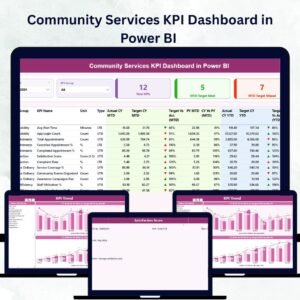
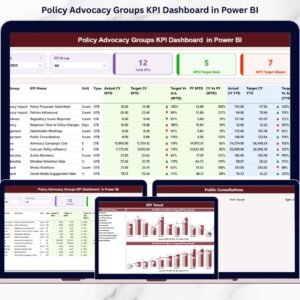
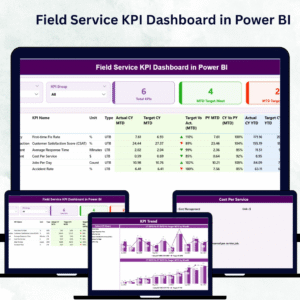
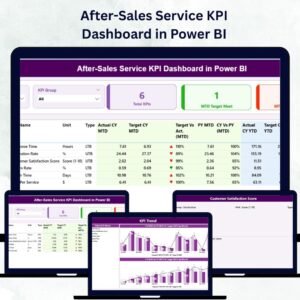
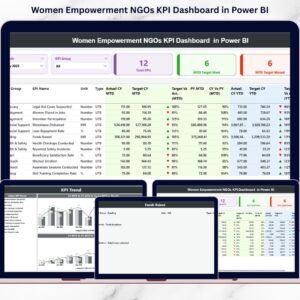
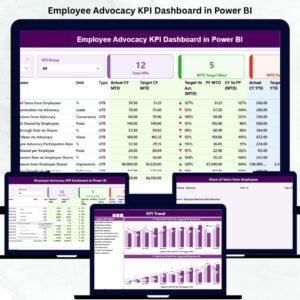
📊 Interactive KPI Summary Page – Get a complete snapshot of key diversity and inclusion metrics such as total KPIs, target achievements, and missed goals — all in one view.
📈 Dynamic Filtering Options – Use Month and KPI Group slicers to instantly drill down into any time period or performance area.
🔍 Real-Time Actual vs Target Comparison – Evaluate MTD (Month-to-Date) and YTD (Year-to-Date) performance with red and green arrows highlighting progress.
📉 Previous Year Benchmarking – Measure whether performance improved or declined compared to the previous year.
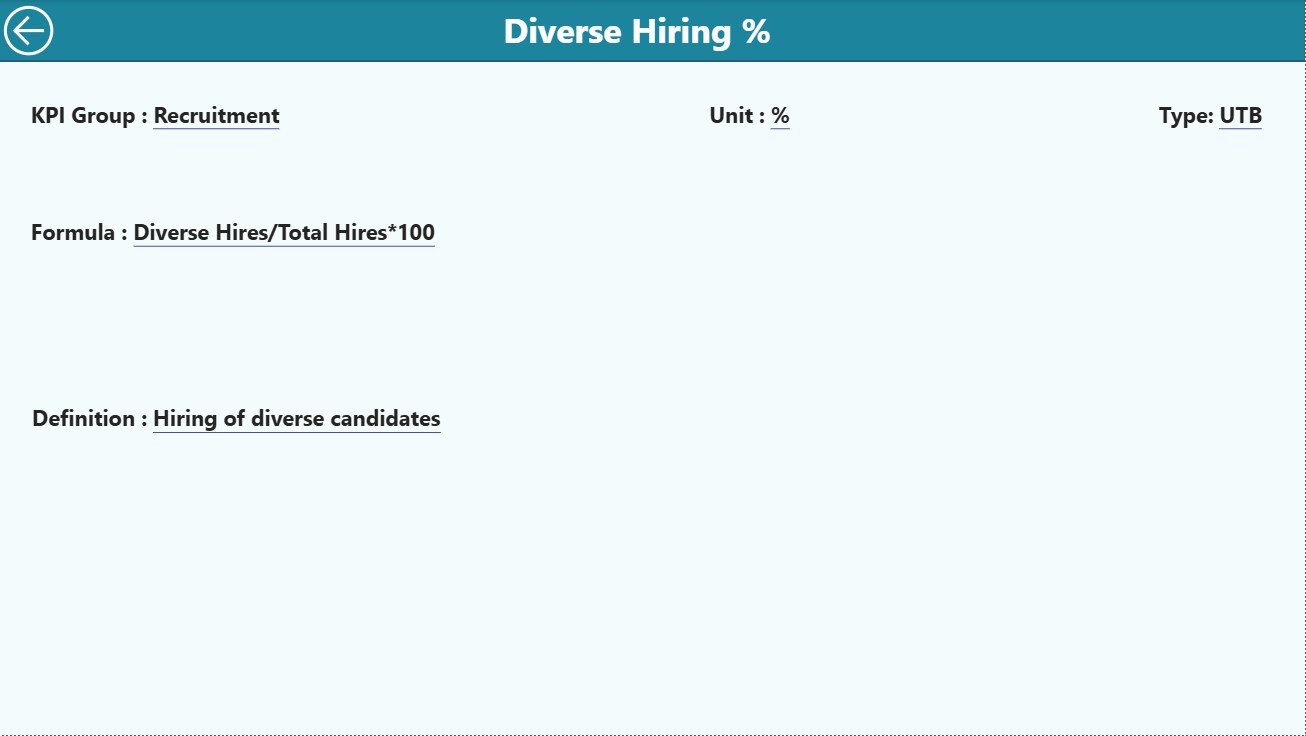
📄 KPI Definition Page – Understand every metric in detail — from its formula to whether it’s Upper the Better (UTB) or Lower the Better (LTB).
💾 Excel Integration – Easy data management using three structured Excel sheets — Input Actual, Input Target, and KPI_Definition.
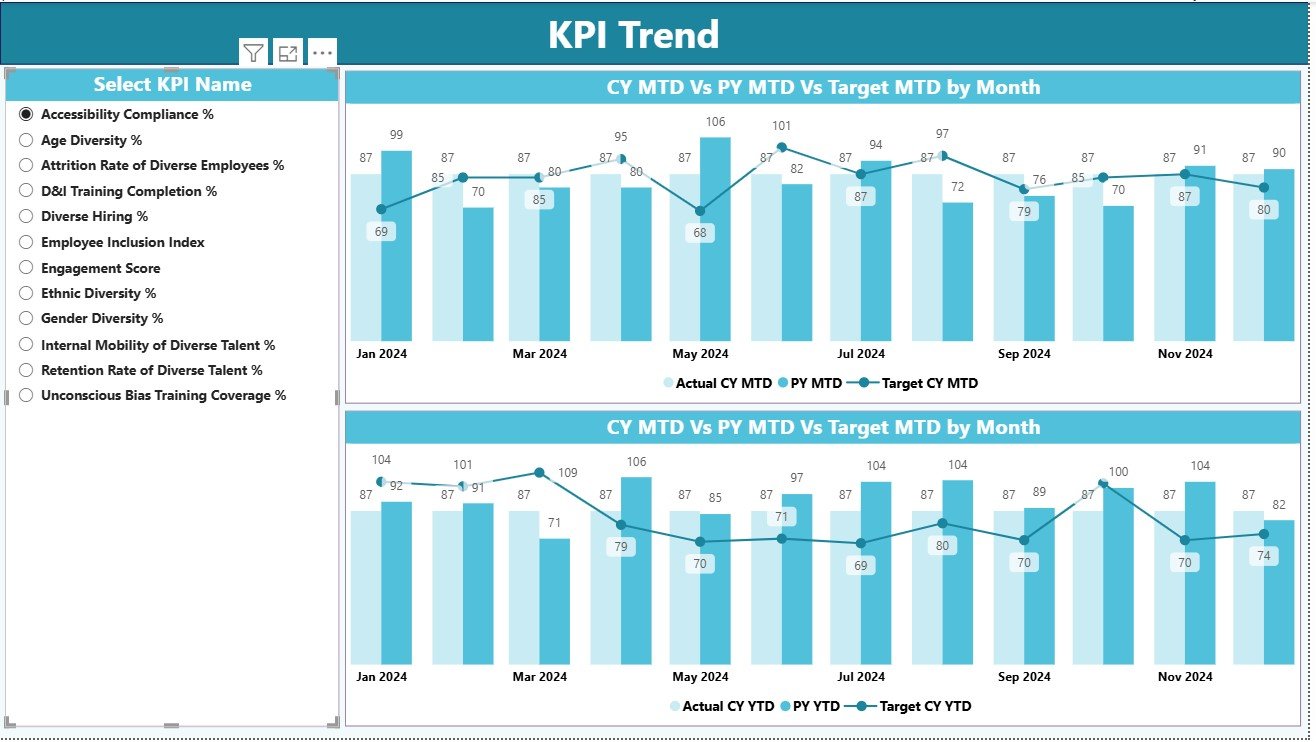
📊 Trend Visualization Page – Analyze long-term progress for specific KPIs using combo charts for Actual, Target, and Previous Year data.
🚀 Drill-Through Analysis – Click on any KPI to explore its calculation and meaning directly within Power BI.
🧠 User-Friendly Interface – Designed for all skill levels — no coding or advanced Power BI knowledge required.
📂 What’s Inside the Diversity & Inclusion KPI Dashboard in Power BI
🌈 1. Summary Page:
Your one-stop control center. It features KPI cards for key metrics, performance tables, slicers for filtering by Month and KPI Group, and comparison visuals for Actual vs Target vs Previous Year.
📉 2. KPI Trend Page:
Dive deeper into performance movement. Use the KPI slicer to analyze MTD and YTD trends via interactive combo charts that reveal fluctuations and progress patterns.
📘 3. KPI Definition Page:
Access all KPI details in one place — including Name, Formula, Definition, and Type (UTB/LTB). This ensures every team speaks the same “data language.”
💾 Excel Data Source:
Easily maintain your dataset with just three structured worksheets — Input Actual, Input Target, and KPI_Definition. Update Excel, refresh Power BI, and see your visuals update instantly.
This simple yet powerful structure ensures your organization can track and enhance diversity efforts without additional tools or complexity.
🧭 How to Use the Diversity & Inclusion KPI Dashboard in Power BI
1️⃣ Prepare Excel Data: Input monthly Actual and Target values in the Excel sheets.
2️⃣ Open Power BI File: Load the Excel file into Power BI and refresh.
3️⃣ Explore KPIs: Use slicers to filter by Month, Year, or KPI Category.
4️⃣ Drill Into Metrics: Click any KPI to view its definition, formula, and historical trends.
5️⃣ Share Insights: Publish to Power BI Service and share live dashboards with HR and leadership teams.
💡 Pro Tip: Schedule automatic refreshes in Power BI to ensure your diversity data is always up to date.
👥 Who Can Benefit from This Dashboard
👩💼 HR Leaders: Monitor workforce composition, pay parity, and diversity hiring trends.
🌎 DEI Managers: Evaluate the impact of diversity initiatives and identify gaps.
📊 Executives & Board Members: Gain real-time visibility into diversity progress aligned with strategic goals.
🏢 Talent & Recruitment Teams: Analyze recruitment patterns to build more inclusive hiring pipelines.
📈 Analytics Professionals: Integrate this dashboard with HR systems or surveys for advanced reporting.
This tool empowers every stakeholder to promote inclusion with data-backed confidence and accountability.


Reviews
There are no reviews yet.