


Diversity and Inclusion (D&I) are not just corporate buzzwords—they are the backbone of innovation, trust, and long-term organizational growth. Diversity & Inclusion KPI Dashboard in Excel Companies that actively monitor and improve their D&I practices create stronger, more resilient workplaces where every employee feels valued. But the challenge is this: how do you track progress effectively?
That’s exactly where our Diversity & Inclusion KPI Dashboard in Excel comes in. This ready-to-use tool centralizes all your D&I metrics, making it easier for HR managers, leaders, and executives to track progress, analyze trends, and take actionable steps toward an inclusive culture.
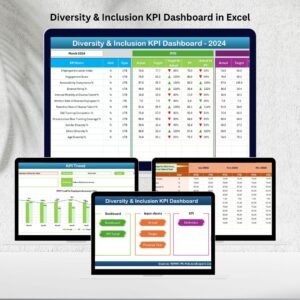
✨ Key Features of Diversity & Inclusion KPI Dashboard in Excel
-
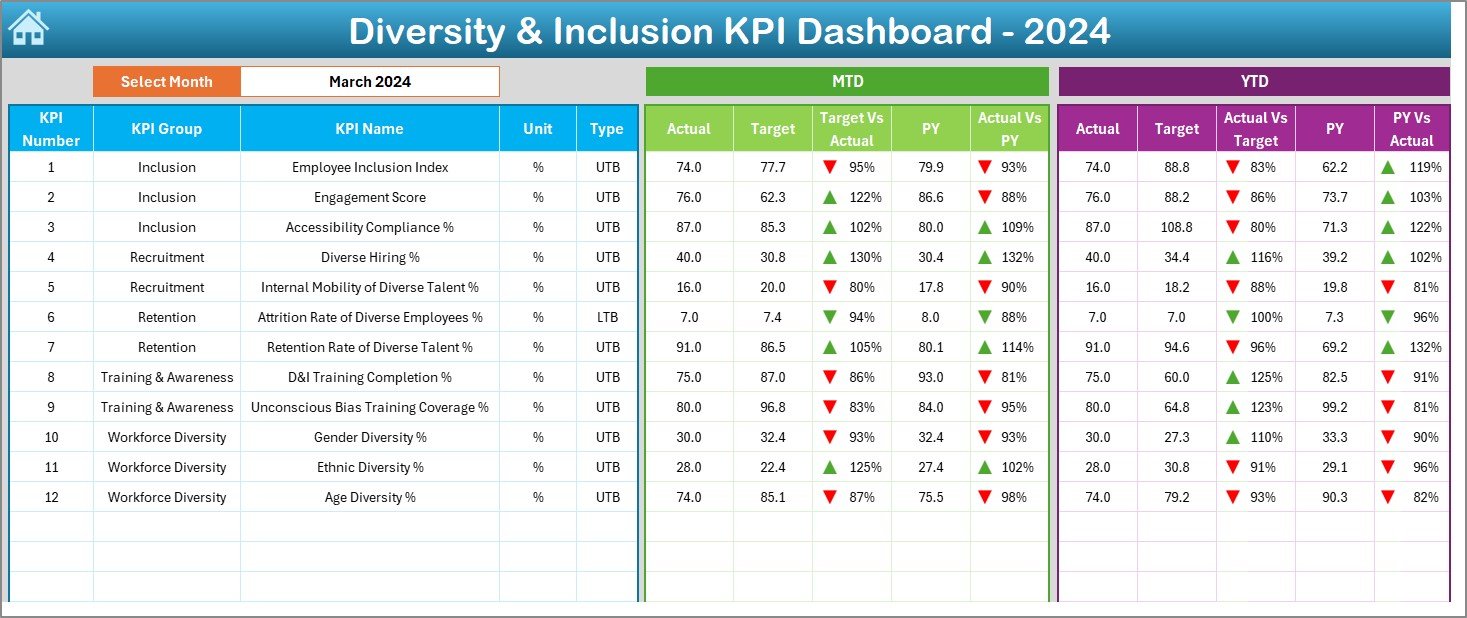
📊 Comprehensive Dashboard: Track Month-to-Date (MTD) and Year-to-Date (YTD) progress with dynamic comparisons of Actual vs Target and Previous Year vs Actual.
-
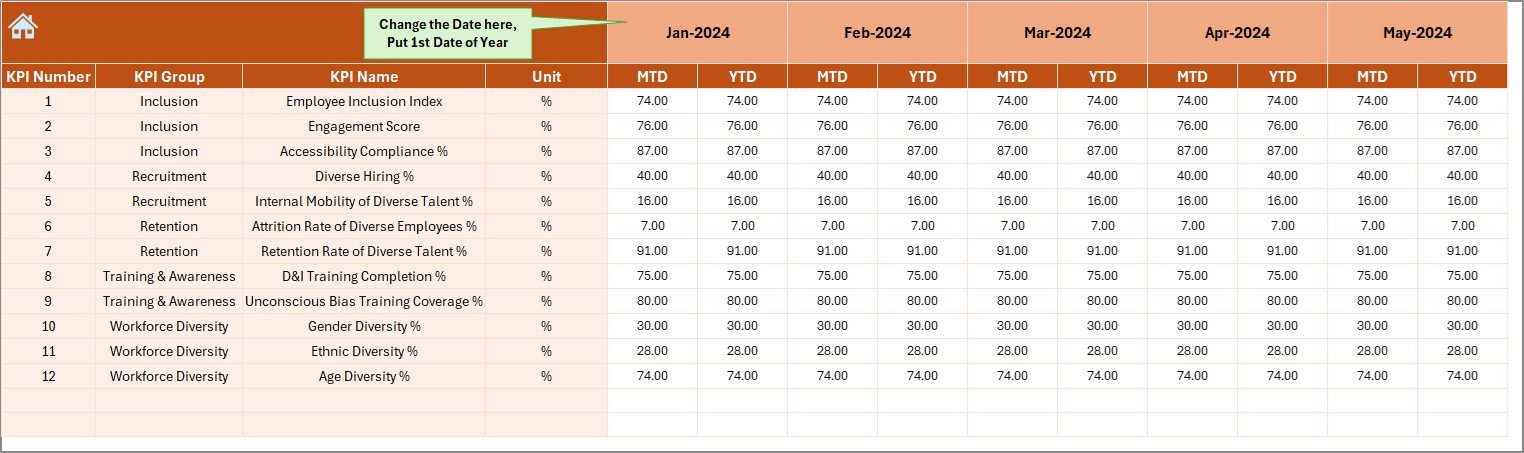
🎯 Target Tracking: Set monthly and yearly goals and measure progress against them with clarity.
-
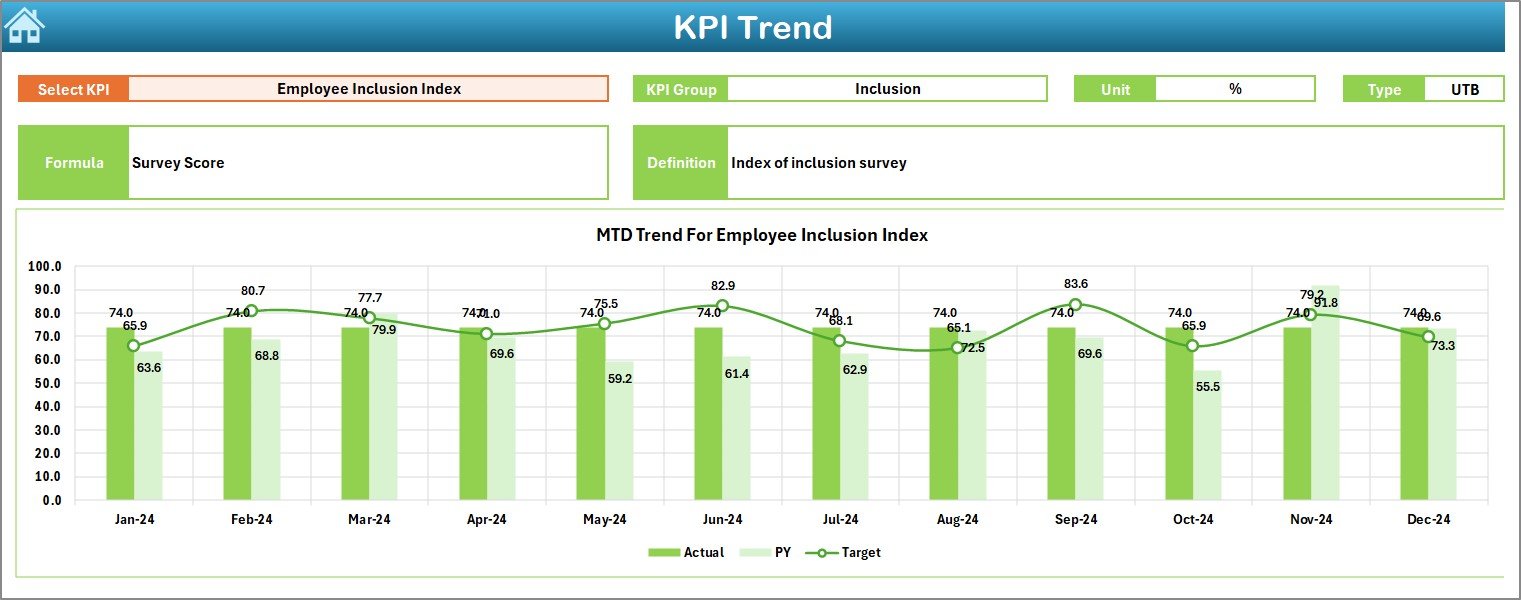
📈 KPI Trends: Identify long-term patterns in diversity metrics using interactive charts and drop-down selections.
-
📝 Data Input Sheets: Easy-to-update input fields for actual numbers, targets, and previous year data.
-
🔄 Automated Calculations: Built-in formulas that instantly update all visuals and performance indicators.
-
🗂️ 7 Structured Worksheets: Organized into Home, Dashboard, KPI Trend, Actual Numbers Input, Target, Previous Year, and KPI Definition sheets for smooth navigation.
-
✅ Customizable KPIs: Add or modify KPIs to fit your company’s unique diversity goals.
-
💻 Excel-Based Tool: No extra software costs—built on the platform professionals already know.
📂 What’s Inside the Diversity & Inclusion KPI Dashboard
When you download this product, you’ll get a complete Excel file with:
-
Home Sheet – Quick navigation to all other sections.
-
Dashboard Sheet – Main performance view with MTD & YTD numbers, targets, and conditional formatting.
-
KPI Trend Sheet – Interactive analysis for each KPI.
-
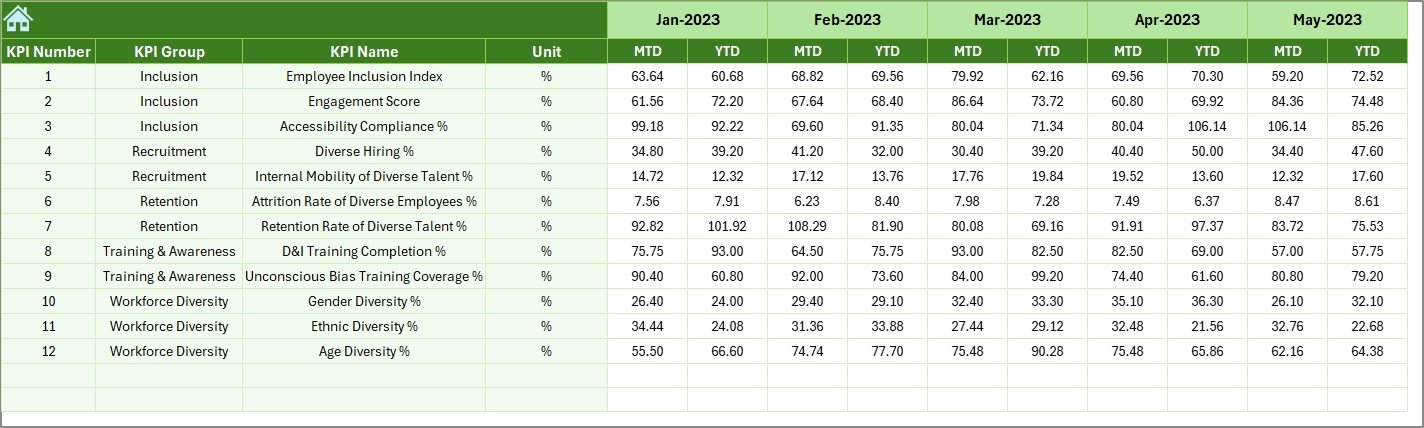
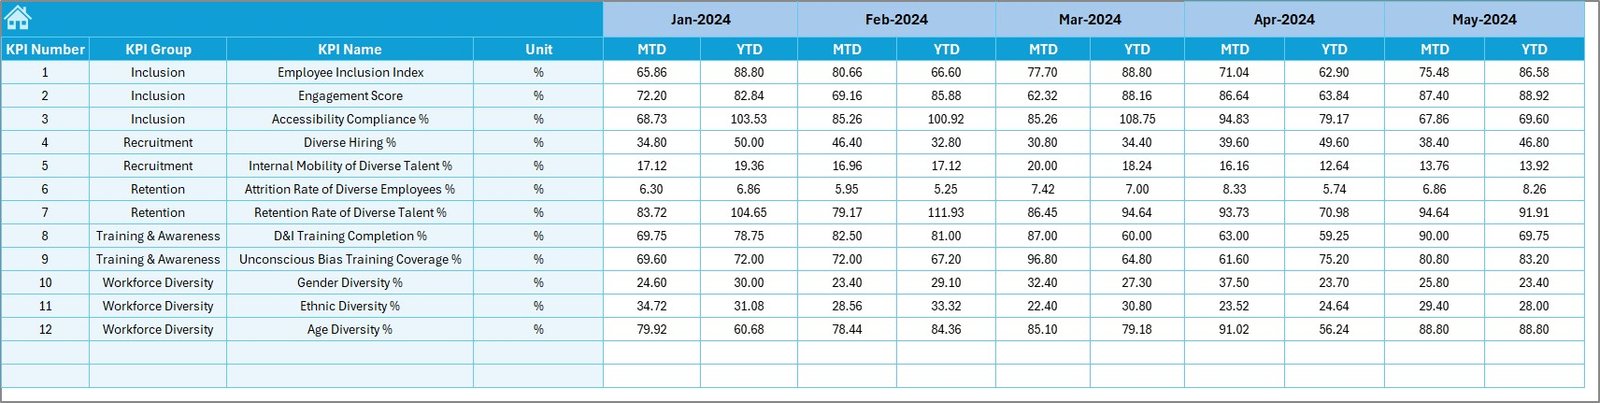
Actual Numbers Input Sheet – Enter your monthly workforce data.
-
Target Sheet – Define and track monthly & yearly goals.
-
Previous Year Numbers Sheet – Compare progress year-on-year.
-
KPI Definition Sheet – Clear definitions, formulas, and measurement logic for every KPI.
🛠️ How to Use the Diversity & Inclusion KPI Dashboard
-
Download & Open the Excel file.
-
Customize KPIs by editing the KPI Definition Sheet to match your organizational priorities.
-
Set Targets for each month and year on the Target Sheet.
-
Input Actual Data into the Actual Numbers Input Sheet monthly.
-
Review Dashboard & Trends to analyze patterns and identify gaps.
-
Take Action by implementing policies, training, or initiatives based on insights.
With just a few clicks, you’ll transform raw data into actionable insights that promote fairness and equality across your organization.
👥 Who Can Benefit from This Product
-
HR Managers: Monitor recruitment diversity, retention, and promotions with ease.
-
Business Leaders: Align diversity goals with strategic objectives.
-
Employees: Gain transparency and confidence in company practices.
-
Small Businesses: Affordable and effective way to promote inclusiveness.
-
Stakeholders & Investors: Demonstrate accountability and progress with clear reports.
Whether you’re running a startup or a large corporation, this tool empowers you to make data-driven decisions that strengthen your organization’s reputation and culture.
🔗 Click here to read the Detailed Blog Post
📺 Visit our YouTube channel to learn step-by-step video tutorials: Youtube.com/@PKAnExcelExpert
Watch the step-by-step video tutorial:


Reviews
There are no reviews yet.