Building a workplace where every employee feels valued, respected, and empowered starts with understanding your workforce data clearly. But most organizations still rely on scattered spreadsheets and manual reports that fail to show the real picture.
The Diversity & Inclusion Dashboard in Power BI changes everything.
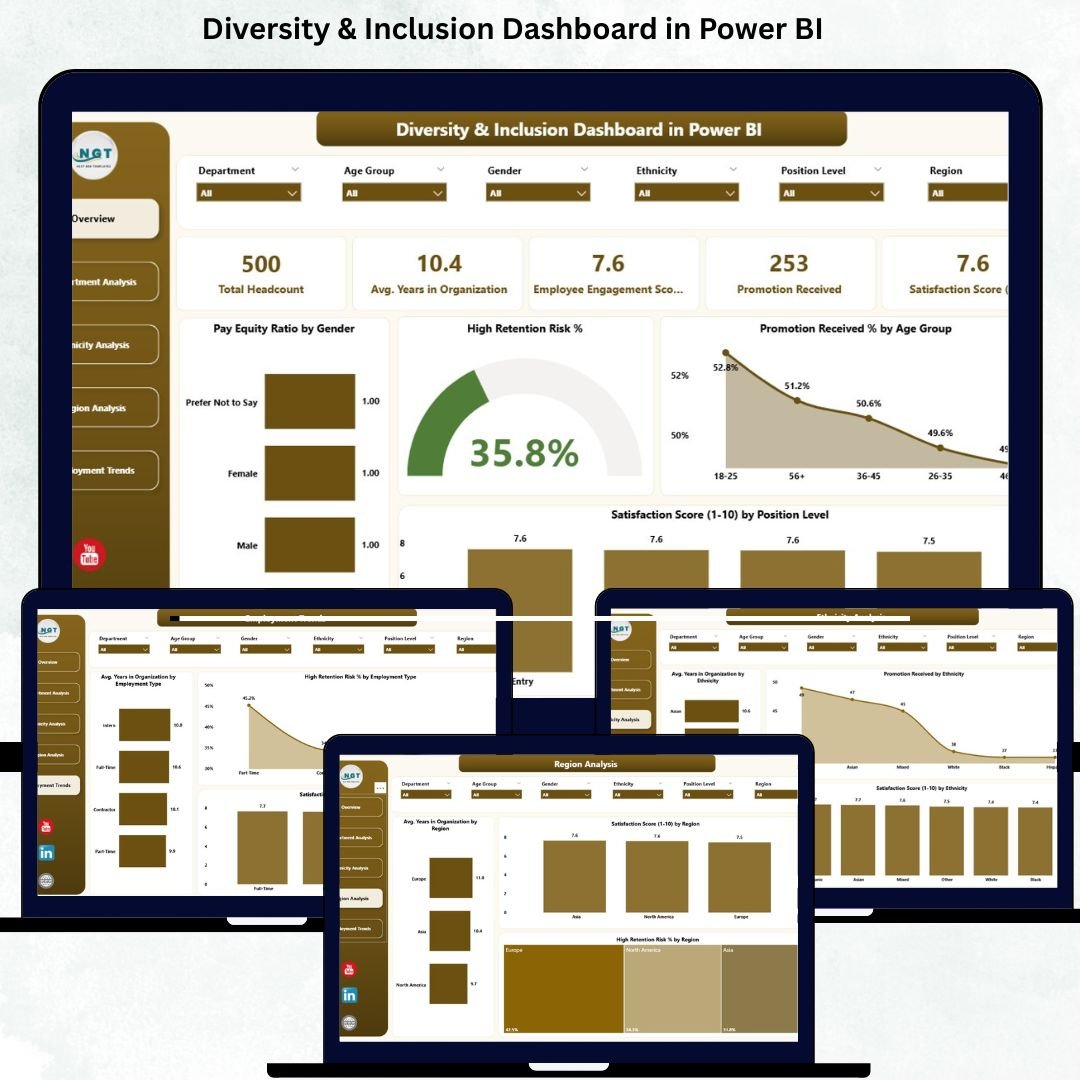
This ready-to-use, interactive dashboard brings all your important D&I insights into one powerful platform — helping HR teams, DEI leaders, and business executives track fairness, representation, retention, pay equity, and satisfaction through easy-to-understand visuals.
If your organization is serious about building a diverse, inclusive, and equitable workplace, this dashboard becomes your most important data companion.
✨ Key Features of the Diversity & Inclusion Dashboard in Power BI
⭐ 1️⃣ Overview Page — Your Main Diversity Snapshot
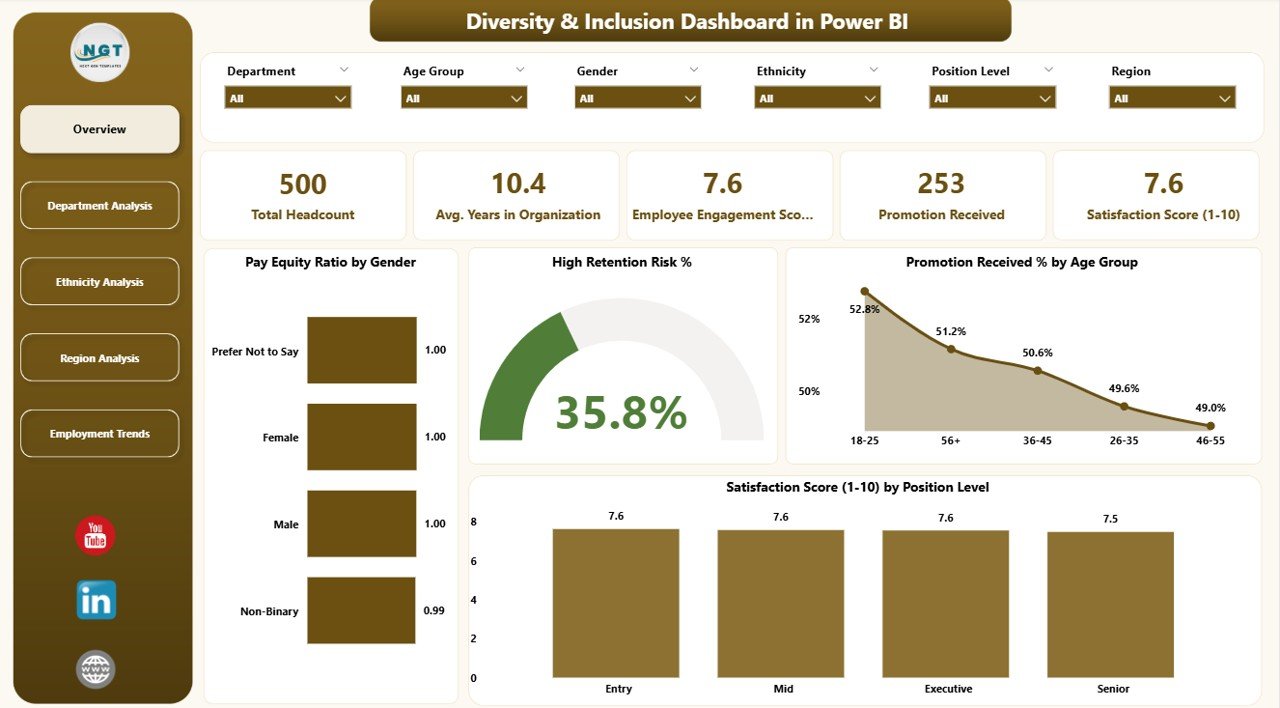
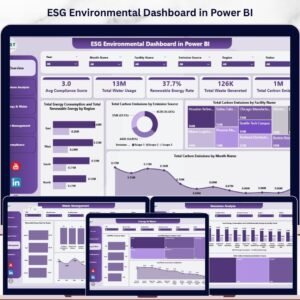
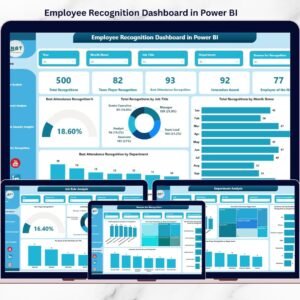
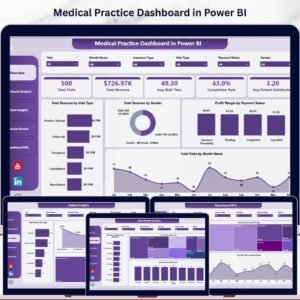
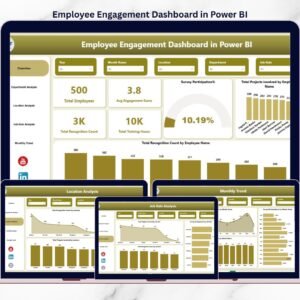
The Overview Page acts as the central hub of the dashboard. It summarizes your organization’s most important D&I indicators through:
-
🔹 5 KPI Cards showing top metrics
-
🔹 Dynamic slicers for easy filtering
-
🔹 4 powerful charts, including:
-
Pay Equity Ratio by Gender
-
High Retention Risk %
-
Promotion Received % by Age Group
-
Satisfaction Score by Position Level
-
This page highlights workforce health instantly — helping leaders detect gender pay gaps, identify promotion inequalities, and understand retention risk across different employee groups.
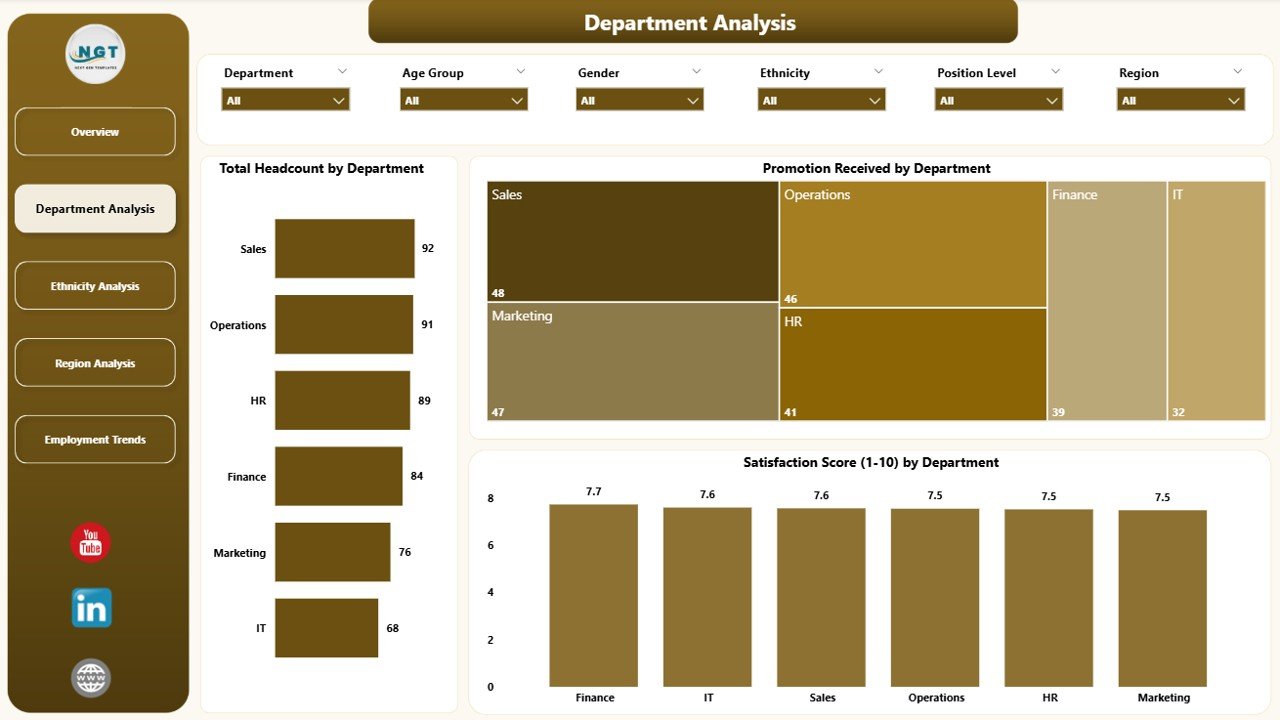
⭐ 2️⃣ Department Analysis Page — Understand Team-Level Insights
This page dives deeper into departmental patterns and inclusivity gaps.
You’ll find:
-
Total Headcount by Department
-
Promotion Received by Department
-
Satisfaction Score by Department
HR teams and department heads can easily identify which teams show strong engagement and which require support, development, culture changes, or leadership improvements.
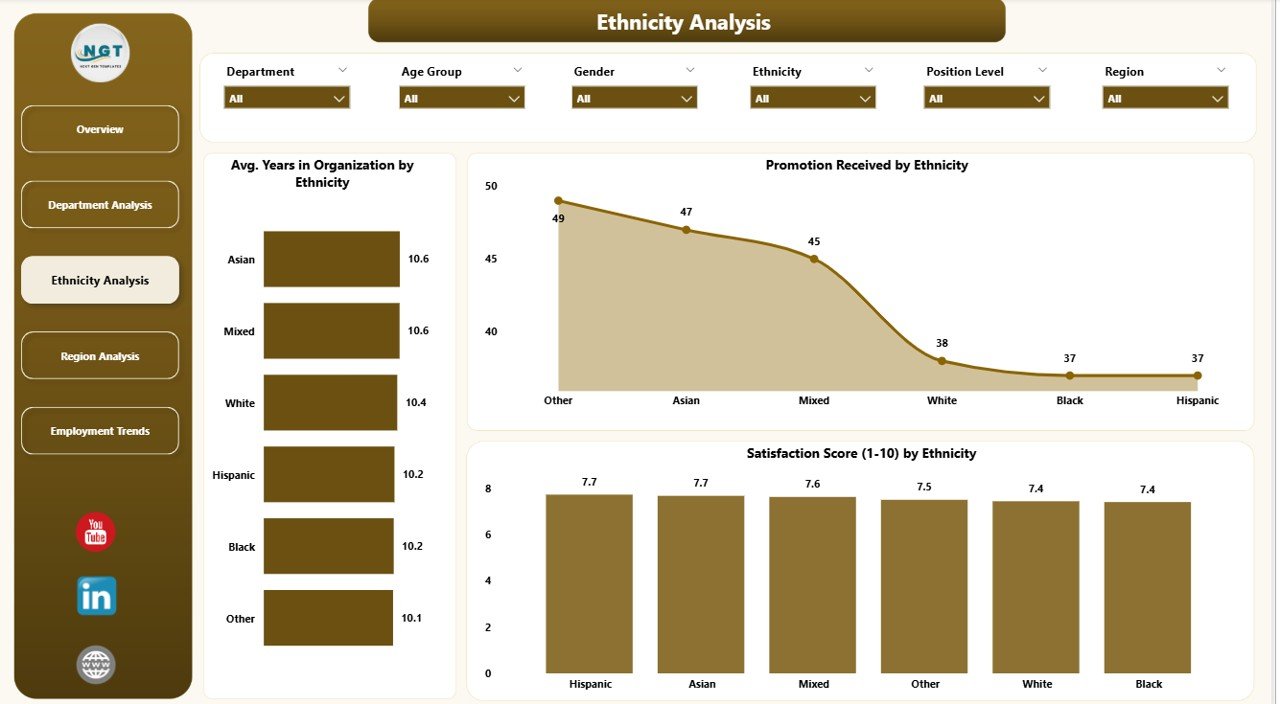
⭐ 3️⃣ Ethnicity Analysis Page — Track Representation & Fairness
Diversity is incomplete without understanding ethnic representation.
This page showcases:
-
Avg. Years in Organization by Ethnicity
-
Promotion Received by Ethnicity
-
Satisfaction Score by Ethnicity
With these insights, organizations can detect blind spots in engagement, retention, and career-growth opportunities across different ethnic groups.
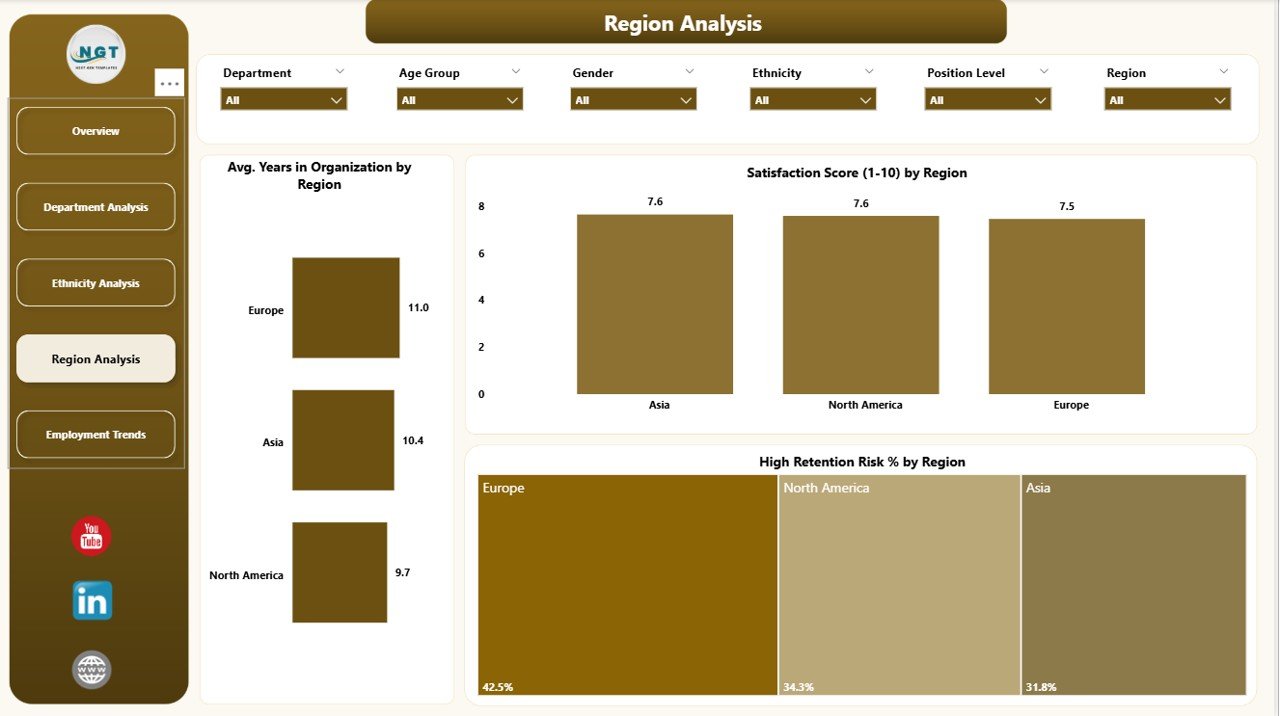
⭐ 4️⃣ Region Analysis Page — Location-Based Inclusion Trends
Companies with multiple offices or regions often experience different cultural, operational, and engagement patterns.
This page includes:
-
Avg. Years in Organization by Region
-
Satisfaction Score by Region
-
High Retention Risk % by Region
It helps leadership identify locations that need policy improvements, culture-building programs, or stronger communication efforts.
⭐ 5️⃣
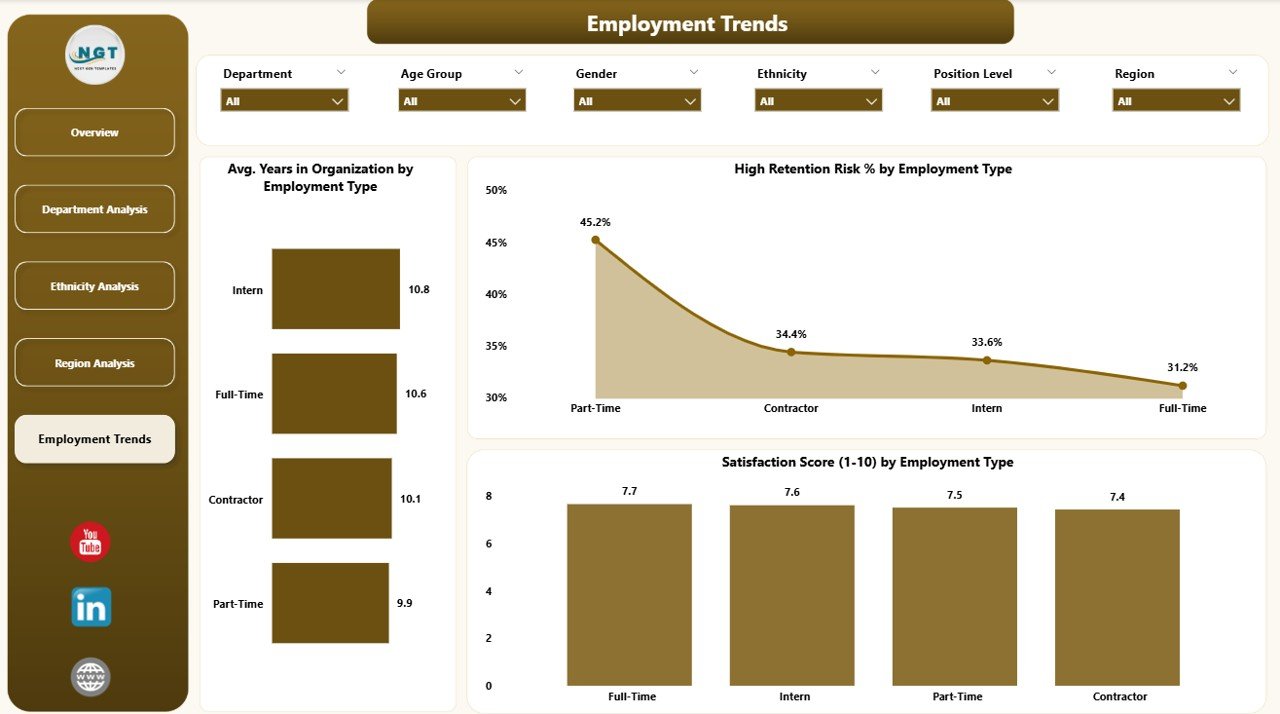
Employment Trends Page— Monitor Progress Over Time
This page helps you track long-term changes in inclusion and diversity indicators.
You’ll see:
-
Avg. Years in Organization by Employee Type
-
Satisfaction Score by Employee Type
-
High Retention Risk % by Employee Type
If your organization introduces new D&I policies, training, or initiatives, this page shows whether those actions are actually driving positive results.
🌟 What Makes This Dashboard Better?
The Diversity & Inclusion Dashboard in Power BI is not just visual — it’s strategic. Using automation, real-time refresh, and interactive drill-downs, it gives you:
-
✔ Accurate, data-driven insights
-
✔ Instant filtering and comparisons
-
✔ Easy internal reporting
-
✔ Secure sharing with leadership
-
✔ Clear visualization with no manual effort
Instead of spending hours creating reports, you get automatic performance tracking in seconds.
🎯 Advantages of Using the D&I Dashboard
-
🔍 Workforce Transparency — See representation, satisfaction, and pay trends clearly.
-
⚖️ Identify Inequalities Early — Track promotion fairness, pay equity, and retention gaps.
-
🧠 Stronger Leadership Decisions — Data helps eliminate bias in decision-making.
-
💬 Higher Employee Engagement — People feel valued when inclusion is measured and improved.
-
🛡 Better Retention — Spot high-risk groups before churn happens.
-
🌱 Cultural Improvement — Track progress of D&I initiatives continuously.
-
📈 Policy Effectiveness — Understand what works and what needs refinement.
🧠 How to Use the Dashboard Effectively
-
Start with the Overview Page to get instant insights.
-
Use slicers to drill deeper into department, region, or age-group data.
-
Compare trends monthly to track improvement.
-
Review satisfaction and retention together for culture insights.
-
Use ethnicity, gender, and promotion charts to identify fairness issues.
🧩 Best Practices
-
Keep HR data clean and updated.
-
Use consistent definitions for metrics like retention or satisfaction.
-
Review analytics monthly.
-
Share department-level insights for targeted actions.
-
Protect confidential employee data.
-
Compare historical patterns before implementing new D&I initiatives.
### Click here to read the Detailed blog post
Visit our YouTube channel for step-by-step tutorials


Reviews
There are no reviews yet.