Managing distributor performance effectively is essential for organizations that rely on strong sales and distribution networks. Distributors directly influence product availability, revenue growth, customer satisfaction, and market expansion. However, many businesses still evaluate distributor performance using disconnected spreadsheets and manual reporting processes. As a result, performance visibility becomes limited, corrective actions are delayed, and strategic decision-making slows down.
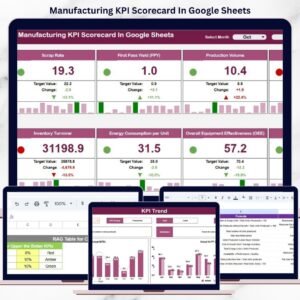
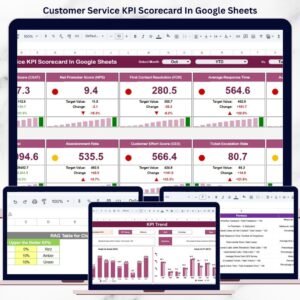
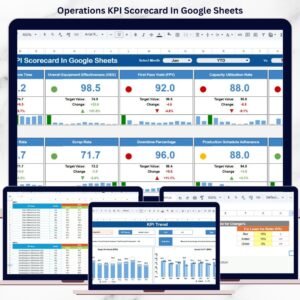
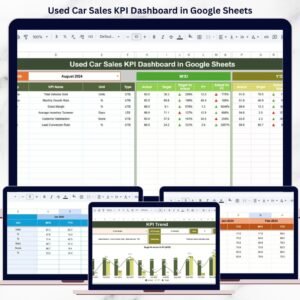
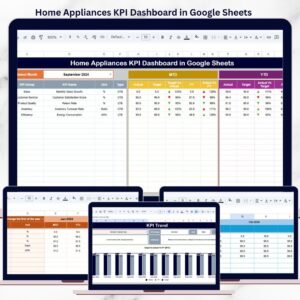
The Distributor Performance KPI Dashboard in Google Sheets provides a powerful, ready-to-use analytics solution designed to monitor distributor efficiency using structured Key Performance Indicators (KPIs). This interactive dashboard transforms raw distribution data into clear visual insights, helping organizations evaluate sales achievements, compare targets, and track performance trends in real time.
Instead of reviewing multiple reports, managers analyze distributor performance through one centralized dashboard that updates automatically based on selected months. Built entirely in Google Sheets, the solution enables cloud collaboration, automated calculations, and dynamic reporting without requiring expensive software or technical expertise.
This dashboard empowers sales leaders, supply chain managers, and business executives to monitor distributor accountability, identify performance gaps early, and make data-driven decisions that improve overall distribution efficiency.
🚀 Key Features of Distributor Performance KPI Dashboard in Google Sheets
📊 Interactive KPI Dashboard – Monitor distributor performance from one centralized view.
📅 Dynamic Month Selection – Instantly update dashboard analysis using dropdown filters.
📈 MTD & YTD Performance Tracking – Evaluate short-term and long-term performance.
🎯 Target vs Actual Comparison – Identify achievement gaps quickly.
📉 Previous Year Benchmarking – Measure growth using historical comparison.
📊 KPI Trend Analysis – Analyze performance patterns over time.
🧮 Automated Calculations – Reduce manual reporting effort.
☁️ Cloud-Based Collaboration – Access and share insights anywhere using Google Sheets.
📦 Dashboard Structure – Worksheets Overview
The template includes six structured worksheets, each designed for a specific analytical purpose.
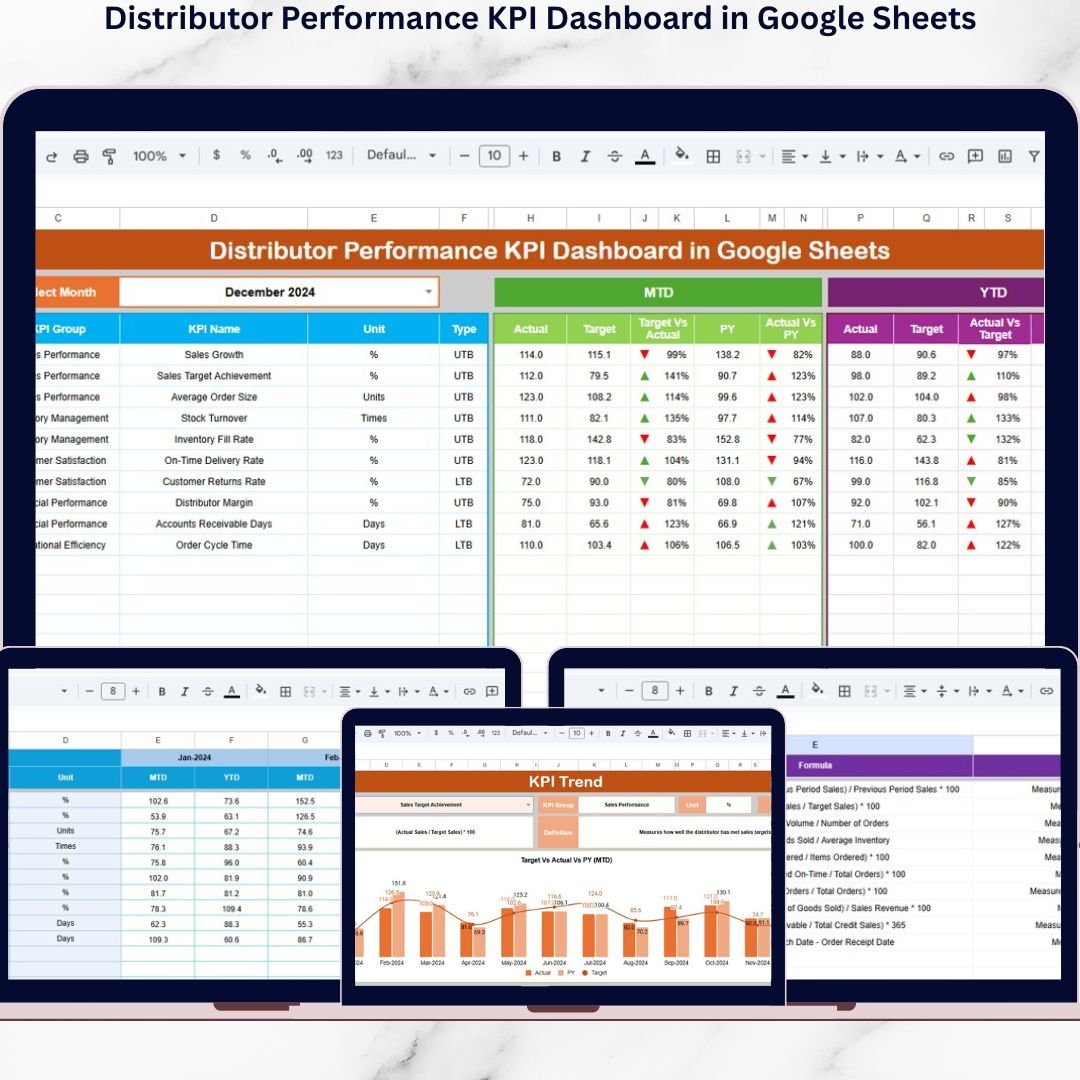
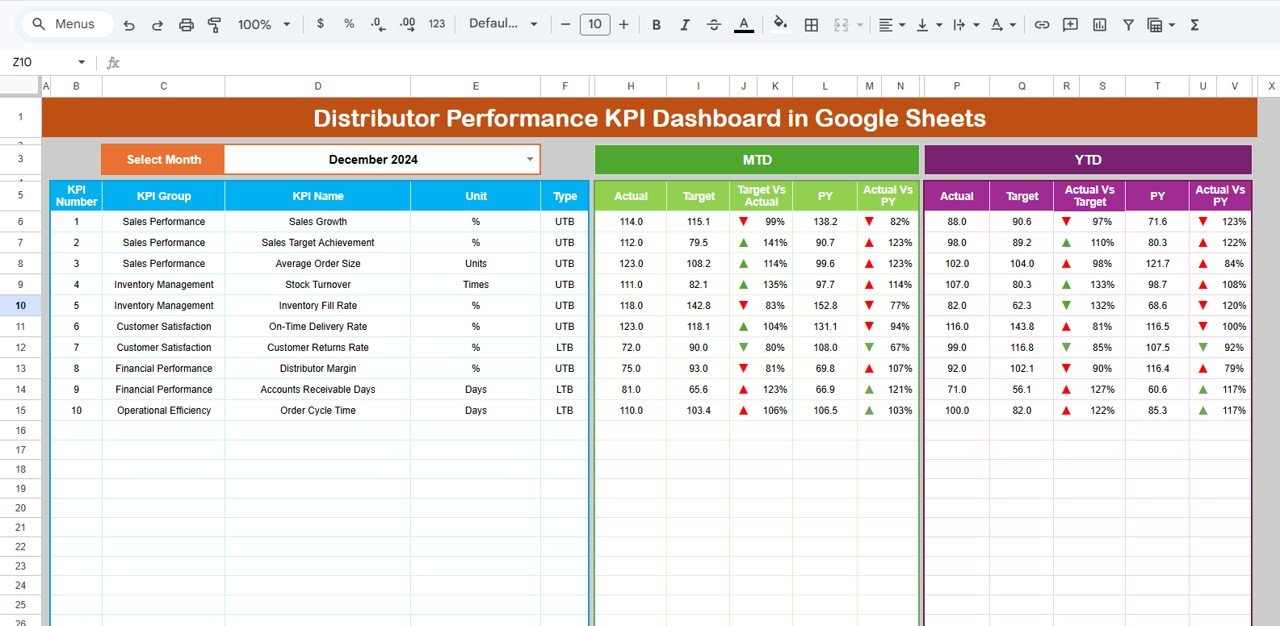
📊 Dashboard Sheet — Main Performance Overview
This is the primary analytics page displaying all KPIs together.
Core Functionality
-
Month selection dropdown (Cell D3)
-
Automatic dashboard refresh
-
KPI summary visualization
Metrics Displayed
✔ MTD Actual, Target & Previous Year
✔ Target vs Actual comparison
✔ Previous Year vs Current Year comparison
✔ YTD performance tracking
✔ Variance indicators
Visual arrows instantly show performance direction:
🟢 Green Arrow → Performance Improved
🔴 Red Arrow → Performance Declined
Managers understand distributor performance within seconds.
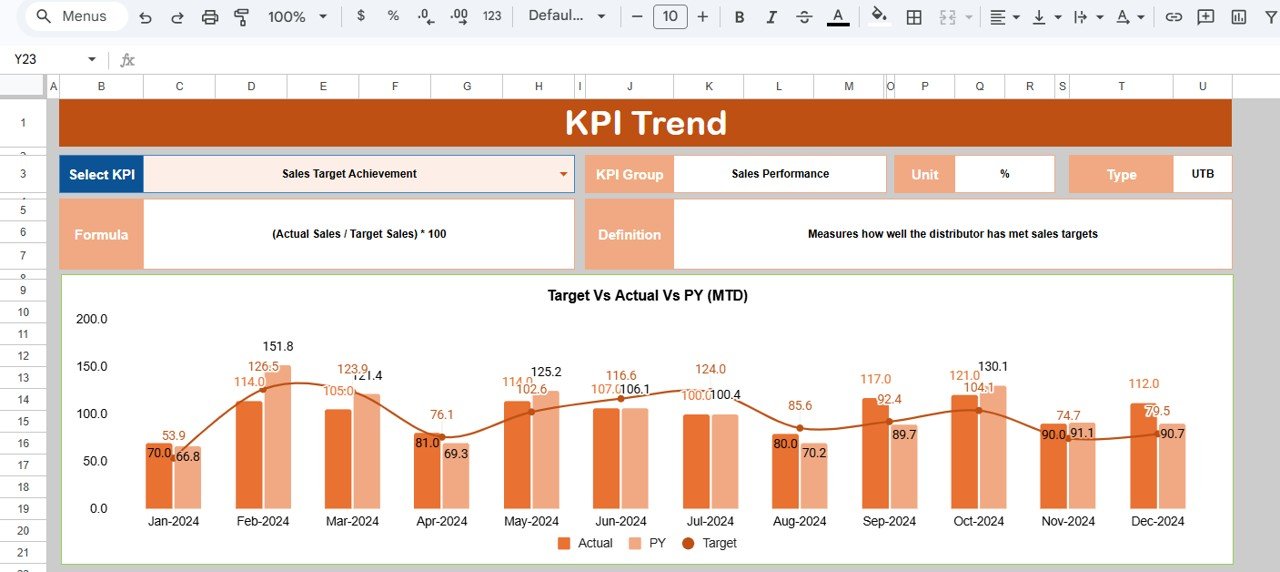
📈 KPI Trend Sheet — Detailed KPI Analysis
Provides deep KPI-level insights.
Users select a KPI from dropdown (Cell C3) to view:
-
KPI Group
-
Measurement Unit
-
KPI Type (Lower or Higher is Better)
-
KPI Formula
-
KPI Definition
Trend charts display monthly performance movements, enabling data-driven evaluation.
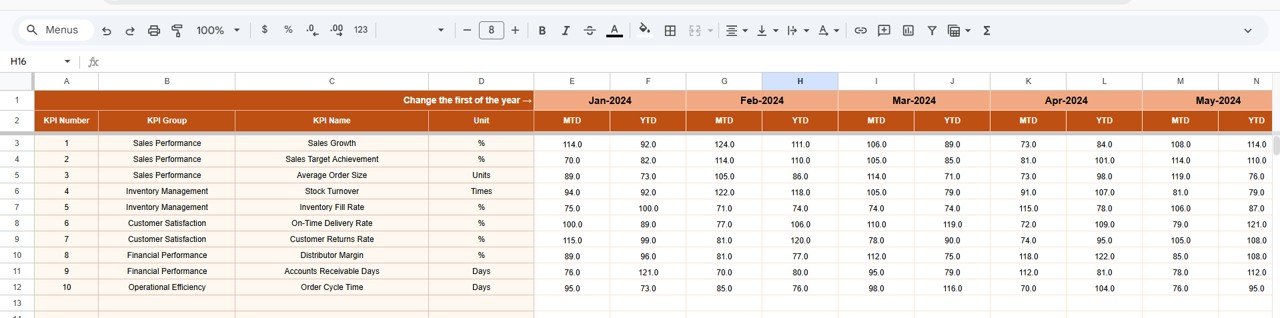
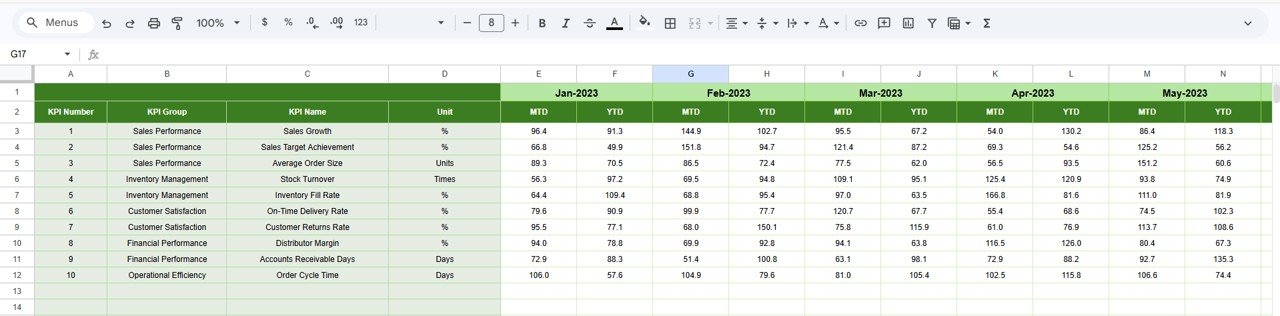
🧾 Actual Number Sheet — Current Year Data Entry
This sheet captures actual distributor performance values.
Simple Data Entry Process
-
Enter MTD and YTD numbers
-
Select financial year start month (Cell E1)
All dashboard calculations update automatically.
🎯 Target Sheet — Performance Goals
Stores distributor targets centrally.
Includes:
-
Monthly Targets (MTD)
-
Year-to-Date Targets (YTD)
Ensures consistent and standardized performance comparison.
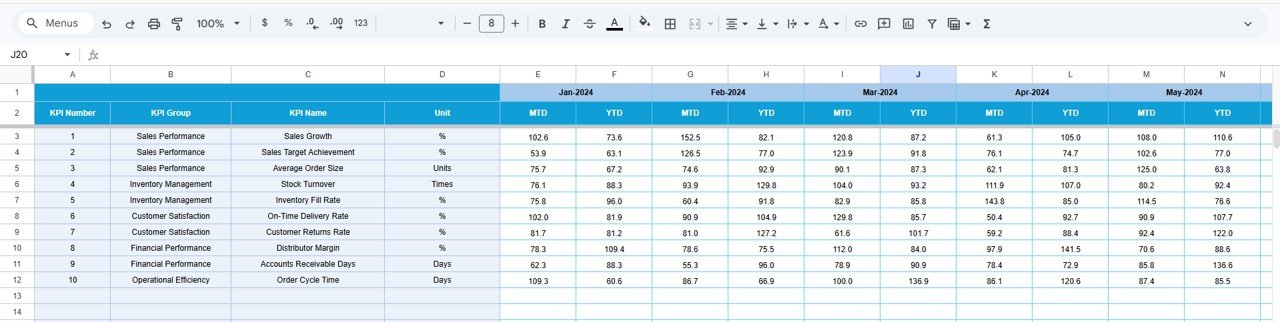
📅 Previous Year Number Sheet — Historical Benchmarking
Used to input last year’s distributor performance data.
Helps organizations:
-
Evaluate growth trends
-
Measure improvement
-
Perform year-over-year analysis
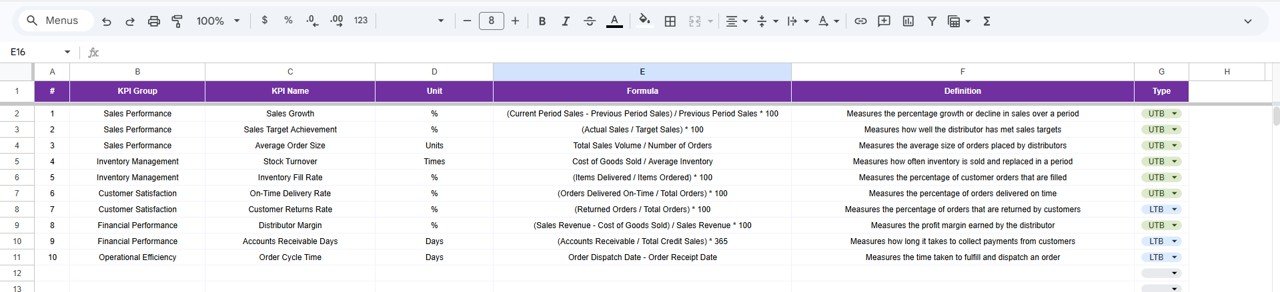
📘 KPI Definition Sheet — KPI Master Database
Acts as a centralized KPI reference library.
Stores:
-
KPI Name
-
KPI Group
-
Unit
-
Formula
-
KPI Definition
Maintains reporting consistency across teams.
📊 Business Benefits of This Dashboard
✅ Centralized Distributor Monitoring
Track all KPIs in one structured dashboard.
✅ Real-Time Insights
Instantly evaluate distributor performance.
✅ Improved Decision-Making
Visual analytics simplify performance evaluation.
✅ Distributor Accountability
Clear targets improve execution discipline.
✅ Historical Performance Visibility
Understand long-term growth trends.
✅ Cost-Effective Analytics Solution
No additional BI software required.
⚙️ How to Use the Distributor KPI Dashboard
1️⃣ Define KPIs in KPI Definition Sheet.
2️⃣ Enter distributor targets.
3️⃣ Add previous year data.
4️⃣ Input monthly actual performance.
5️⃣ Select month from dashboard dropdown.
6️⃣ Analyze KPI trends and performance insights.
Within minutes, organizations gain a fully functional distributor analytics system.
👥 Who Can Use This Dashboard?
Ideal for:
🏢 Sales Managers
🚚 Distribution Managers
📦 Supply Chain Teams
📊 Business Analysts
📈 Commercial Heads
🏭 Manufacturing Companies
🛍 FMCG & Retail Organizations
💼 Business Consultants
Click here to Read detailed blog post
Watch the step-by-step video tutorial:
🎓 Learn More
Visit our YouTube channel for step-by-step tutorials:
👉 https://youtube.com/@NeotechNavigators