
Managing thousands of digital assets—images, videos, documents, graphics, campaigns, and creative files—is becoming harder every year. As digital libraries grow, teams struggle with tracking approvals, metadata accuracy, usage patterns, file duplication, storage waste, and overall asset performance. The Digital Asset Management KPI Dashboard in Power BI solves this challenge beautifully.
This powerful dashboard turns your traditional Excel-based DAM tracking system into a modern, real-time, and data-driven workflow. It helps you monitor KPIs instantly, compare performance month-by-month, and understand which assets actually deliver value. Designed for marketing teams, digital agencies, e-commerce brands, and creative studios, this dashboard ensures you never lose track of your assets again.
Below is the complete breakdown of how this dashboard works and why it becomes an essential tool for digital operations.
📌 Key Features of the Digital Asset Management KPI Dashboard in Power BI
This dashboard includes everything teams need to track digital asset performance. With real-time MTD/YTD analysis, CY vs PY comparisons, and KPI drill-down features, you get full clarity in seconds.
⭐ Highlights Include:
-
Slicers for Month & KPI Group
-
Multiple KPI Cards for instant insight
-
Detailed tables showing MTD, YTD, Target, PY values
-
Red/Green icons for performance status
-
Trend tracking for all KPIs
-
Drill-through KPI definition page
-
Excel-based backend for effortless updates
Whether you manage 5,000 assets or 50,000 assets, this dashboard keeps everything organized and performance-focused.
📦 What’s Inside the Digital Asset Management KPI Dashboard in Power BI
This dashboard contains three analytical pages, each built for a different purpose. Every page reads from simple Excel sheets, so updating your KPIs is quick and flexible.
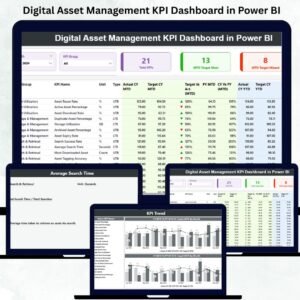
📍 1. Summary Page – Complete DAM Visibility
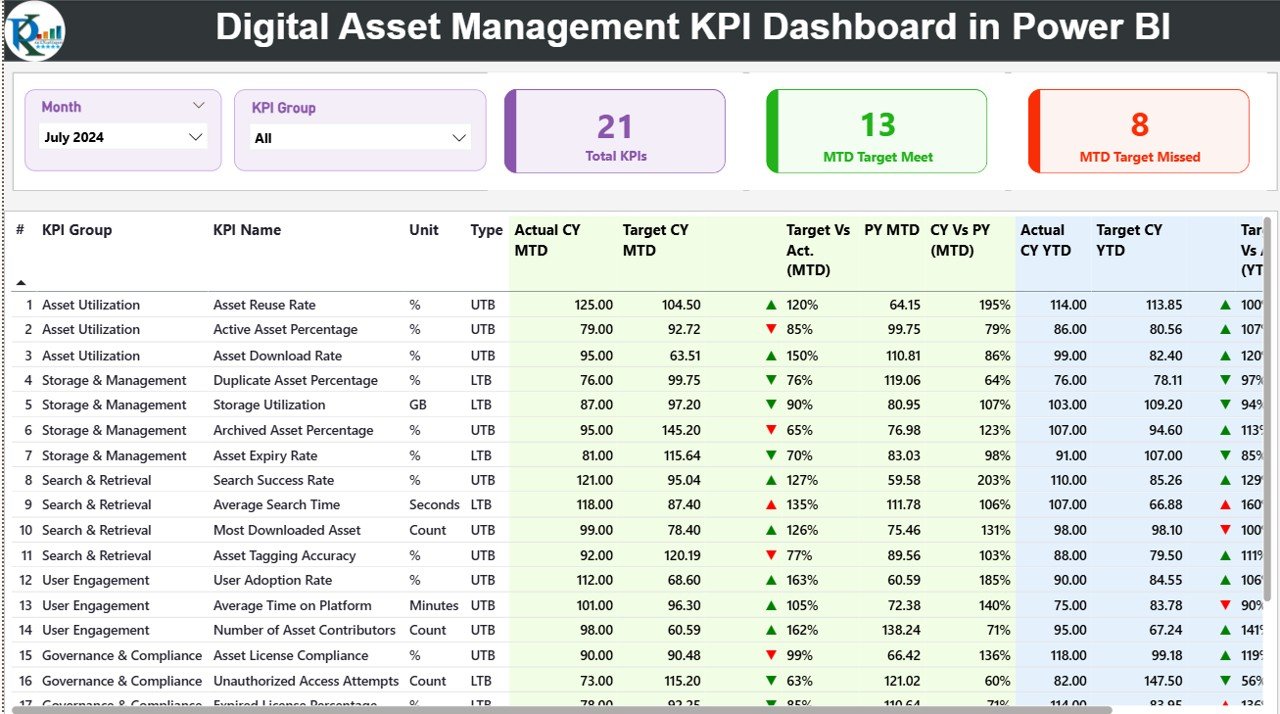
The Summary Page is the heart of the dashboard, showing all KPIs in one clean and interactive layout.
✔ You can track:
-
Total KPIs Count
-
MTD Target Met Count
-
MTD Target Missed Count
✔ Detailed KPI Table includes:
-
KPI Number
-
KPI Group
-
KPI Name
-
Unit (%, Days, Count, etc.)
-
KPI Type (UTB or LTB)
-
Actual MTD & YTD
-
Target MTD & YTD
-
Icons for performance
-
CY vs PY comparisons
This page gives managers a full picture of operational accuracy, content performance, and approval cycles—instantly.
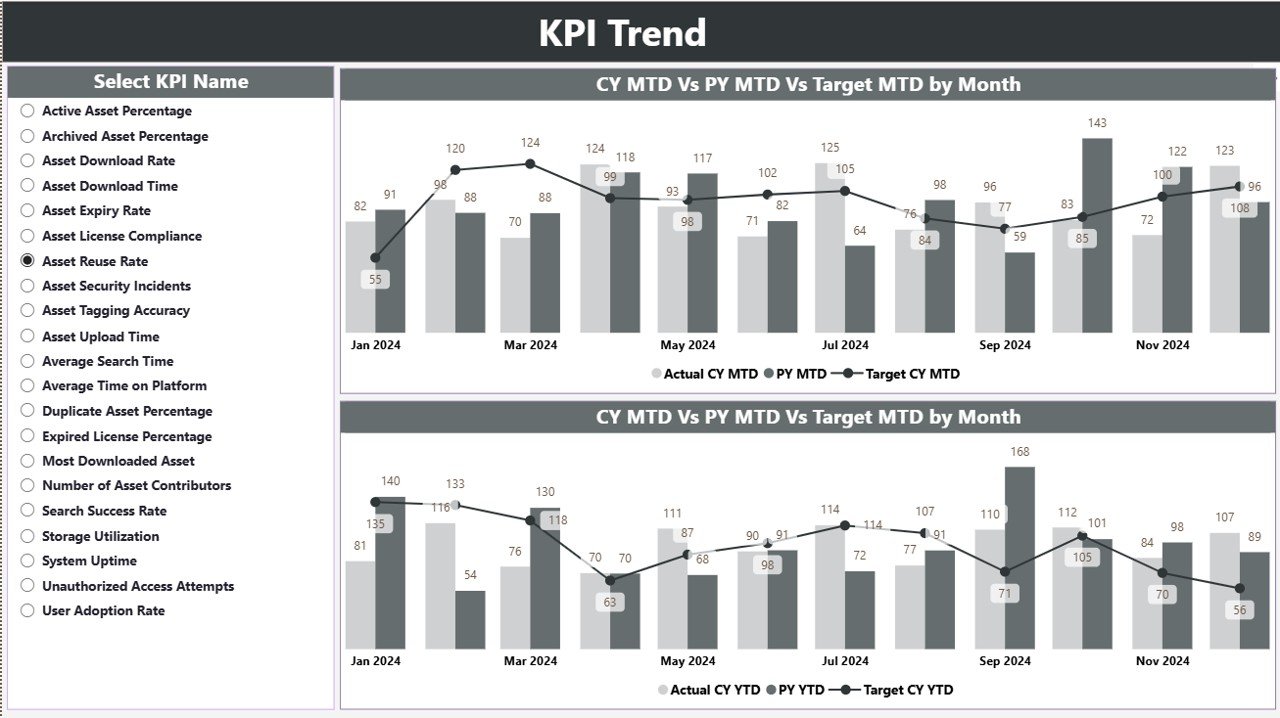
📍 2. KPI Trend Page – Deep Performance Tracking
This is the page for analyzing patterns and reviewing asset behavior month-by-month.
✔ The trend page displays:
-
Current Year Actual
-
Previous Year Actual
-
Target Values
-
MTD Trends
-
YTD Trends
Teams can quickly identify:
-
Performance drops
-
Seasonal changes
-
Usage improvement opportunities
-
Content quality issues
-
Growth patterns
This page becomes extremely useful for content strategists and marketing managers.
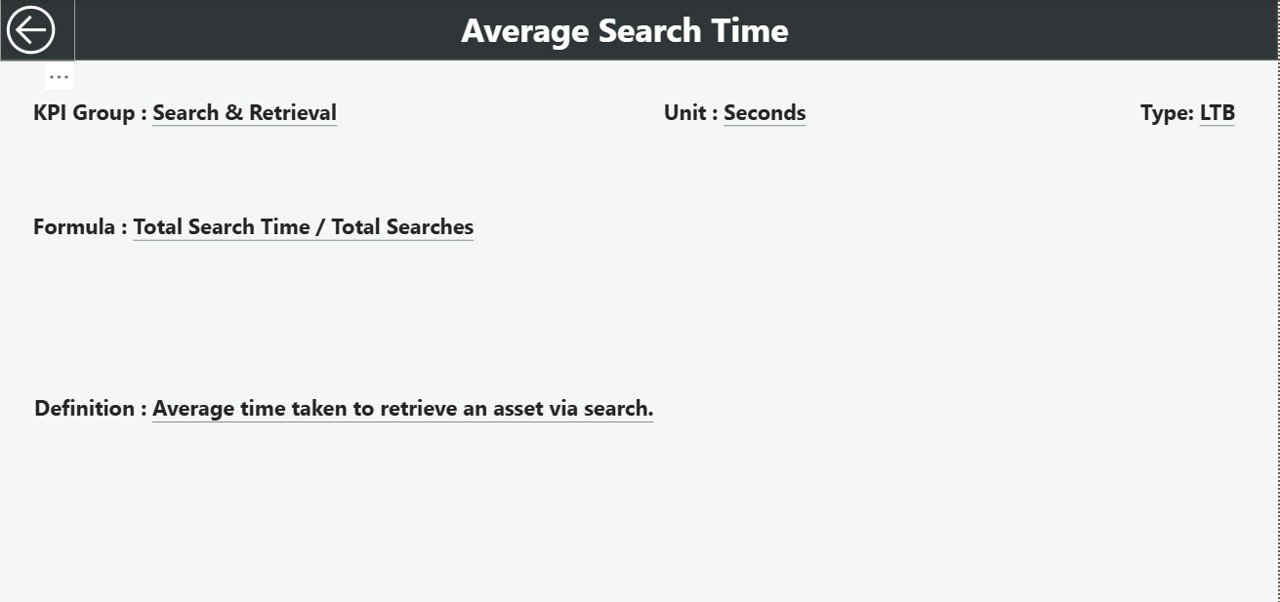
📍 3. KPI Definition Page – Easy Drill-Through Insight
This hidden page helps users understand each KPI clearly.
✔ It includes:
-
KPI Name
-
Formula
-
Definition
-
Unit
-
KPI Type
With one click, users can see how a KPI works—making the dashboard user-friendly even for beginners.
👥 Who Can Benefit from This Digital Asset Management KPI Dashboard?
This dashboard is ideal for any team handling large volumes of content:
-
🎨 Creative Design Teams
-
🛒 E-commerce Content Teams
-
📢 Marketing Departments
-
🏢 Digital Agencies
-
📁 Enterprise DAM Teams
-
🎬 Media Production Units
-
📰 Publishing & Editorial Teams
If your team works with digital files daily, you need this dashboard to streamline your workflow.
### 📘 Click here to read the Detailed Blog Post
### 📺 Visit our YouTube channel to learn step-by-step video tutorials:
👉 Youtube.com/@PKAnExcelExpert


Reviews
There are no reviews yet.