


In today’s data-driven healthcare world, dental practices must go beyond intuition — they need measurable insights to improve patient care, optimize operations, and increase profitability. The Dental Services KPI Dashboard in Power BI is a powerful, ready-to-use analytical solution designed to help dental clinics, hospitals, and multi-branch chains track performance and make informed, real-time decisions.
Built entirely in Microsoft Power BI and powered by Excel data, this dashboard transforms raw numbers into interactive visuals and KPI cards. It provides a 360° view of your clinic’s performance, covering financial, operational, and clinical dimensions — all within one sleek, intuitive interface.
Whether you manage a single dental office or a multi-location network, this Power BI dashboard delivers clarity, transparency, and control over your entire dental ecosystem.
⚙️ Key Features of the Dental Services KPI Dashboard in Power BI
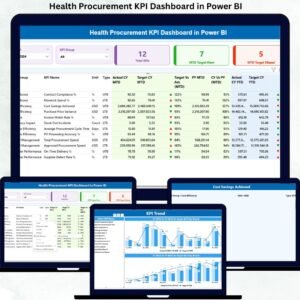
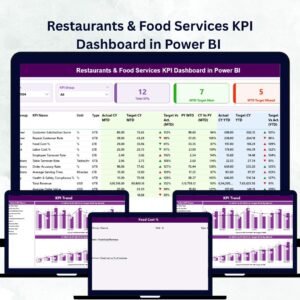
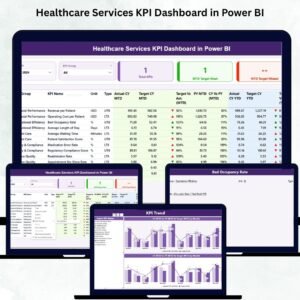
📊 3 Analytical Pages: Summary | KPI Trend | KPI Definition
📅 Slicers & Filters: Instantly filter by Month or KPI Group.
🎯 KPI Cards: Track Total KPIs, MTD Target Met, and Target Missed.
📈 Actual vs Target vs Previous Year: Measure MTD and YTD performance.
🟢🔴 Visual Indicators: Arrows & colors show immediate status.
📉 Trend Charts: Analyze progress with combo visuals over time.
🧩 Excel Integration: Easy to update and refresh — no coding needed.
💻 Fully Interactive: Drill through for details or return with one click.
📊 Dashboard Structure and Pages
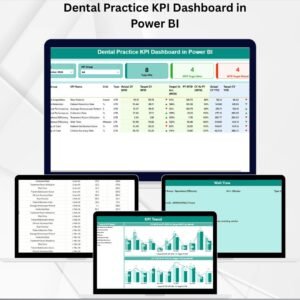
🦷 1️⃣ Summary Page — Your Performance Command Center

This is the dashboard’s main control hub — giving you instant access to all critical KPIs.
Features:
-
Month and KPI Group Slicers for focused analysis.
-
Summary Cards display Total KPI Count, MTD Target Met, and MTD Target Missed.
-
Detailed KPI Table showing KPI Group, Name, Unit, Type (LTB/UTB), Actual vs Target (MTD/YTD), Previous Year data, and trend icons.
💡 Purpose: Quickly identify high-performing areas and address underperforming KPIs in seconds.
📈 2️⃣ KPI Trend Page — Visualizing Progress Over Time
Understand how your practice is evolving month by month.
-
Combo Charts for MTD and YTD comparisons of Actual, Target, and Previous Year values.
-
Interactive Slicer to select specific KPIs for trend review.
💡 Purpose: Spot patterns in treatment success, patient satisfaction, or revenue growth and plan improvements accordingly.
📘 3️⃣ KPI Definition Page — Your KPI Dictionary
Provides formula and definition details for each metric.
-
Columns for KPI Name, Group, Formula, Definition, Unit, and Type.
-
Drill-through capability from the Summary Page and a Back Button for easy navigation.
💡 Purpose: Ensure consistent understanding of KPI logic across departments.
📂 Excel Data Source Structure
The dashboard connects to a structured Excel file with three worksheets:
1️⃣ Input Actual: Monthly Actual MTD & YTD values.
2️⃣ Input Target: Target MTD & YTD values for each KPI.
3️⃣ KPI Definition: Core metadata (KPI Number, Group, Formula, Definition, Type).
💡 Purpose: Update the Excel file, refresh Power BI, and instantly see live changes — no technical setup required.
🌟 Advantages of the Dental Services KPI Dashboard in Power BI
✅ Real-Time Insights: Get instant updates as data changes.
✅ Improved Patient Care: Analyze satisfaction and treatment success rates.
✅ Operational Excellence: Track appointments, doctor efficiency, and staff utilization.
✅ Financial Transparency: Monitor revenue, costs, and profit trends.
✅ Data Centralization: All KPIs in one place for team-wide visibility.
✅ Time Efficiency: Automated Power BI visuals replace manual reporting.
✅ Scalable: Perfect for single clinics or multi-branch dental chains.
💡 Best Practices for Using This Dashboard
📌 Refresh Excel data monthly for accurate insights.
📌 Standardize KPI formulas across locations.
📌 Use conditional formatting for variance > ±10 %.
📌 Combine clinical and financial data for holistic reporting.
📌 Encourage staff engagement with KPI visibility.
📌 Apply Power BI security controls for patient data protection.
🧠 How It Drives Dental Business Growth
💰 Optimize resources and reduce idle chair time.
🧾 Track revenue streams and profit per treatment.
🧑⚕️ Boost patient retention through satisfaction analysis.
📊 Improve marketing ROI with data-backed insights.
🦷 Ensure regulatory and quality compliance with clear metrics.
🧩 Conclusion
The Dental Services KPI Dashboard in Power BI is more than a dashboard — it’s a complete performance intelligence solution for modern dental practices.
It empowers you to visualize KPIs, identify opportunities, and make data-driven decisions that improve patient outcomes and financial performance.
With seamless Excel integration, real-time visuals, and customizable KPIs, it’s the ultimate tool for clinics aiming to be efficient, profitable, and patient-focused.
🦷 Measure success. Maximize efficiency. Deliver smiles with NextGen Templates’ Dental Services KPI Dashboard in Power BI.


Reviews
There are no reviews yet.