


🔑 Key Features of Dental Practice Dashboard in Google Sheets
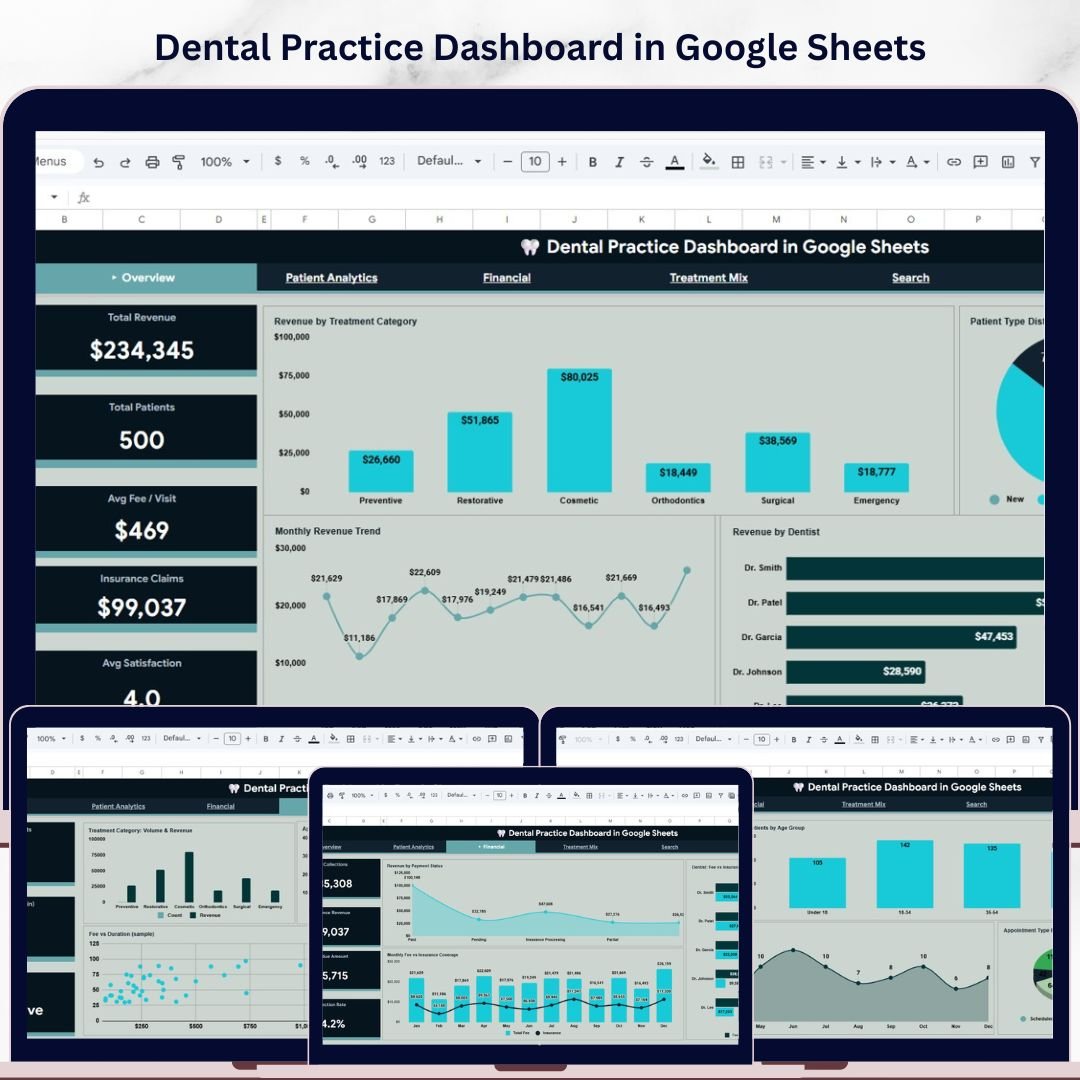
Dental Practice Dashboard in Google Sheets is a comprehensive, ready-to-use analytics template designed for dental clinic owners, practice managers, and healthcare administrators who need to monitor revenue performance, patient demographics, treatment mix, financial health, and satisfaction scores from a single interactive dashboard. This professionally built Google Sheets dashboard template includes 6 interactive pages covering every critical aspect of dental practice management — from high-level KPI tracking to granular patient record search.
Whether you operate a solo dental office or manage a multi-dentist clinic, this template gives you instant visibility into revenue trends, patient flow, insurance coverage, and treatment performance. The dashboard tracks 5 key performance indicators including Total Revenue, Total Patients, Average Fee per Visit, Insurance Claims, and Average Satisfaction Score — all updated dynamically through pivot tables and slicers. Explore more Google Sheets Dashboard Templates from our collection.

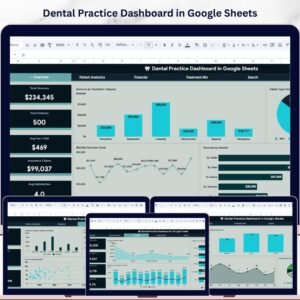
Dental Practice Dashboard in Google Sheets
📦 What’s Inside the Dental Practice Dashboard in Google Sheets
This dashboard contains 6 dedicated sheet tabs, each designed to answer specific business questions about your dental practice operations:
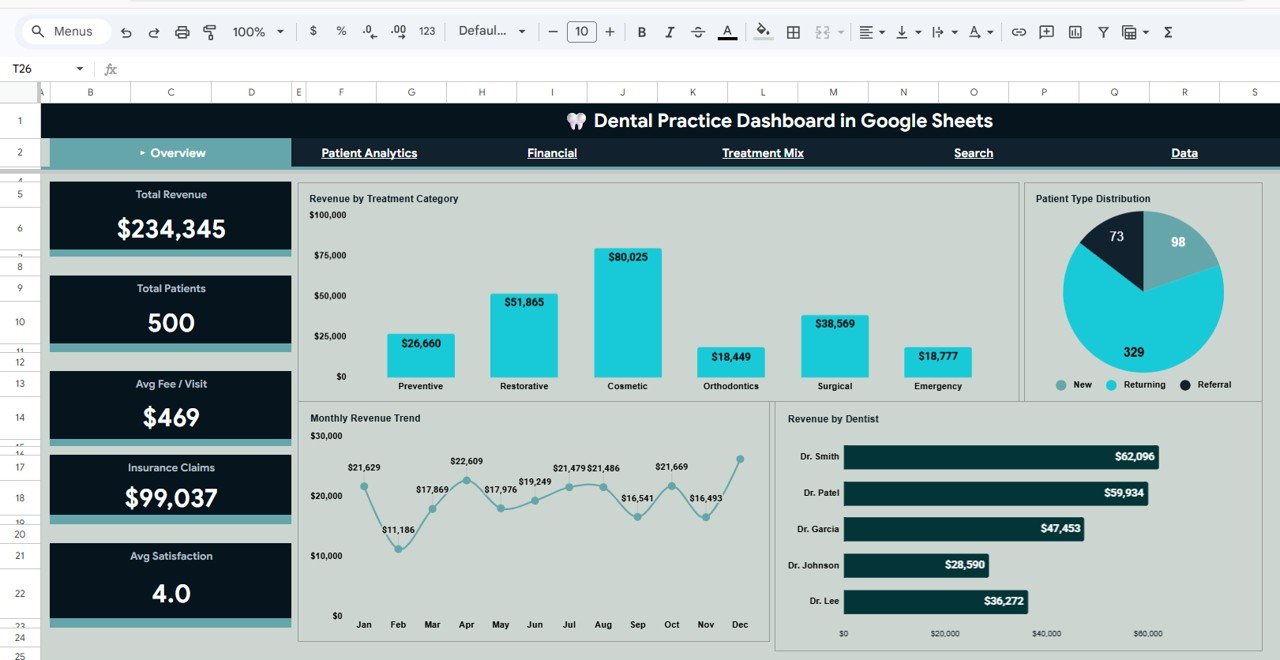
1. Overview Page: The command center of your dental practice analytics. At the top, five high-level KPI cards display Total Revenue, Total Patients, Avg Fee/Visit, Insurance Claims, and Avg Satisfaction. Below the cards, interactive charts show Revenue by Treatment Category, Patient Type Distribution by Patient Type, Monthly Revenue Trend by Month, and Revenue by Dentist. Multiple slicers let you filter the entire dashboard by category, dentist, patient type, and other dimensions instantly.
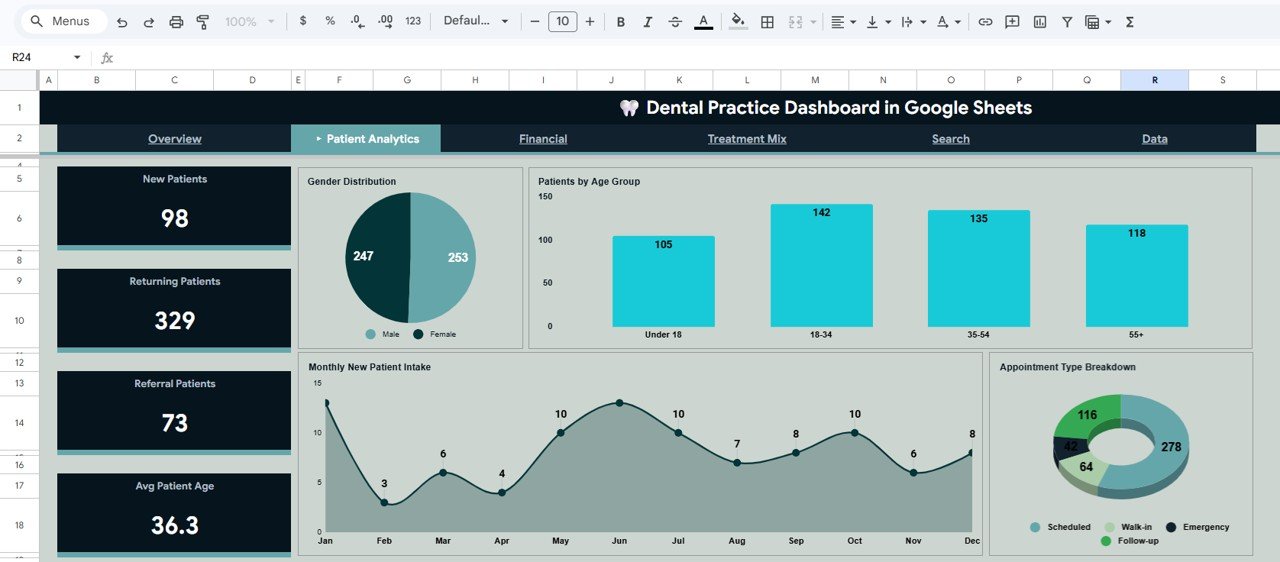
2. Patient Analytics: This page focuses on understanding your patient population. It includes Gender Distribution by Gender, Patients by Age Group, Monthly New Patient Intake by Month, and Appointment Type Breakdown by Appointment Type — giving you clear insights into patient demographics and scheduling patterns.

Patient Analytics
3. Financial: The financial analysis page tracks Revenue by Payment Status, Monthly Fee vs Insurance Coverage by Month, and Dentist Fee vs Insurance by Dentist. These charts help you understand payment collection patterns, insurance utilization, and revenue distribution across your dental team.

Financial Analysis
4. Treatment Mix: This page provides Treatment Category Volume and Revenue by Category, Appointment Duration Distribution by Duration Range, Avg Satisfaction by Category, and Fee vs Duration by Treatment. It helps you identify which treatments drive the most revenue and which deliver the best patient satisfaction. Explore our Dental Practice Dashboard in Excel for an Excel-based alternative.
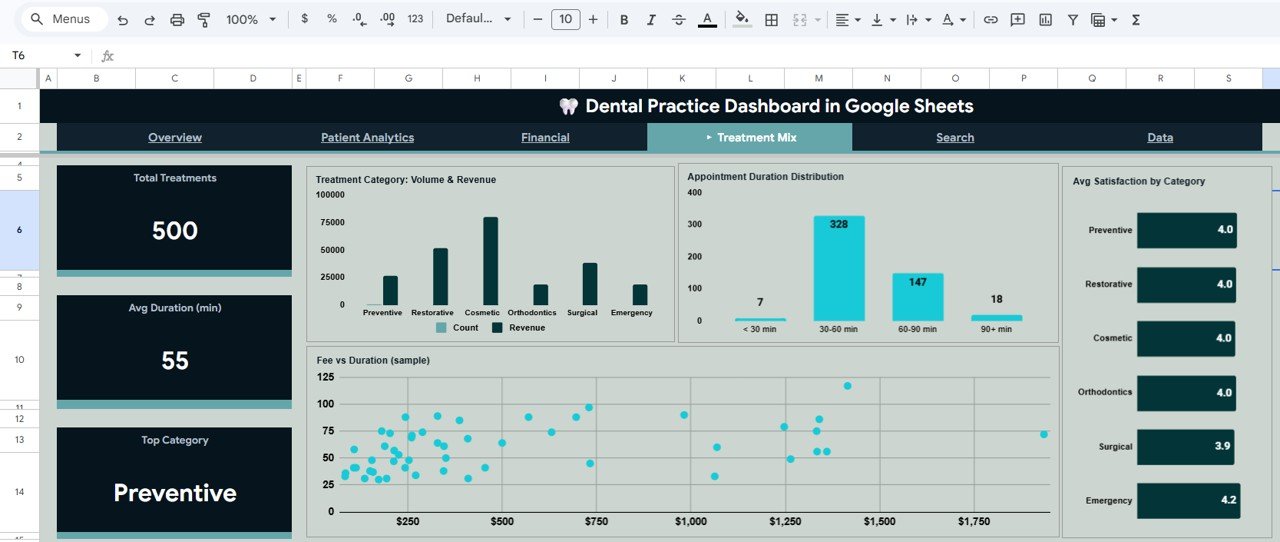
Treatment Mix
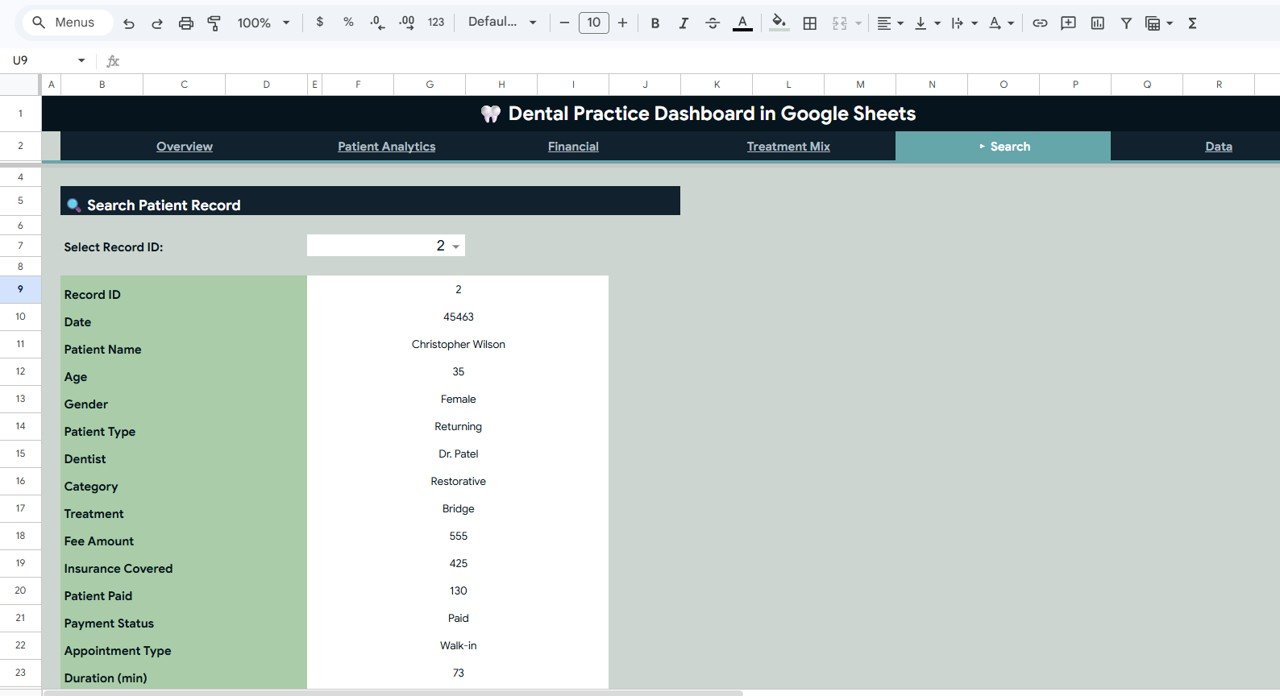
5. Search Page: A powerful Search Patient Record feature where you select any Record ID from a dropdown and instantly view complete patient details including Date, Patient Name, Age, Gender, Patient Type, Dentist, Category, Treatment, Fee Amount, Insurance Covered, Patient Paid, Payment Status, Appointment Type, and Duration.

Search Sheet Tab
6. Data Sheet: The structured data entry sheet where you add your dental practice records. It comes pre-loaded with 500 sample records in the correct format — simply replace the sample data with your own and the entire dashboard updates automatically.
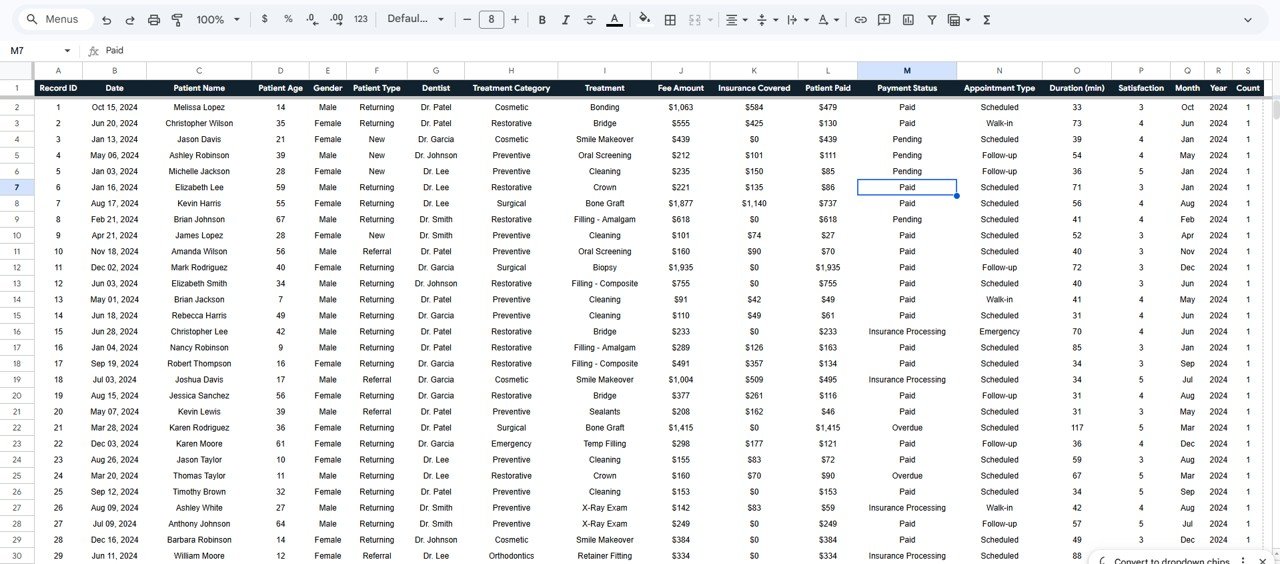
Data Sheet Tab
⚙️ How to Use the Dental Practice Dashboard in Google Sheets
📌 Step 1: Open the PDF guide included in your download and click the Google Sheets copy link to create your own editable copy in Google Drive.
📌 Step 2: Navigate to the Data Sheet tab and replace the sample data with your own dental practice records in the same column format.
📌 Step 3: Return to the Overview page — all KPI cards, charts, and analysis pages update automatically based on your data.
📌 Step 4: Use the slicers and filters to drill down into specific treatment categories, dentists, patient types, or time periods.
📌 Step 5: Use the Search Page to look up individual patient records by selecting a Record ID from the dropdown. For detailed dental KPI tracking with targets and trends, check out the Dental Practice KPI Dashboard in Google Sheets.
👥 Who Can Benefit from This Dental Practice Dashboard in Google Sheets
📌 Dental clinic owners monitoring revenue, patient flow, and operational performance
📌 Practice managers tracking treatment volumes, appointment types, and staff productivity
📌 Healthcare administrators analyzing insurance utilization and payment collection patterns
📌 Financial controllers reviewing fee structures, revenue by dentist, and cost analysis
📌 Multi-location dental groups comparing performance across clinics and dentists
📌 Dental consultants creating performance reports for client practices
❓ Frequently Asked Questions
What KPIs does the Dental Practice Dashboard in Google Sheets track?
The Dental Practice Dashboard in Google Sheets tracks 5 key performance indicators including Total Revenue, Total Patients, Average Fee per Visit, Insurance Claims, and Average Satisfaction Score. It also provides detailed analysis across 6 interactive pages covering revenue, patient demographics, financials, treatment mix, and individual patient records.
Do I need advanced Google Sheets skills to use this template?
No. Simply replace the sample data in the Data Sheet with your own dental practice records and all charts, KPIs, and analysis pages update automatically. The dashboard uses built-in pivot tables, formulas, and slicers that require no manual configuration.
Can I filter the dashboard by specific dentist or treatment category?
Yes. The dashboard includes multiple slicers on the Overview page that let you filter all charts and KPIs by treatment category, dentist name, patient type, and other dimensions instantly.
Is this dashboard suitable for multi-dentist clinics?
Absolutely. The dashboard includes Revenue by Dentist analysis and Dentist Fee vs Insurance comparison, making it ideal for practices with multiple dentists. You can filter and compare individual dentist performance across all metrics.
How many patient records can this dashboard handle?
The template comes with 500 sample records and can handle thousands of records in Google Sheets. Simply add your data rows in the Data Sheet and the dashboard scales automatically.
Can I search for individual patient records in this dashboard?
Yes. The Search Page lets you select any Record ID from a dropdown to instantly view complete patient details including name, age, gender, treatment, fees, insurance coverage, payment status, and appointment duration.
🔗 Explore Related Templates
📌 Dental Practice Dashboard in Excel — The Excel version with pivot tables and automated formulas for dental clinic analytics.
📌 Dental Practice Dashboard in Power BI — Advanced Power BI analytics for dental practice performance tracking.
📌 Dental Practice KPI Dashboard in Google Sheets — Track dental KPIs with targets, trends, and year-over-year comparisons.
📌 Hospital Patient Flow Dashboard in Excel — Monitor patient flow, department performance, and hospital capacity.


Reviews
There are no reviews yet.