


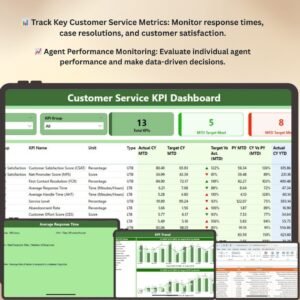
The Customer Service KPI Dashboard in Power BI is a powerful and interactive tool designed for businesses looking to optimize their customer service operations. This dashboard provides real-time insights into key performance indicators (KPIs) that matter most in customer service, such as response times, resolution rates, customer satisfaction, and agent performance. By tracking these essential metrics, customer service managers can make data-driven decisions to improve team efficiency, enhance customer satisfaction, and drive business success.
After downloading and unzipping this file, ensure that macros are enabled before use. Refer to our below tutorial link for step-by-step instructions on enabling macros in Excel.
With this Customer Service KPI Dashboard in Power BI, you can monitor how well your customer service team is performing across various metrics, identify bottlenecks, and implement improvements. Whether you’re managing a small customer service team or an entire department, this dashboard offers an easy-to-navigate, customizable solution to monitor and optimize your customer service strategies in real time.
Key Features of the Customer Service KPI Dashboard in Power BI
📊 Comprehensive Customer Service Tracking
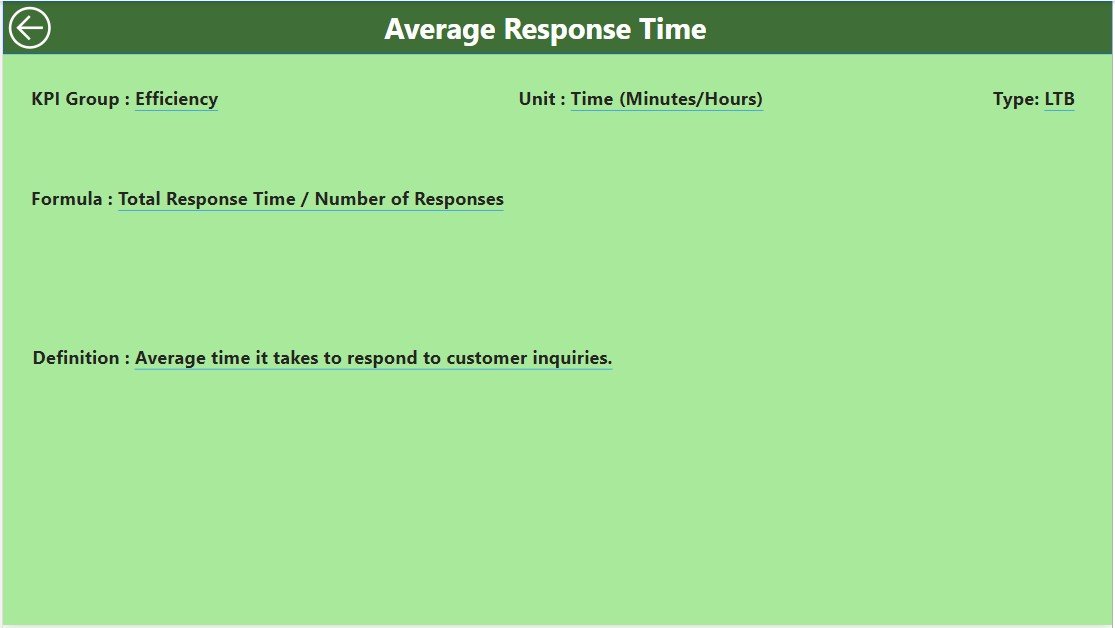
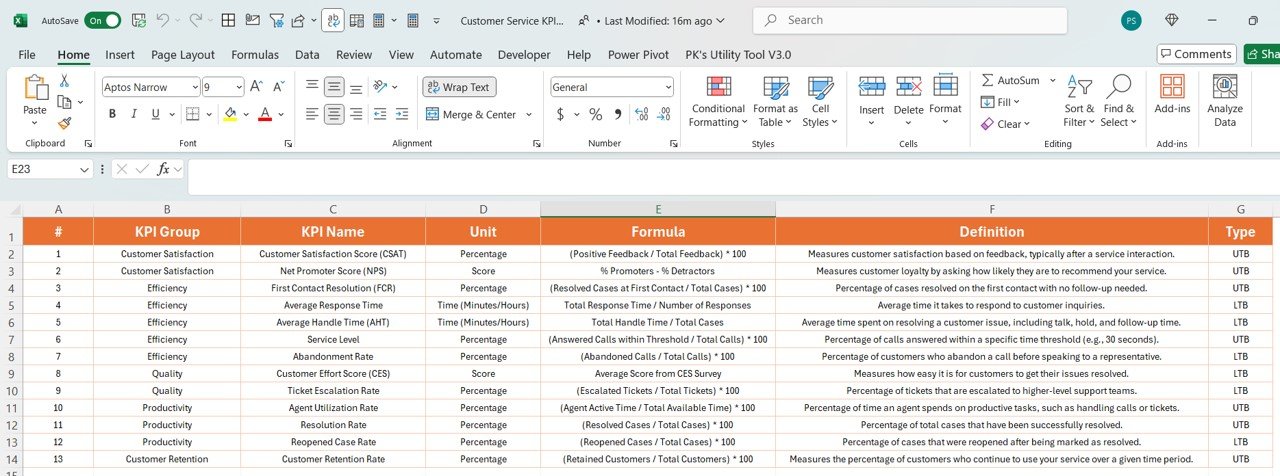
Track critical KPIs related to customer service, including response times, case resolution times, customer satisfaction scores, and agent performance. Monitor both individual and team performance to ensure service levels are met.
⚡ Real-Time Performance Insights
Monitor performance metrics in real time, including case volumes, customer satisfaction levels, and agent response times. Stay on top of issues and adjust your strategies promptly to ensure high service quality.
📈 Customer Satisfaction & Resolution Rates
Analyze customer feedback, satisfaction scores, and resolution rates to understand how effectively customer issues are being addressed. Identify trends in customer concerns and improve your team’s response strategies.
📅 Agent Performance Monitoring
Evaluate individual agent performance by tracking key metrics such as case resolution rates, average response times, and customer ratings. Ensure your team is meeting service level expectations and identify opportunities for coaching and development.
🖥️ Interactive & User-Friendly Interface
The Power BI dashboard is intuitive and easy to use, featuring dynamic charts, filters, and slicers that allow you to explore customer service data in detail, identify trends, and make informed decisions.
Why You’ll Love the Customer Service KPI Dashboard in Power BI

✅ Track & Optimize Customer Service Performance
Monitor and analyze the efficiency and effectiveness of your customer service team in real time, ensuring that you meet service level agreements (SLAs) and customer expectations.
✅ Enhance Customer Satisfaction
Track and improve customer satisfaction by analyzing feedback, response times, and resolution rates. Ensure that customers are consistently happy with the service they receive.
✅ Monitor Agent Performance
Track individual agent performance, identify high performers, and provide coaching opportunities to those who need improvement. Improve overall team performance by using data-driven insights.
✅ Reduce Response Times & Resolution Delays
Identify areas where response times and case resolution times can be improved. Make real-time adjustments to optimize service delivery and reduce delays.
✅ Make Data-Driven Customer Service Decisions
Use the insights from the dashboard to make informed decisions about staffing, training, and process improvements, ensuring that your customer service operations run smoothly and efficiently.
What’s Inside the Customer Service KPI Dashboard Template?
- Case & Response Time Tracking: Monitor case volumes, average response times, and resolution times to ensure service level agreements are met.
- Customer Satisfaction Monitoring: Track customer feedback and satisfaction levels to assess service quality.
- Agent Performance Analytics: Monitor agent performance metrics such as case resolutions, response times, and customer ratings.
- Real-Time Reporting: Real-time updates on customer service performance, allowing you to track issues and make adjustments quickly.
- Customizable KPIs: Adjust the dashboard to track specific customer service metrics that align with your business needs.
- Interactive Charts & Filters: Use dynamic visualizations to explore trends, identify bottlenecks, and drill down into data to optimize performance.
How to Use the Customer Service KPI Dashboard in Power BI
1️⃣ Download the Template: Get instant access to your Customer Service KPI Dashboard in Power BI.
2️⃣ Input Data: Enter data such as customer service case volumes, response times, satisfaction scores, and agent performance metrics.
3️⃣ Track & Monitor KPIs: Use the dashboard to monitor real-time customer service performance and identify areas for improvement.
4️⃣ Analyze & Optimize: Use data insights to optimize team performance, reduce response times, and improve customer satisfaction.
Who Can Benefit from the Customer Service KPI Dashboard in Power BI?
🔹 Customer Service Managers & Supervisors
🔹 Operations Teams & Service Delivery Leaders
🔹 Business Owners & Entrepreneurs
🔹 HR & Training Teams for Customer Service
🔹 Data Analysts & Business Intelligence Professionals
🔹 Anyone Seeking to Improve Customer Service Operations & Performance
Track, analyze, and optimize your customer service operations with the Customer Service KPI Dashboard in Power BI. Ensure high-quality service, improve agent performance, and boost customer satisfaction across your business.
Click here to read the Detailed blog post
Visit our YouTube channel to learn step-by-step video tutorials
Youtube.com/@PKAnExcelExpert


Reviews
There are no reviews yet.