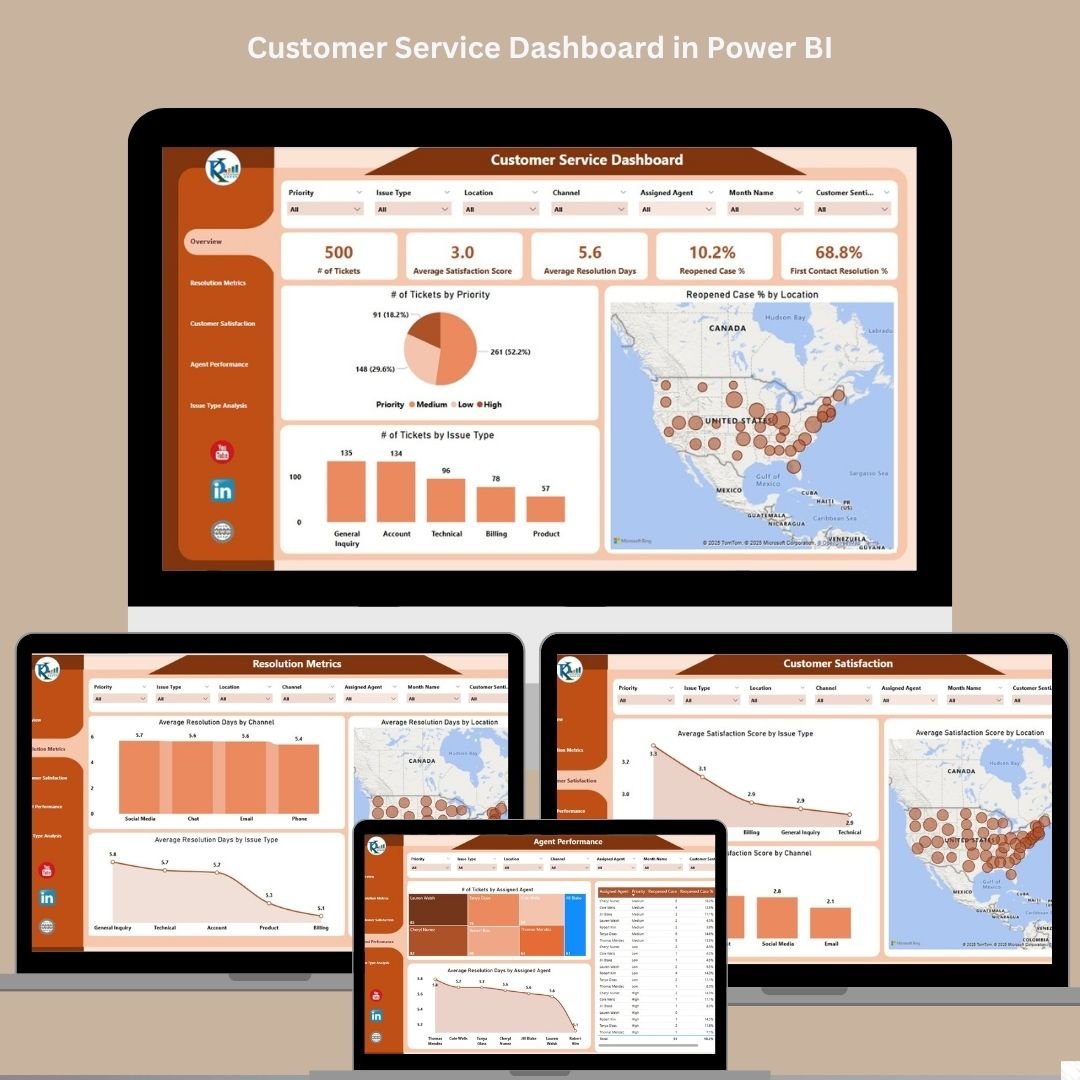
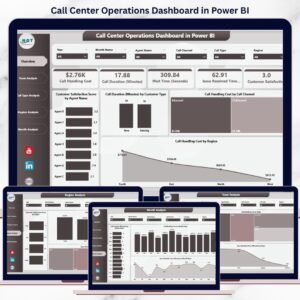
Customer satisfaction isn’t just a goal—it’s the foundation of lasting success. That’s why the Customer Service Dashboard in Power BI was built: to help you measure, analyze, and optimize your customer service operations with clarity and speed.
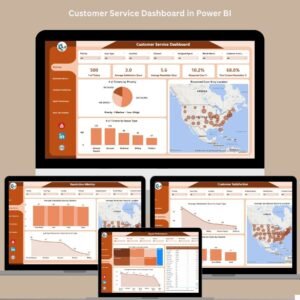
Whether you manage a call center, a support desk, or a multi-location service team, this ready-to-use Power BI dashboard enables real-time visibility into tickets, resolution efficiency, agent performance, and customer satisfaction metrics—all in one dynamic workspace.
🔍 Key Features of the Dashboard
This interactive Power BI file includes five detailed sheets, each offering focused insights into different customer service KPIs:
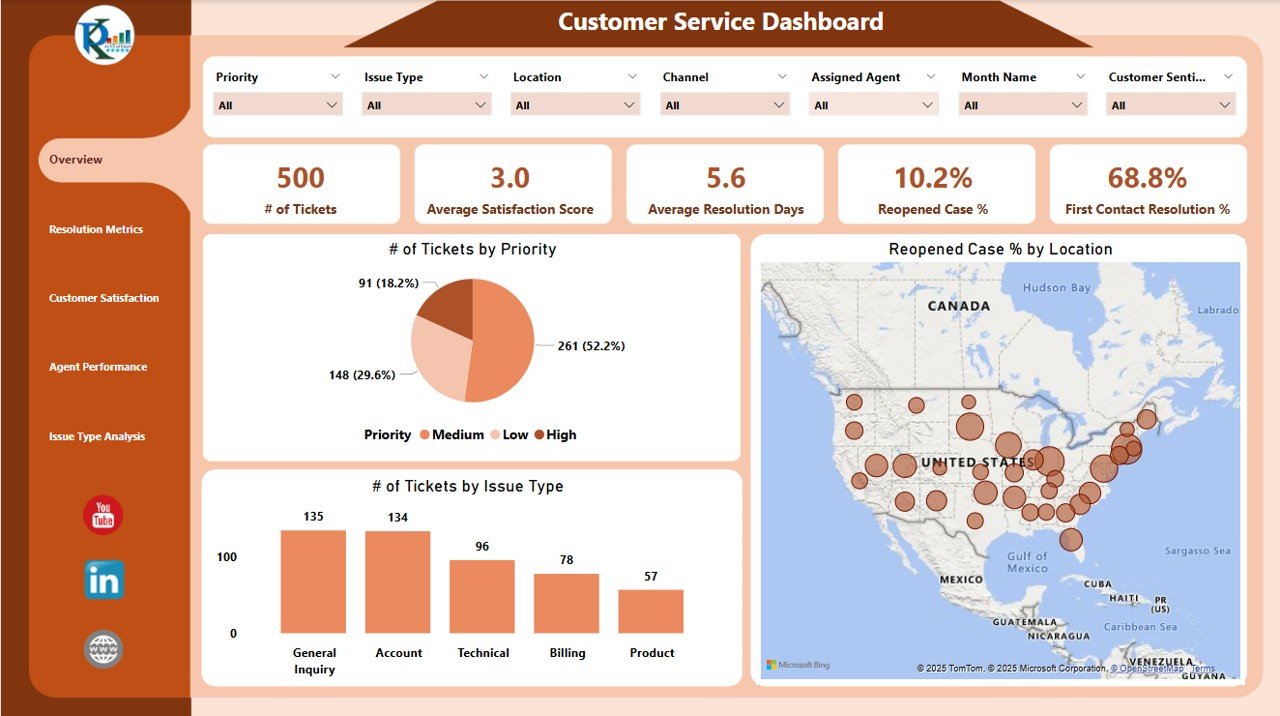
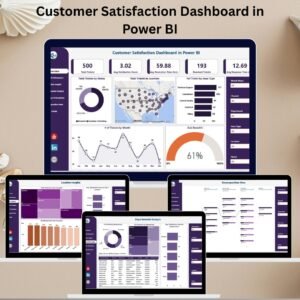
🧭 1. Overview Sheet Tab
-
Cards:
✅ Number of Tickets
✅ Average Satisfaction Score
✅ Average Resolution Days
✅ Reopened Case %
✅ First Contact Resolution % -
Charts:
📊 Tickets by Priority
📊 Tickets by Issue Type
📊 Reopened Case % by Location
Gain a comprehensive snapshot of service operations at a glance!
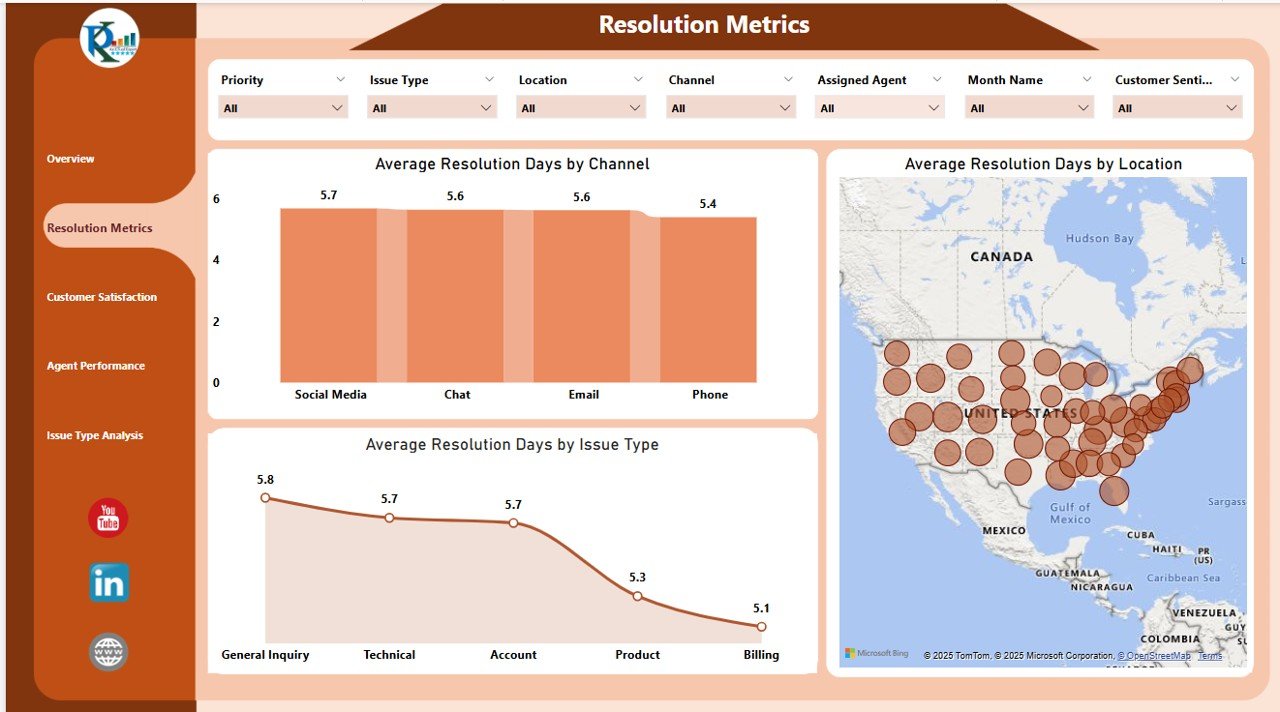
⏱ 2. Resolution Metrics Sheet Tab
-
Avg. Resolution Days by:
-
Issue Type
-
Channel (email, phone, chat)
-
Location
-
Identify where delays happen and take action faster.
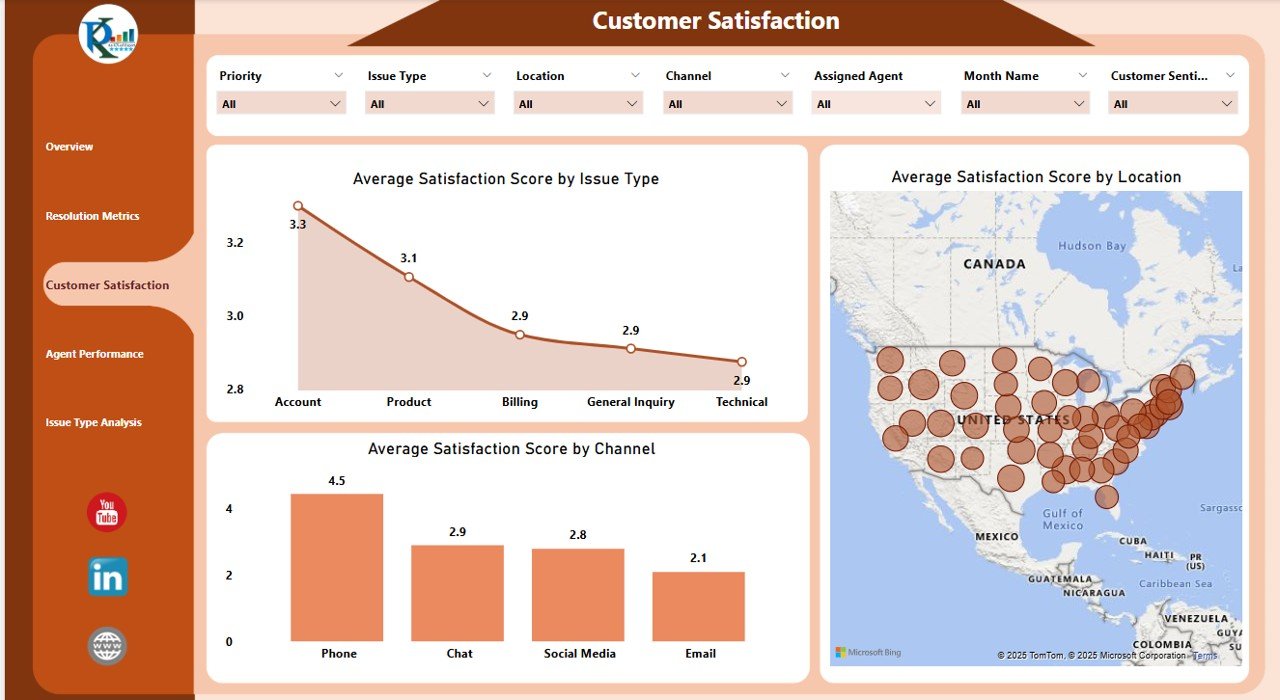
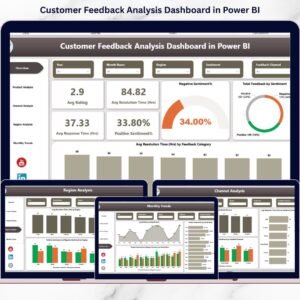
💬 3. Customer Satisfaction Sheet Tab
-
Satisfaction Score by:
-
Issue Type
-
Channel
-
Location
-
Pinpoint the root causes of low satisfaction and prioritize improvements.
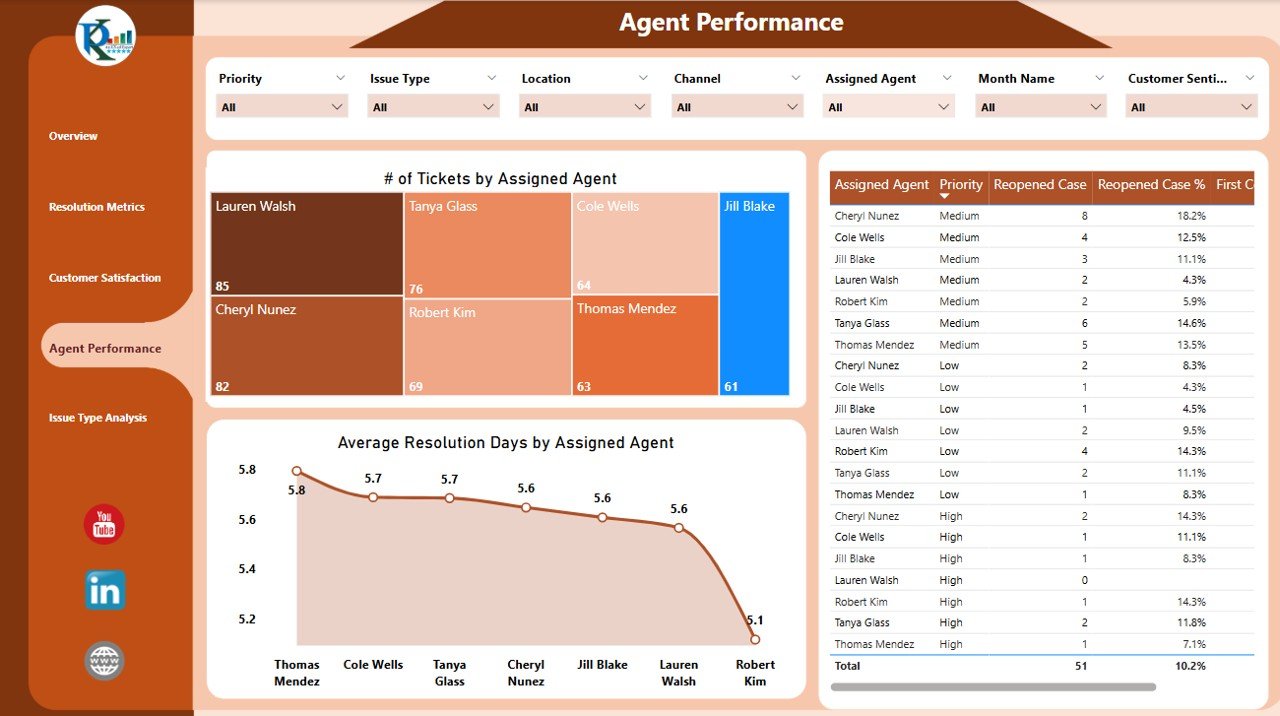
👩💼 4. Agent Performance Sheet Tab
-
Track:
-
of Tickets per Agent
-
Average Resolution Days per Agent
-
Satisfaction Score per Agent
-
Use this to balance workloads, guide training, and boost team productivity.
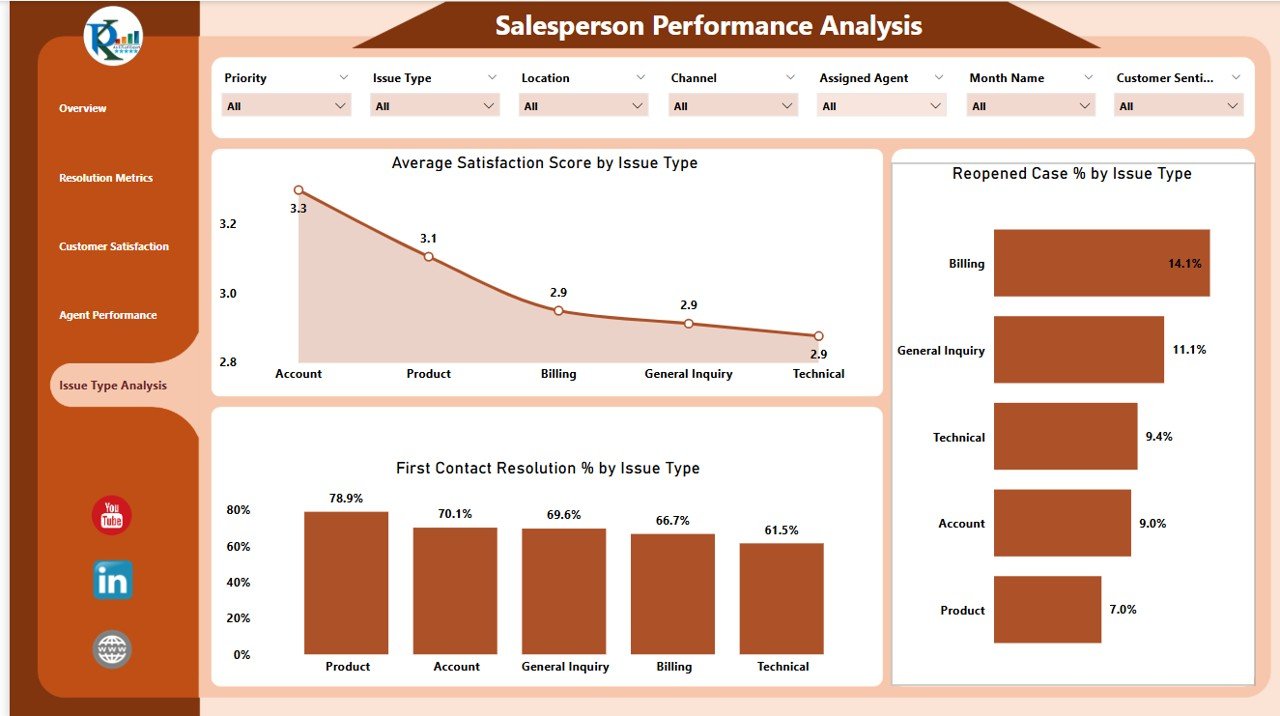
🛠 5. Issue Type Analysis Sheet Tab
-
Charts for:
-
Avg. Satisfaction Score by Issue Type
-
Reopened Case % by Issue Type
-
First Contact Resolution % by Issue Type
-
Discover patterns in recurring problems and reduce ticket volumes over time.
🚀 Advantages of Using This Power BI Dashboard
📈 Real-Time Insights
Get up-to-date performance data with every refresh.
🎯 Custom Filters & Slicers
Slice and dice by date, region, priority, or agent to find targeted answers quickly.
💡 Comprehensive Monitoring
Track everything from tickets to trends in satisfaction—all in one centralized tool.
📊 Visually Engaging Layout
Cards, charts, and tables bring your customer support KPIs to life.
📉 Informed Decision-Making
Make strategic improvements based on facts—not assumptions.
🎯 Best Practices for Success
✔️ Update data regularly for accurate insights
✔️ Monitor KPIs like First Contact Resolution & Satisfaction Score
✔️ Use Agent Performance data to improve team training
✔️ Share dashboard with stakeholders for transparent reporting
✔️ Schedule weekly reviews to act on real-time trends
👥 Who Should Use This Dashboard?
-
🧑💼 Customer Support Managers
-
📞 Call Center Supervisors
-
🧮 Business Intelligence Analysts
-
🏢 Operations Teams
-
📊 CX Strategists
Whether you’re managing a local helpdesk or a global support team, this tool is essential for keeping service quality high and customers happy.
Read the detailed blog post
📺 Learn How to Use It
Watch the full step-by-step video tutorial on our YouTube channel:
🔗 youtube.com/@PKAnExcelExpert


Reviews
There are no reviews yet.