Credit card companies operate in a fast-moving and highly competitive financial environment where data drives every decision. Organizations must continuously monitor transaction volumes, approval rates, customer satisfaction, fraud indicators, and revenue streams to remain competitive. However, many financial teams still rely on scattered spreadsheets and manual reports, making performance analysis slow and difficult.
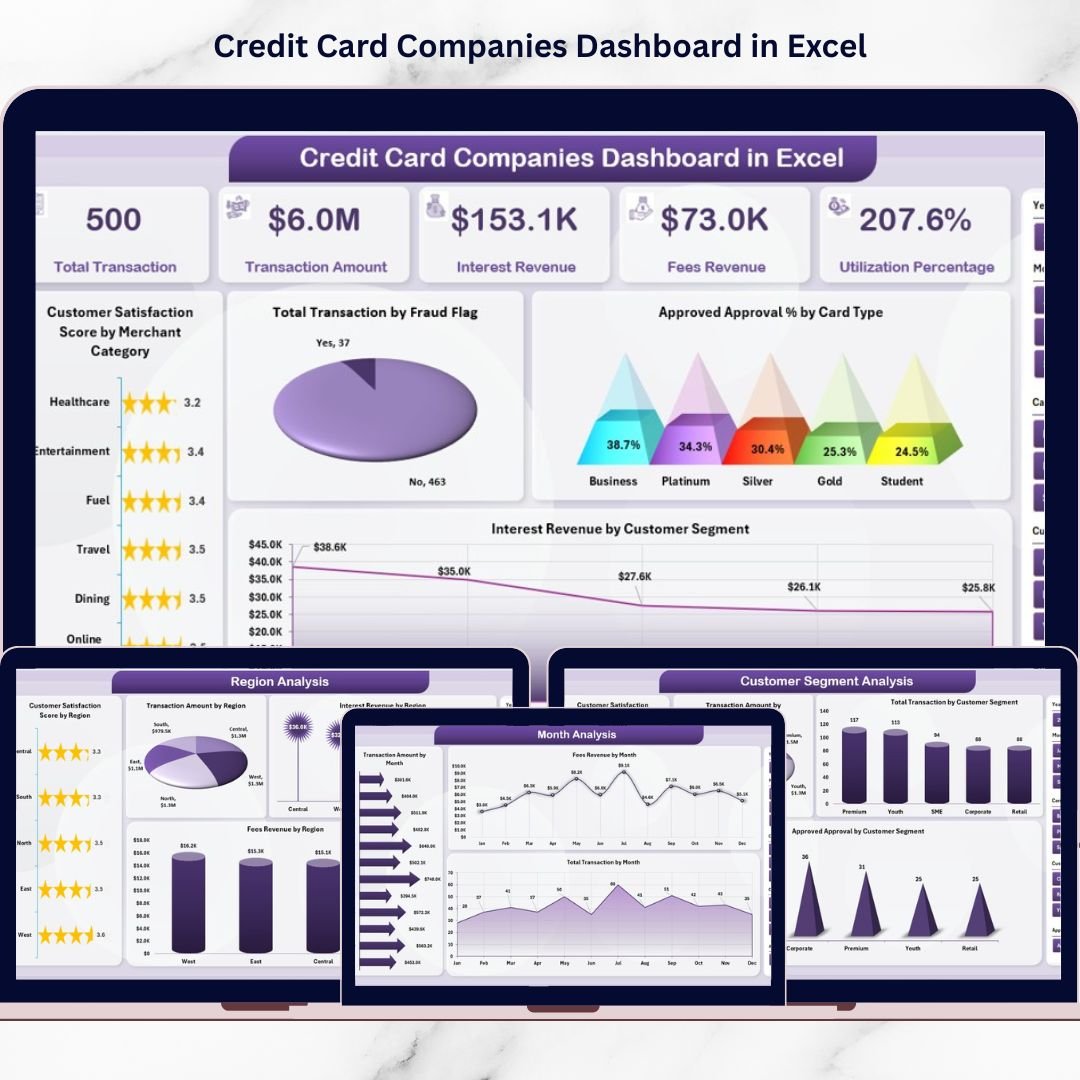
The Credit Card Companies Dashboard in Excel is a ready-to-use analytical solution designed to transform complex transaction data into clear, actionable insights. Instead of reviewing multiple reports separately, managers and analysts can monitor all key performance indicators (KPIs) from one centralized dashboard powered entirely by Excel.
This professionally structured dashboard combines Pivot Tables, slicers, KPI cards, and interactive charts to deliver real-time visibility into credit card operations. As a result, decision-makers quickly identify trends, evaluate customer behavior, analyze revenue performance, and improve operational efficiency without needing expensive business intelligence software.
Whether you manage credit card operations, financial analytics, customer experience monitoring, or revenue tracking, this dashboard enables faster, smarter, and data-driven decision-making.
🚀 Key Feature of Credit Card Companies Dashboard in Excel
📊 Centralized Financial Performance Monitoring
Track transactions, approvals, customer satisfaction, and revenue metrics in one unified dashboard.
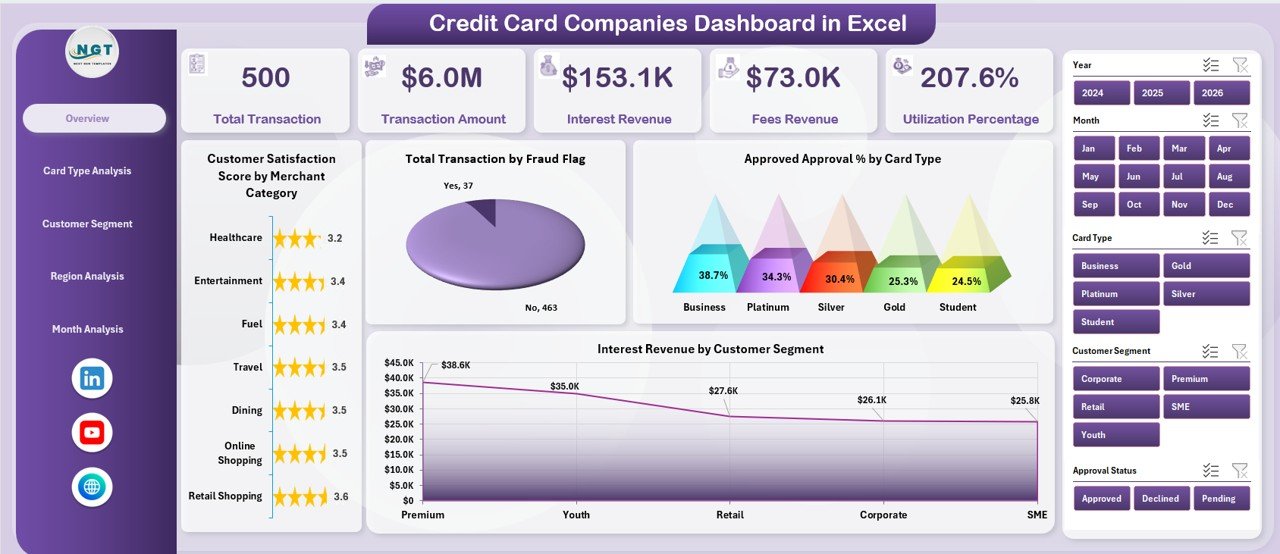
🎯 Executive KPI Overview Page
View major performance indicators instantly using KPI cards and interactive charts.
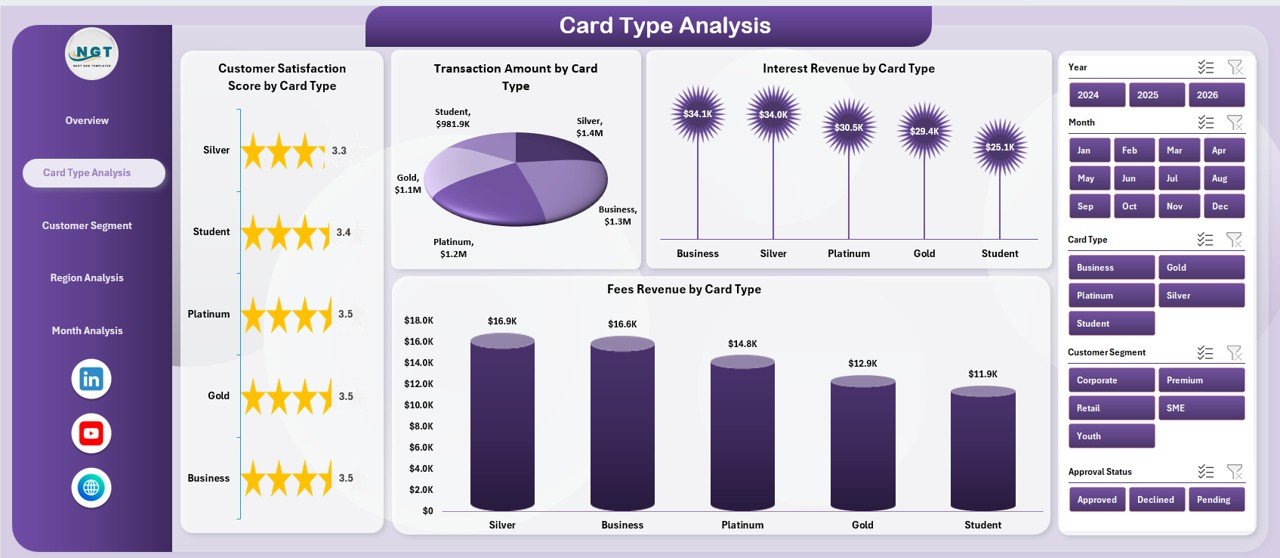
💳 Card Type Performance Analysis
Compare revenue, transaction amounts, and satisfaction levels across different card categories.
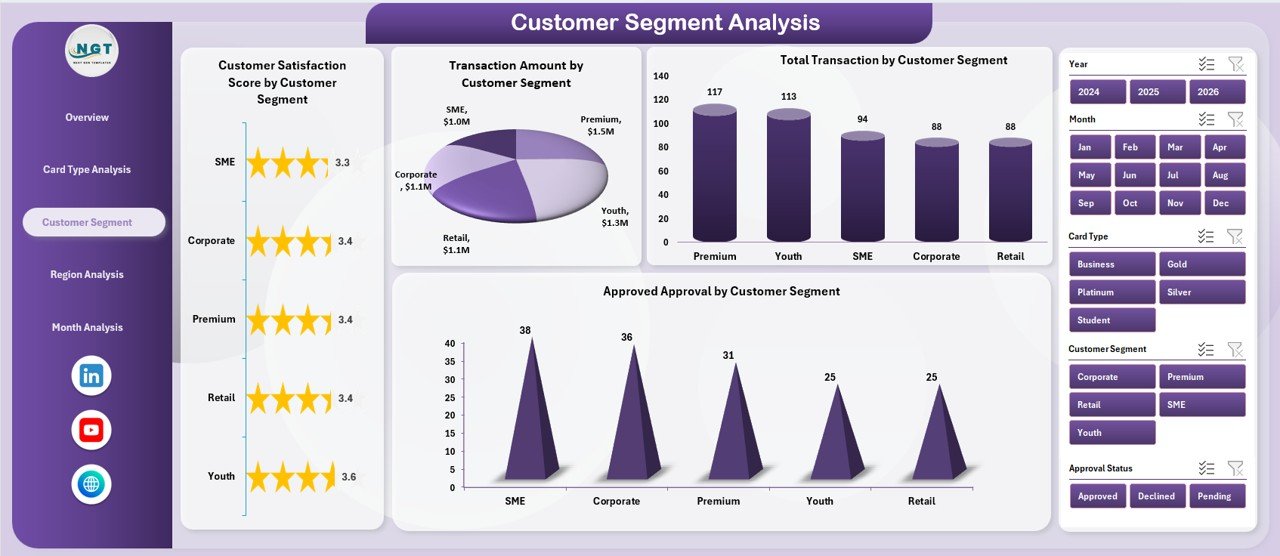
👥 Customer Segment Insights
Analyze spending behavior and approval trends by customer groups.
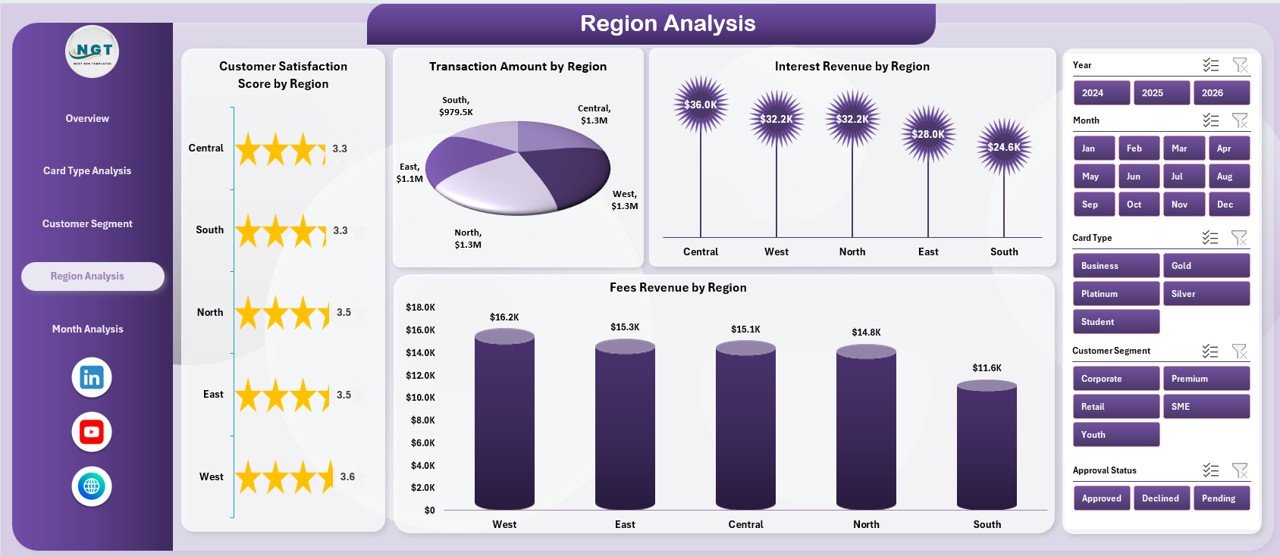
🌍 Regional Performance Monitoring
Evaluate geographic performance differences to support strategic planning.
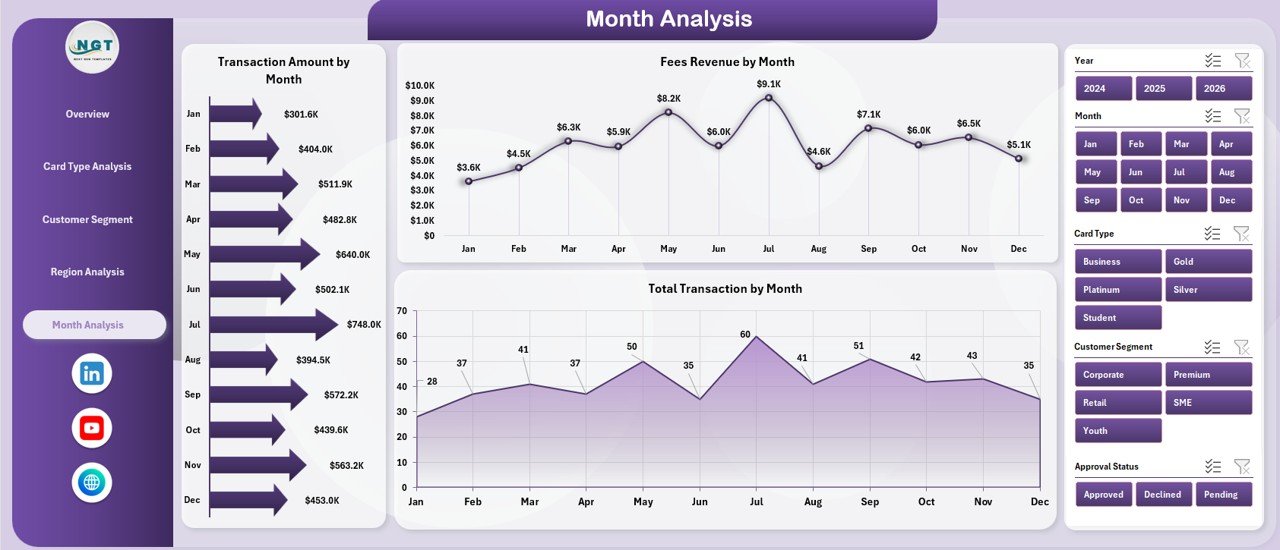
📅 Monthly Trend Analysis
Identify seasonal transaction and revenue patterns for forecasting.
🔎 Interactive Slicers & Filters
Filter dashboards dynamically without manual reporting adjustments.
⚡ Automated Excel Calculations
Update data once and refresh Pivot Tables to instantly update visuals.
📦 What’s Inside the Credit Card Companies Dashboard in Excel
This ready-to-use Excel template includes a complete analytics framework:
✅ Five Interactive Dashboard Pages
-
Overview Page
-
Card Type Analysis
-
Customer Segment Analysis
-
Region Analysis
-
Month Analysis
✅ Page Navigator for Easy Navigation
✅ Interactive KPI Cards & Pivot Charts
✅ Dynamic Slicers for Flexible Analysis
✅ Structured Data Sheet for Transaction Input
✅ Support Sheet for Calculations & Automation
Simply enter your transaction data and begin analyzing instantly.
🛠️ How to Use the Credit Card Companies Dashboard in Excel
The dashboard is designed for easy implementation:
1️⃣ Upload transaction data into the Data Sheet.
2️⃣ Maintain consistent categories for card type and customer segment.
3️⃣ Refresh Pivot Tables after updating data.
4️⃣ Apply slicers to filter performance analysis.
5️⃣ Navigate between pages using the Page Navigator.
6️⃣ Review KPIs and charts to identify trends and insights.
No advanced Excel expertise is required — automation handles calculations and visualization.
👥 Who Can Benefit from This Credit Card Companies Dashboard in Excel
This dashboard is ideal for financial and analytics professionals:
🏦 Credit Card Issuing Banks
📊 Financial Analysts & Reporting Teams
💼 Revenue Management Departments
🛡 Risk & Fraud Monitoring Teams
👥 Customer Experience Managers
📈 Business Strategy & Operations Teams
From small financial teams to enterprise banking operations, this dashboard provides clear performance visibility.
By implementing this dashboard, organizations centralize analytics, reduce reporting time, enhance customer insights, and improve revenue monitoring. Instead of manually compiling reports, teams gain instant clarity into operational performance and strategic opportunities.
### Click here to read the Detailed blog post
Visit our YouTube channel to learn step-by-step video tutorials:
👉 https://youtube.com/@PKAnExcelExpert


