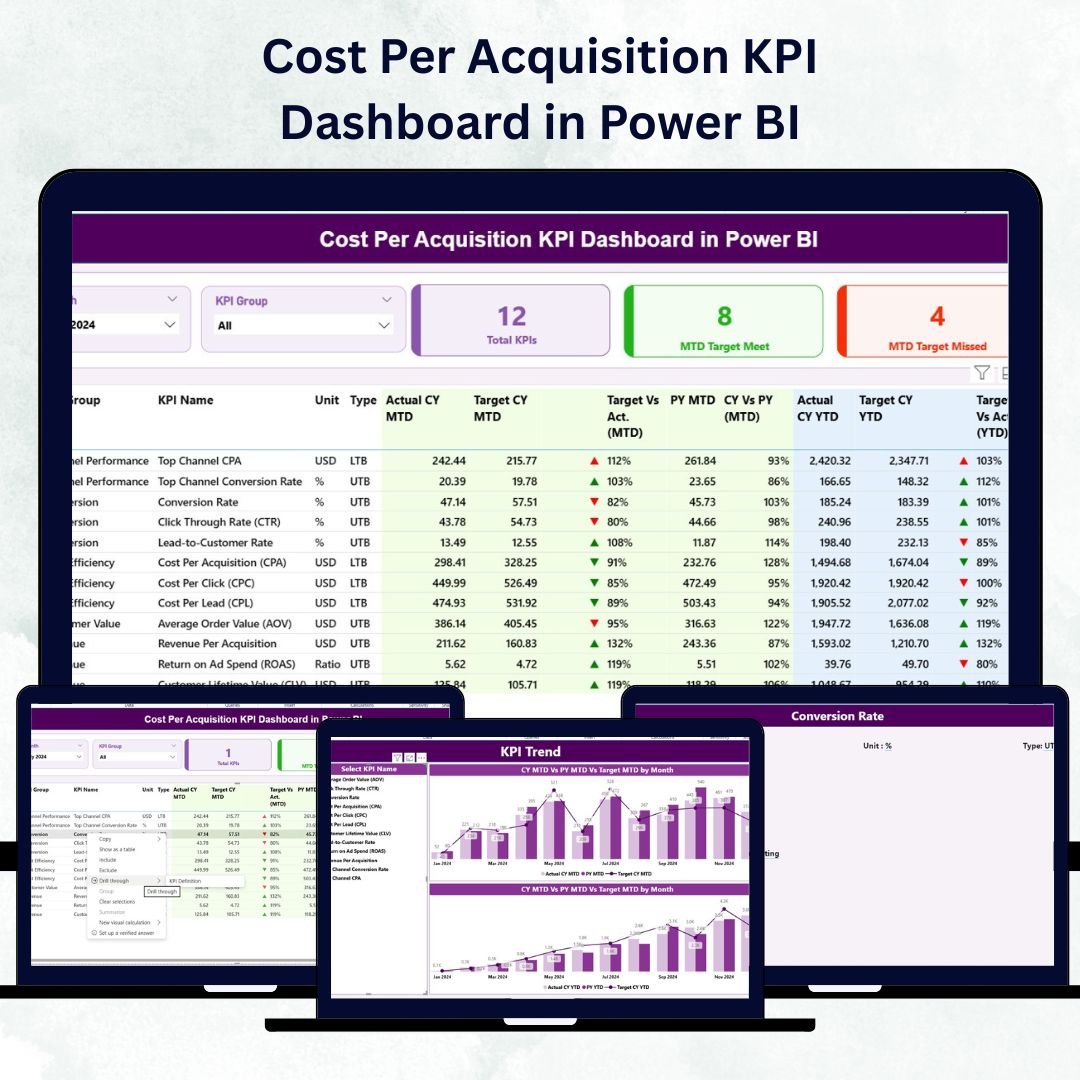
In today’s competitive digital landscape, understanding how much you spend to acquire each customer is the key to marketing profitability. The Cost Per Acquisition (CPA) KPI Dashboard in Power BI is your ultimate tool to analyze marketing efficiency, optimize spending, and maximize ROI — all in one interactive dashboard.
This ready-to-use Power BI template brings together campaign, sales, and budget data into a single view — allowing you to monitor trends, identify high-cost areas, and take action instantly. Whether you’re a marketing manager, analyst, or business leader, this dashboard helps you transform complex data into meaningful insights.Cost Per Acquisition KPI Dashboard in Power BI.
⚡ Key Features of Cost Per Acquisition KPI Dashboard in Power BI
✨ Three Dynamic Pages for Complete Analysis
Includes Summary, KPI Trend, and KPI Definition pages to analyze data from multiple perspectives.
📊 Real-Time Visualization
Track Month-to-Date (MTD) and Year-to-Date (YTD) acquisition costs with instant updates using slicers for Month and KPI Group.Cost Per Acquisition KPI Dashboard in Power BI
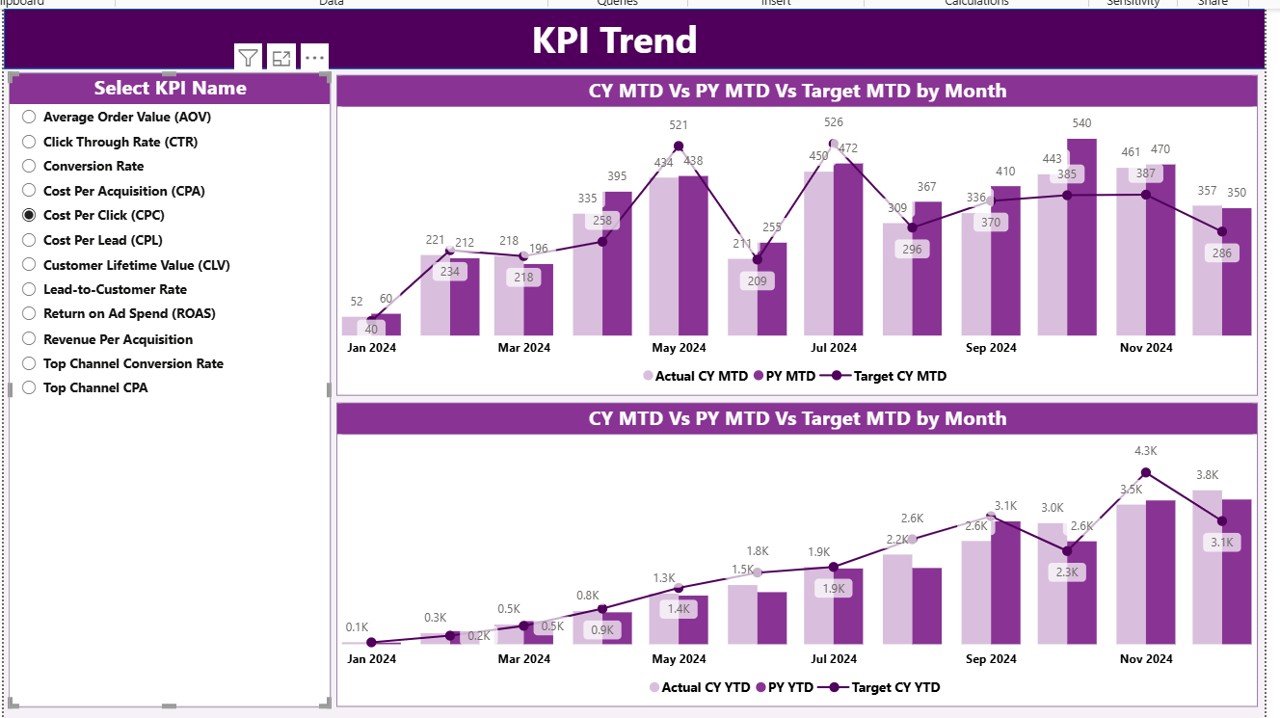
📈 Interactive Trend Charts
Compare Actual vs Target vs Previous Year performance using combo charts for both monthly and yearly views.
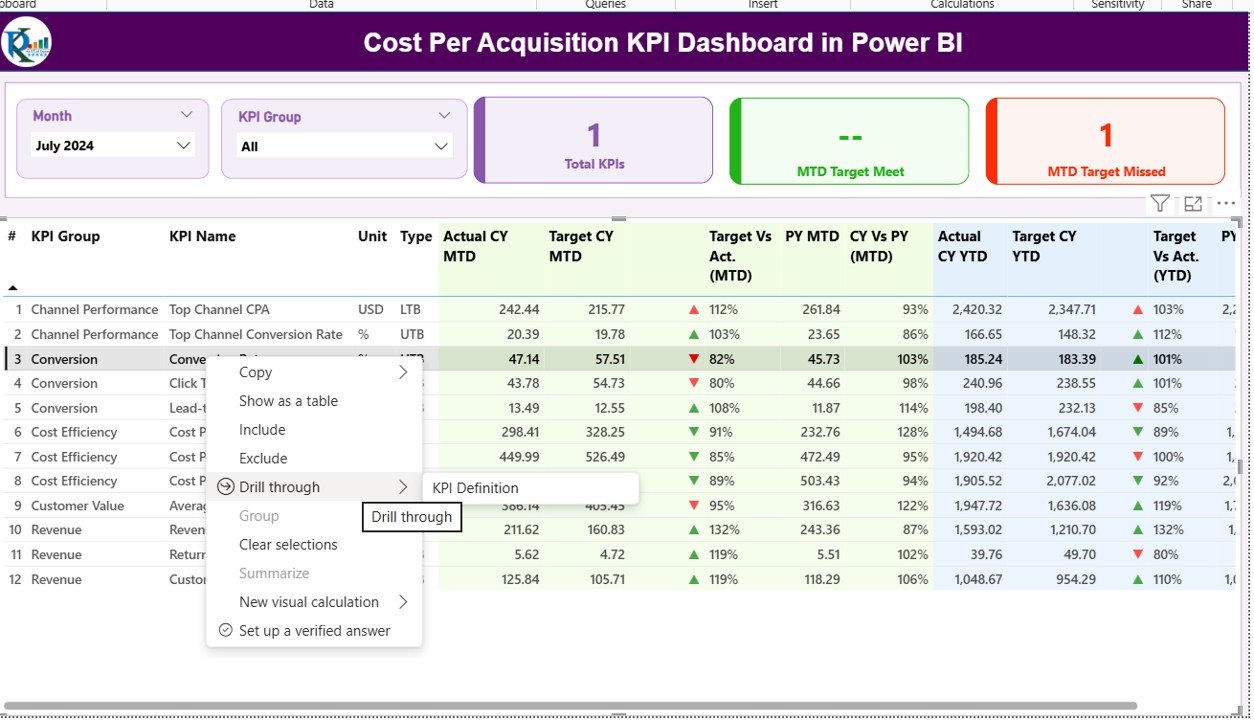
📋 KPI Drill-Through Functionality
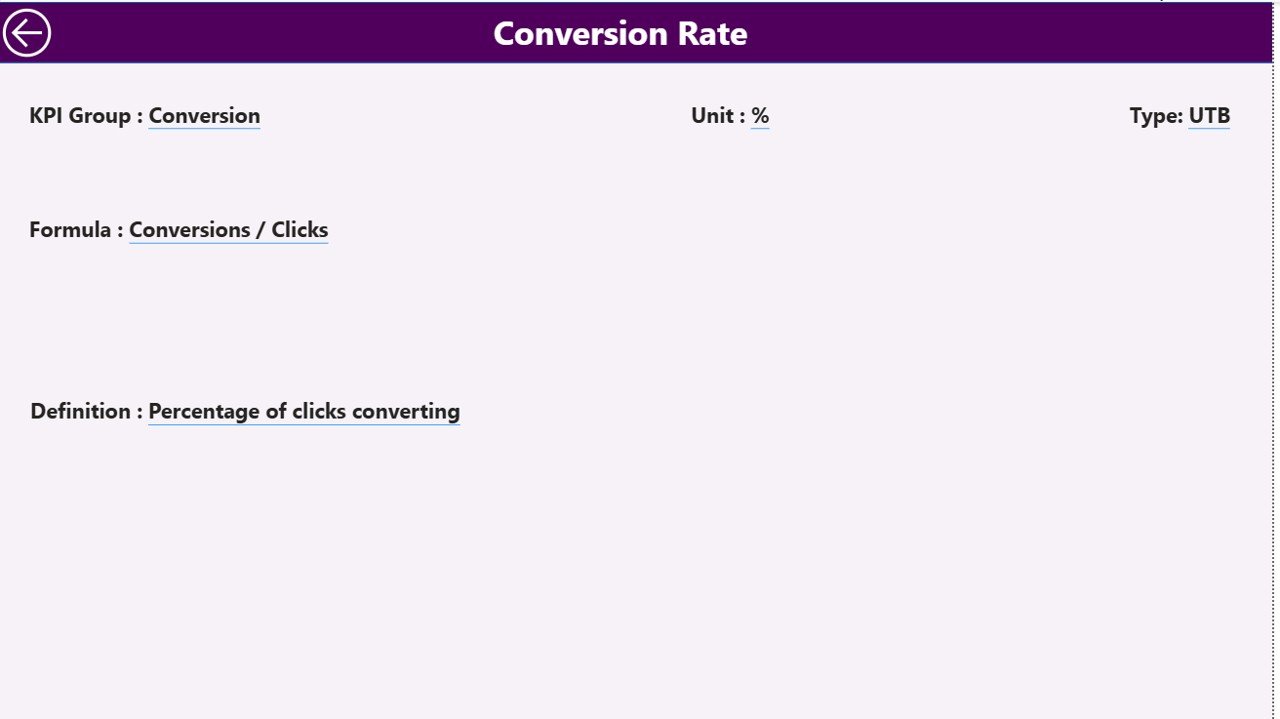
Click on any KPI to view its formula, definition, and logic for deeper understanding.
🎯 Conditional Formatting with Icons
Instantly identify performance gaps using green ▲ (target met) and red ▼ (target missed) visual indicators.
💾 Excel-Powered Data Source
Easily update KPI data, targets, and definitions in Excel — Power BI automatically refreshes your visuals.
🔐 Data Accuracy and Integrity
Structured datasets ensure your dashboard updates seamlessly without breaking visuals.
🚀 User-Friendly Navigation
Built with slicers, back buttons, and consistent formatting for smooth usability — even for non-technical users.
📂 What’s Inside the Cost Per Acquisition KPI Dashboard in Power BI
The Power BI file contains three core analytical pages and a linked Excel dataset:
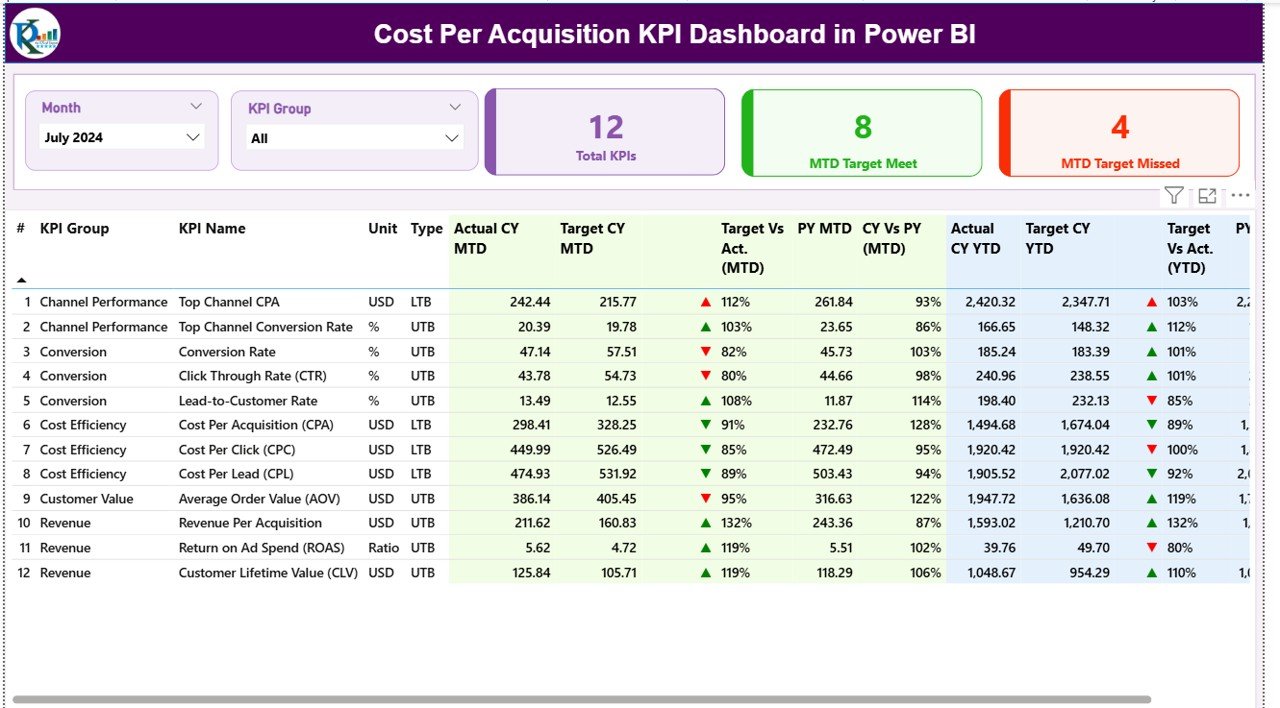
1️⃣ Summary Page – The main performance hub showing total KPIs, MTD target met/missed counts, and a detailed performance table.
2️⃣ KPI Trend Page – Displays dual combo charts for MTD and YTD data comparison with KPI selection slicer.
3️⃣ KPI Definition Page – A drill-through view showing KPI Number, Group, Formula, Definition, Unit, and Type (UTB/LTB).
📘 Excel Data File Structure
-
Input_Actual: Actual MTD and YTD values for each KPI.
-
Input_Target: Target MTD and YTD values for comparison.
-
KPI Definition: All KPI details with formula and definition.Cost Per Acquisition KPI Dashboard in Power BI
This structure makes it simple to maintain — just update the Excel sheets and refresh Power BI to see real-time insights.
🧩 How to Use the Cost Per Acquisition KPI Dashboard in Power BI
1️⃣ Open the Power BI file and connect it to your Excel dataset.
2️⃣ Select a Month or KPI Group from slicers to dynamically update visuals.
3️⃣ Analyze MTD & YTD Comparisons to see if acquisition costs are improving.
4️⃣ Drill Through to view KPI definitions and calculation logic.
5️⃣ Use Conditional Icons to spot underperforming KPIs instantly.
6️⃣ Export Visuals to share with management or clients for decision-making.Cost Per Acquisition KPI Dashboard in Power BI
💡 Tip: Automate your data refresh schedule to keep your dashboard always up to date.
👩💼 Who Can Benefit from This Cost Per Acquisition KPI Dashboard in Power BI
💼 Marketing Teams – Evaluate campaign ROI, lead costs, and conversion efficiency.
📈 Sales Teams – Track cost per closed deal and identify profitable channels.
💰 Finance Departments – Validate marketing spend and ensure cost alignment.
🏢 Executives & Founders – Monitor profitability and strategic ROI across departments.
🧠 Data Analysts – Use DAX-based models to generate deeper insights from CPA trends.
Whether you run a startup or manage a global enterprise, this dashboard empowers you to make smarter, faster, and data-driven decisions about your marketing investments.Cost Per Acquisition KPI Dashboard in Power BI
Click here to read the Detailed blog post
Watch the step-by-step video tutorial:
Visit our YouTube channel for step-by-step video tutorials → PKAnExcelExpert


Reviews
There are no reviews yet.