Communication is no longer just about sending messages — it’s about measuring impact.
If your organization is managing internal updates, PR campaigns, social media posts, newsletters, and events using scattered Excel files and manual reports… you’re operating without full visibility.
Where is the budget going?
Which department overspends?
Which channel drives engagement?
Are campaigns actually delivering results?
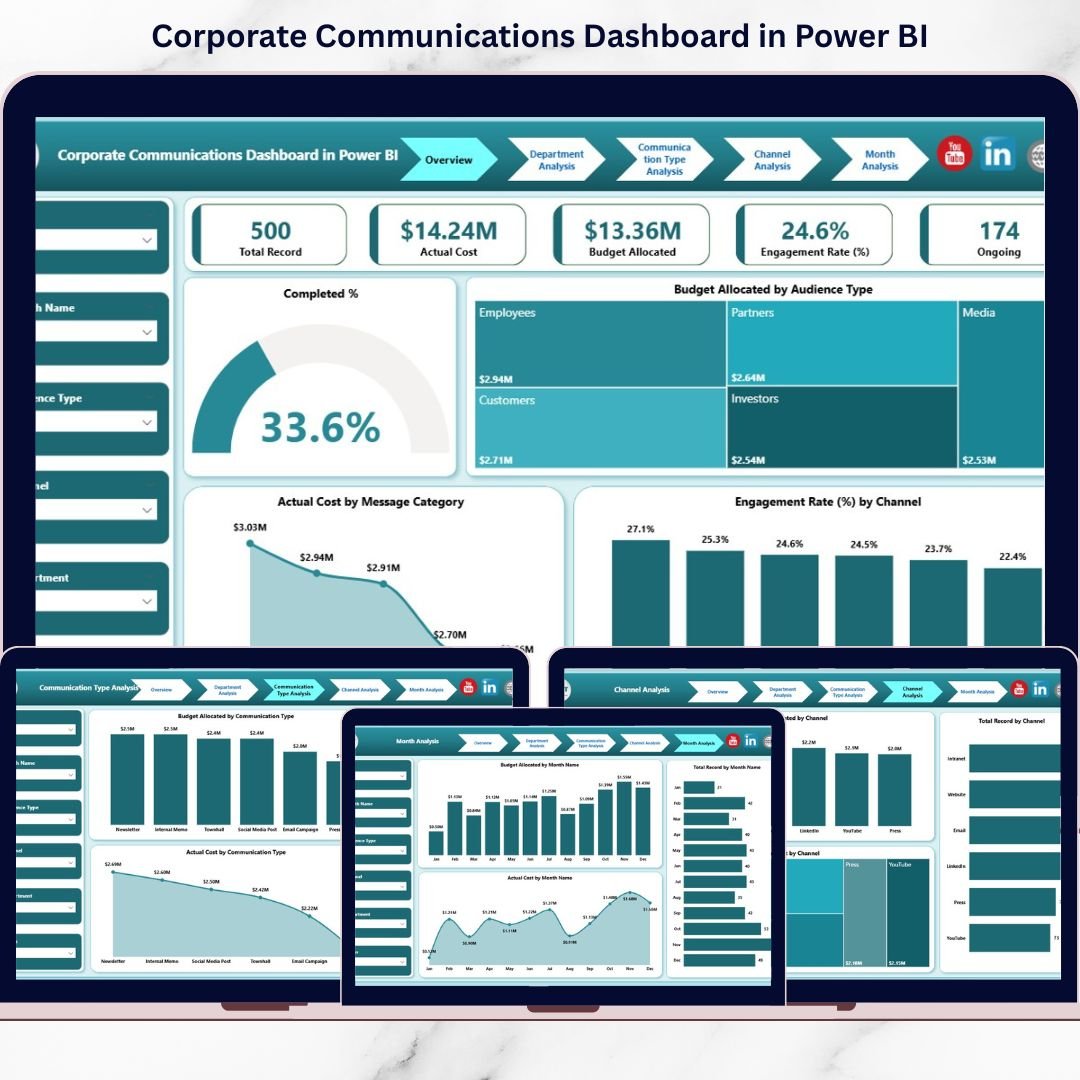
Instead of chasing reports, the Corporate Communications Dashboard in Power BI gives you one centralized, interactive system to monitor budget allocation, actual costs, engagement rate, campaign completion %, and departmental performance — all in real time.
This isn’t just reporting.
This is communication intelligence. 📊🚀
🚀 Key Feature of Corporate Communications Dashboard in Power BI
📊 5 Structured Analytical Pages
Get a complete performance view across Overview, Department, Communication Type, Channel, and Month analysis.
🎯 Budget vs Actual Tracking
Instantly compare allocated budget with actual cost to prevent overspending.
📈 Engagement Rate Monitoring
Measure audience engagement across channels and communication formats.
✅ Completed % Tracking
Monitor how many campaigns are completed vs ongoing.
🏢 Department-Wise Comparison
Evaluate spending and engagement across departments for accountability.
📣 Channel & Communication Type Insights
Identify high-performing platforms and formats.
🎛 Dynamic Slicers
Filter by Month, Department, Channel, Audience Type, and Communication Type instantly.
🔎 Drill-Through & Interactive Visuals
Dive deeper into data without leaving the dashboard.
⚡ Real-Time Data Visualization
Refresh data and get instant updated insights.
📦 What’s Inside the Corporate Communications Dashboard in Power BI
This ready-to-use dashboard includes 5 powerful pages:
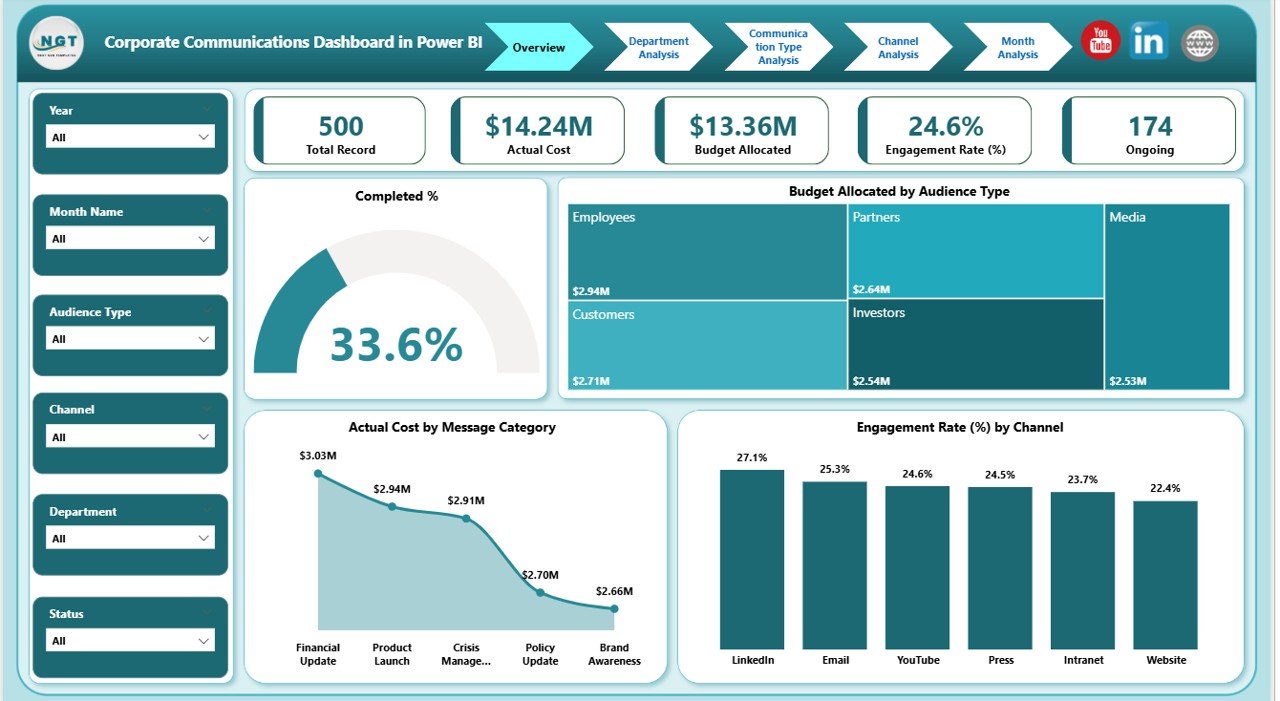
1️⃣ Overview Page – The Command Center
-
5 KPI Cards: Completed %, Total Budget, Total Actual Cost, Engagement Rate %, Total Records
-
Charts:
-
Budget by Audience Type
-
Actual Cost by Message Category
-
Engagement Rate by Channel
-
This page provides a high-level performance snapshot within seconds.
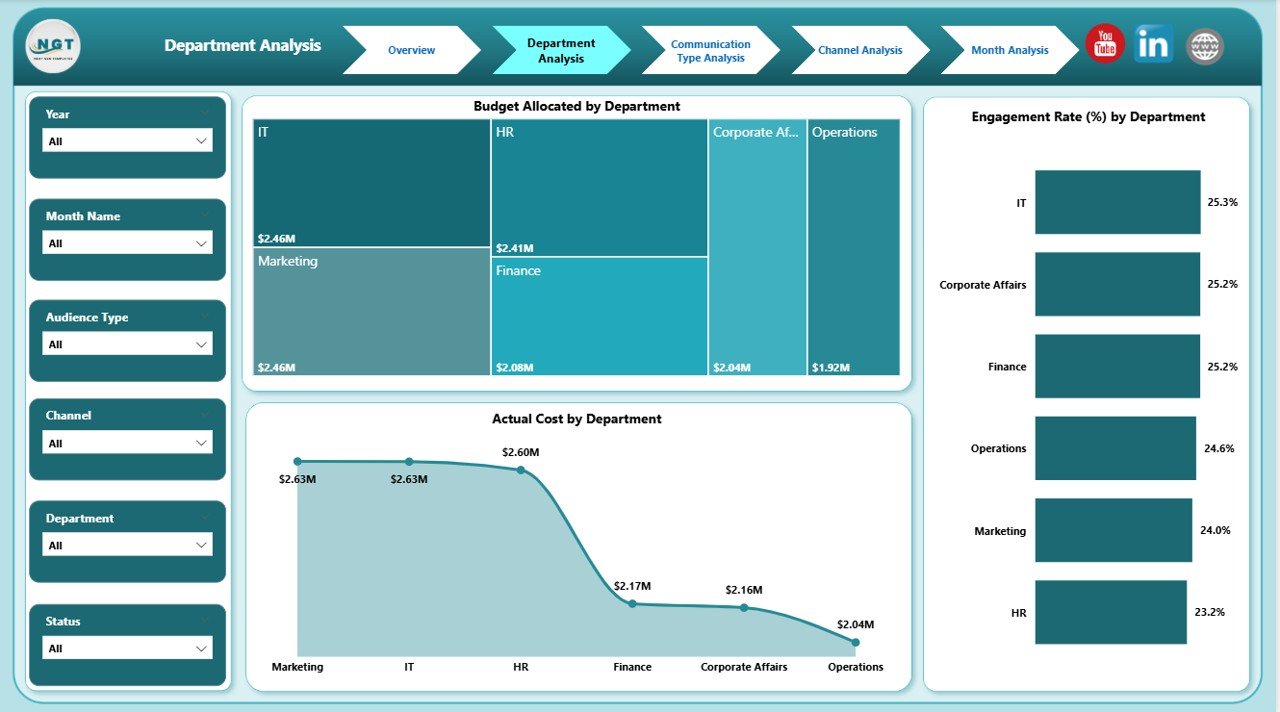
2️⃣ Department Analysis
-
Budget Allocated by Department
-
Actual Cost by Department
-
Engagement Rate by Department
Compare departmental performance and detect inefficiencies instantly.
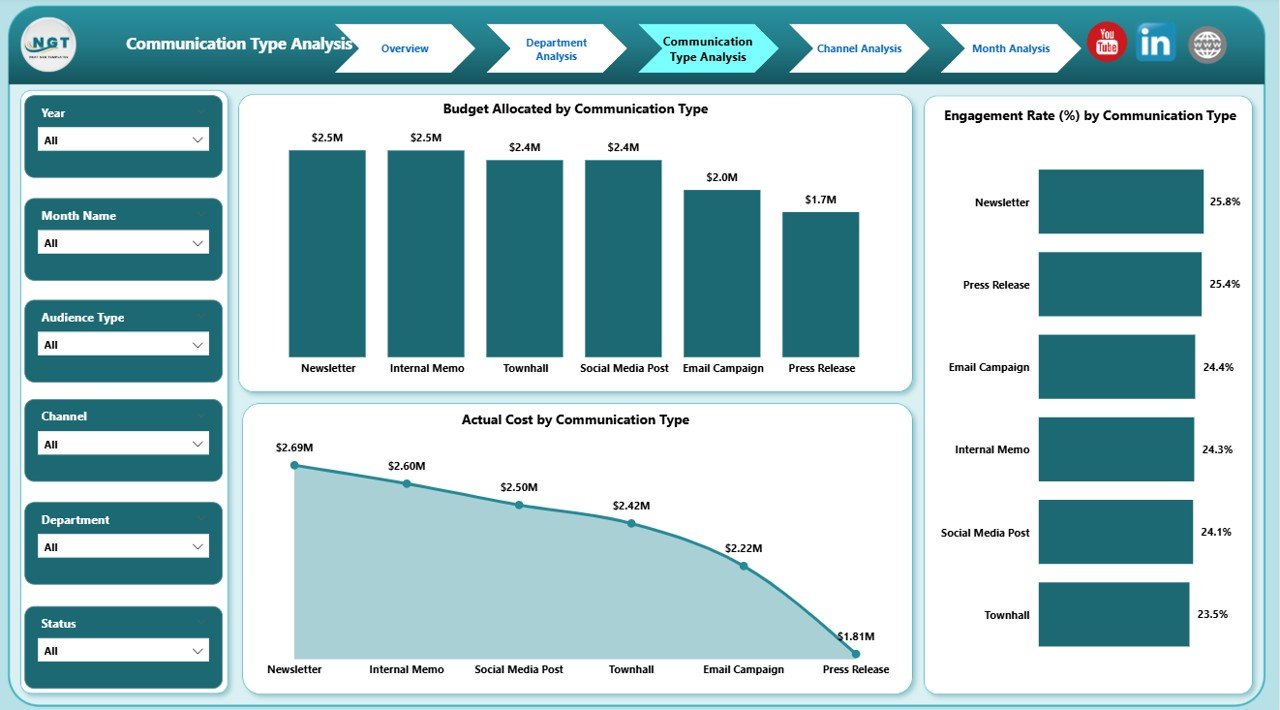
3️⃣ Communication Type Analysis
-
Budget by Communication Type
-
Actual Cost by Communication Type
-
Engagement Rate by Communication Type
Understand which communication formats drive better results.
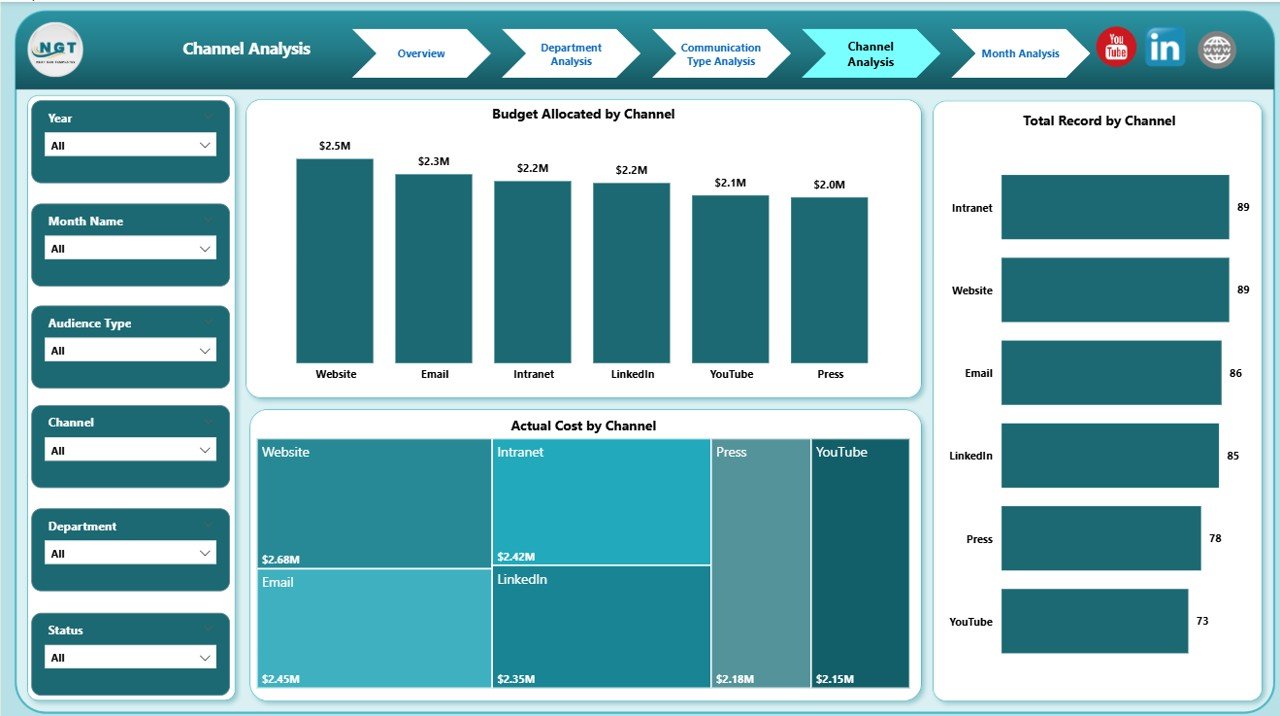
4️⃣ Channel Analysis
-
Budget by Channel
-
Actual Cost by Channel
-
Total Records by Channel
Optimize ROI by focusing on high-performing channels.
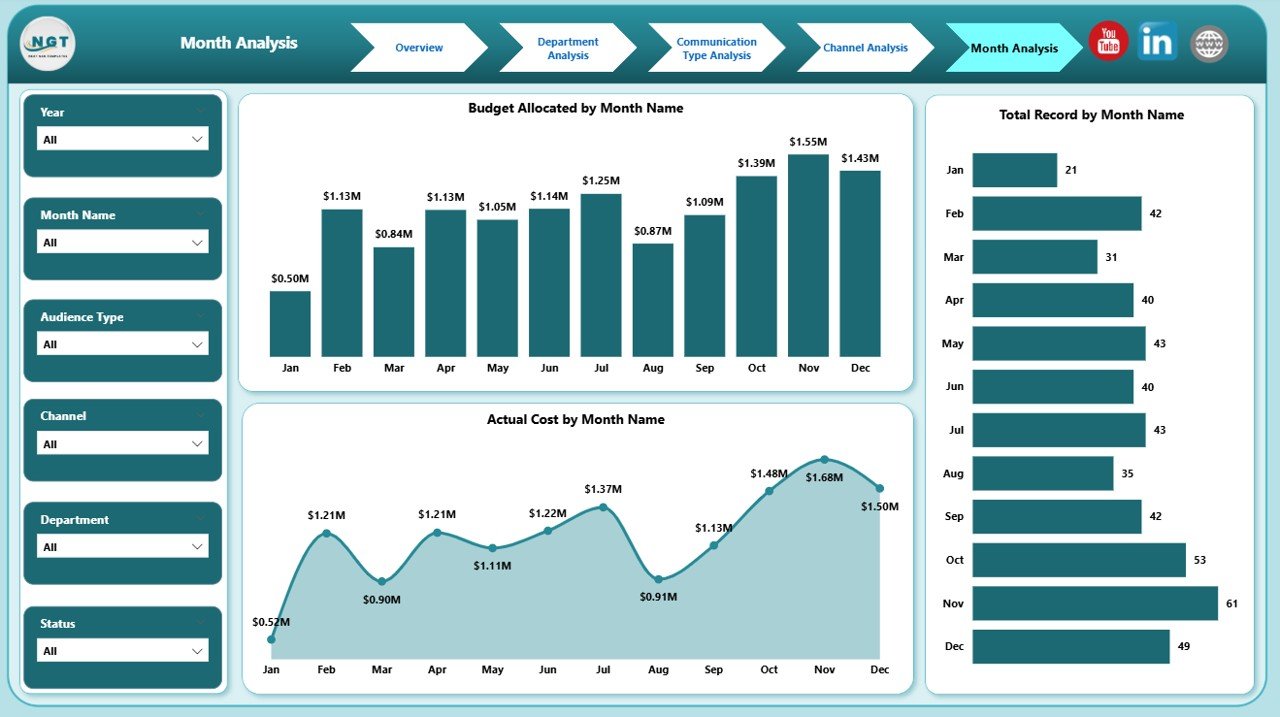
5️⃣ Month Analysis
-
Budget by Month
-
Actual Cost by Month
-
Total Records by Month
Identify trends, seasonal peaks, and long-term patterns for smarter planning.
🛠 How to Use the Corporate Communications Dashboard in Power BI
Using this dashboard is straightforward:
1️⃣ Prepare structured Excel data source
2️⃣ Import data into Power BI
3️⃣ Refresh dataset regularly
4️⃣ Use slicers to filter insights
5️⃣ Start with Overview page
6️⃣ Drill into Department, Channel, or Month analysis
7️⃣ Take action based on insights
No complicated setup. No multiple files. Just centralized performance control.
👥 Who Can Benefit from This Corporate Communications Dashboard in Power BI
This dashboard is ideal for:
📣 Corporate Communication Managers
📊 Marketing Teams
🏢 HR Communication Teams
📰 Public Relations Teams
📈 Corporate Strategy Leaders
💼 CFO & Finance Teams
Whether you are a growing company or a large enterprise, this dashboard gives you clarity and control.
Why This Dashboard Makes a Real Difference
With this dashboard, you can instantly:
-
Detect budget overruns
-
Measure engagement by channel
-
Compare department performance
-
Monitor campaign completion rate
-
Track monthly communication trends
-
Improve ROI through better allocation
Instead of reactive decisions, you gain proactive control.
Communication becomes measurable.
Budget becomes controlled.
Performance becomes transparent.
That’s the competitive advantage. 🔥
Click here to read the Detailed blog post
Visit our YouTube channel to learn step-by-step video tutorials
YouTube Channel