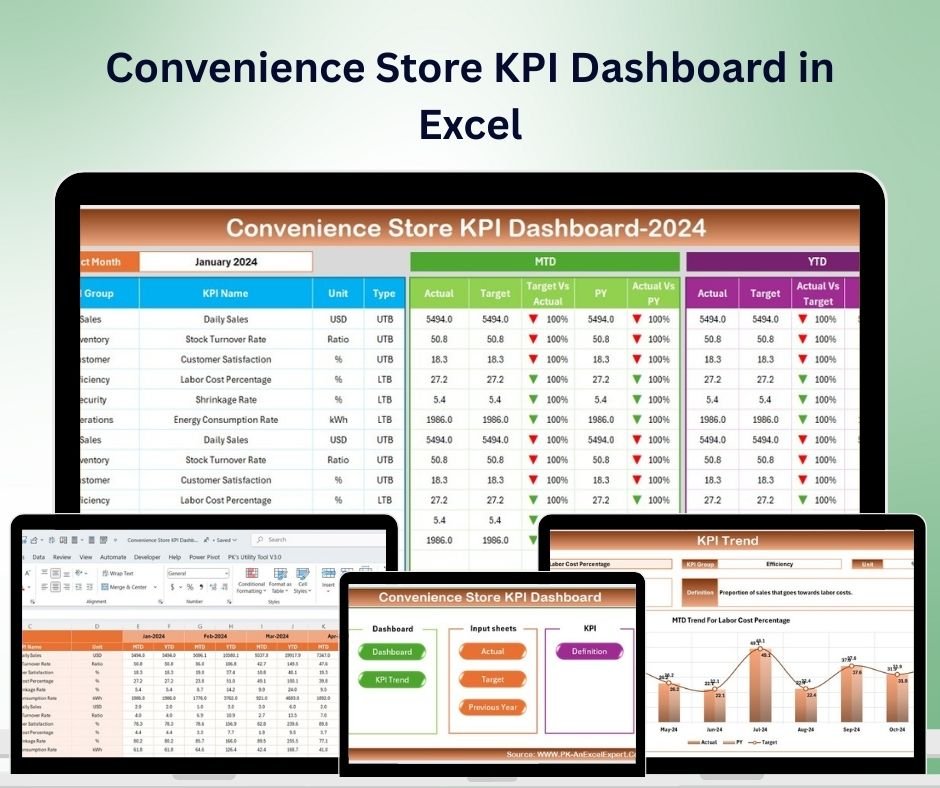

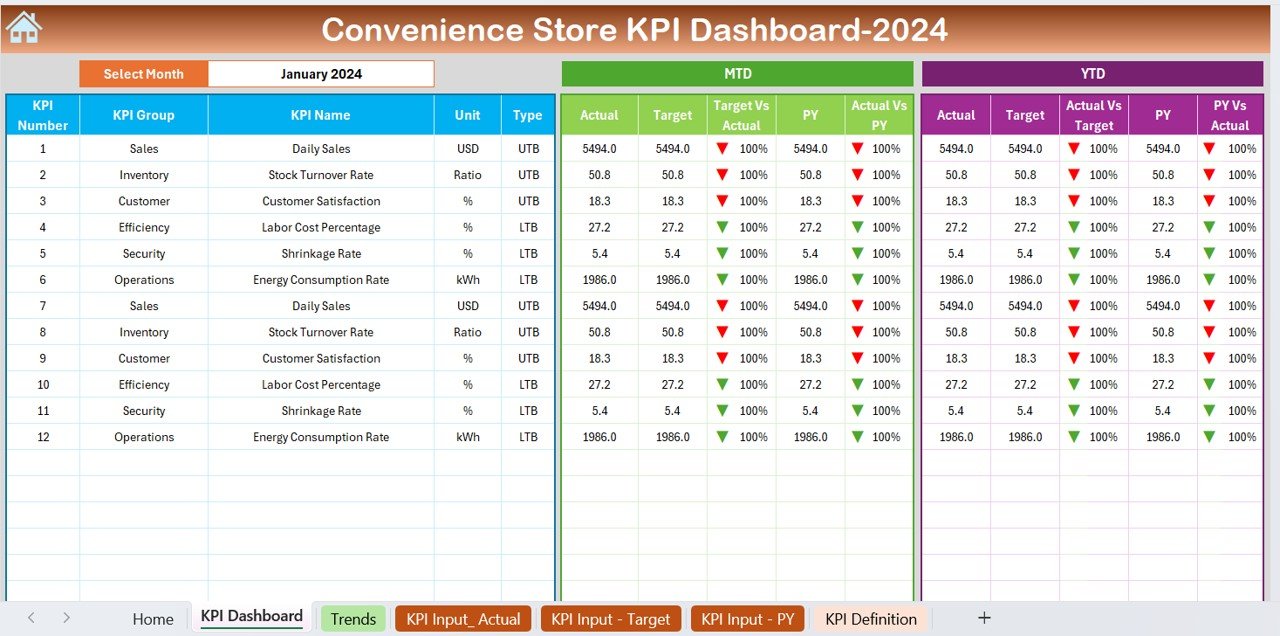
The Convenience Store KPI Dashboard in Excel is a robust tool designed for convenience store owners, managers, and analysts to track key performance indicators (KPIs) essential for optimizing store operations, improving sales, and enhancing customer satisfaction. This Excel-based dashboard allows you to monitor daily sales performance, inventory turnover, employee productivity, and other vital metrics to ensure your store operates efficiently and profitably.
With easy-to-use features, real-time data tracking, and customizable reports, this dashboard helps you make data-driven decisions that improve your store’s performance and customer service.
Key Features of the Convenience Store KPI Dashboard in Excel:
💰 Sales Performance Tracking
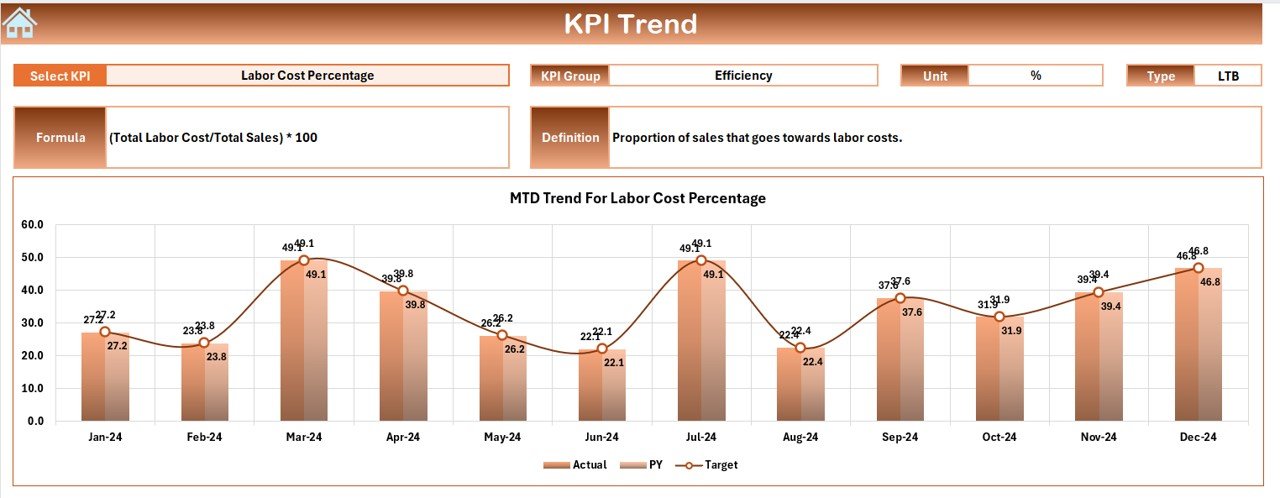
Monitor daily, weekly, and monthly sales to identify trends, track top-selling products, and measure performance against sales targets.
📦 Inventory Management
Track stock levels, monitor inventory turnover, and manage stock-outs to ensure that your store is well-stocked and that high-demand products are always available.
👥 Employee Productivity
Measure employee performance based on key metrics like sales per employee, customer service, and task completion to ensure optimal staff productivity.
📊 Profit and Margin Analysis
Track revenue, cost of goods sold (COGS), and profit margins to ensure your store is financially sustainable and performing well.
📈 Customer Satisfaction and Retention
Monitor customer satisfaction scores, track repeat business, and assess customer feedback to improve service quality and retain loyal customers.
🚀 Why You’ll Love the Convenience Store KPI Dashboard in Excel:
✅ Track Sales and Inventory – Easily monitor sales performance and inventory levels to ensure your store is stocked and profitable.
✅ Optimize Employee Productivity – Measure employee performance and productivity to ensure that your team is meeting sales targets and providing excellent customer service.
✅ Monitor Profitability – Track revenue, costs, and profit margins to ensure your store is financially healthy and operating efficiently.
✅ Improve Customer Satisfaction – Track customer satisfaction and retention to provide high-quality service and ensure customers keep coming back.
✅ User-Friendly Interface – The Excel format is simple and intuitive, allowing you to quickly update data and get actionable insights.
✅ Customizable and Interactive – Tailor the dashboard to your specific needs with real-time data updates and custom reports.
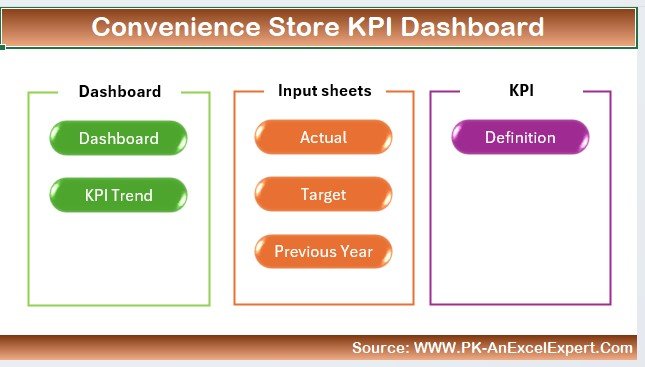
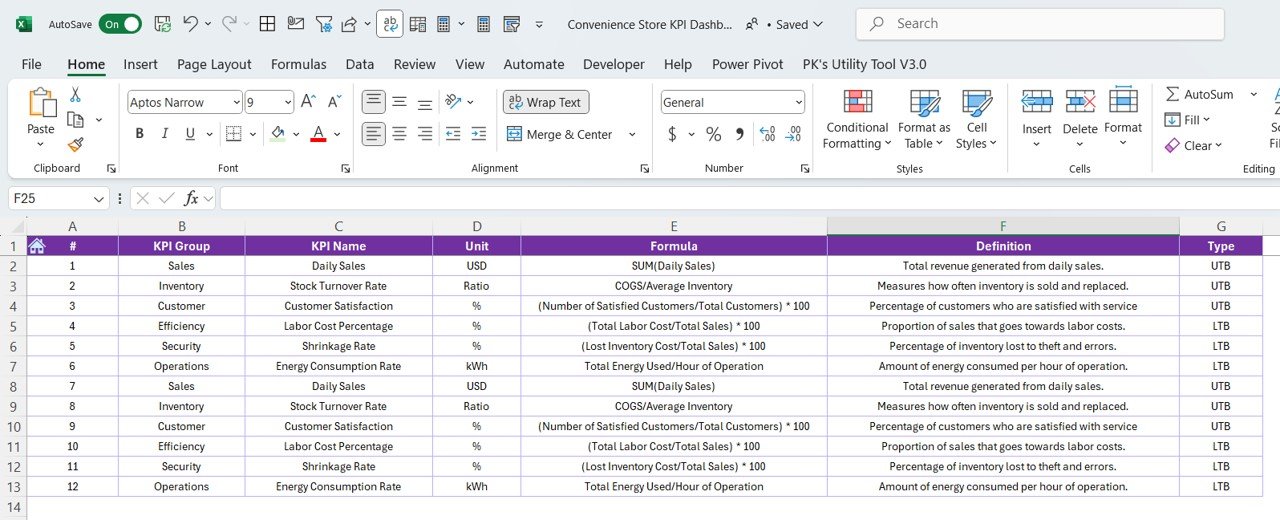
What’s Inside the Convenience Store KPI Dashboard in Excel:
-
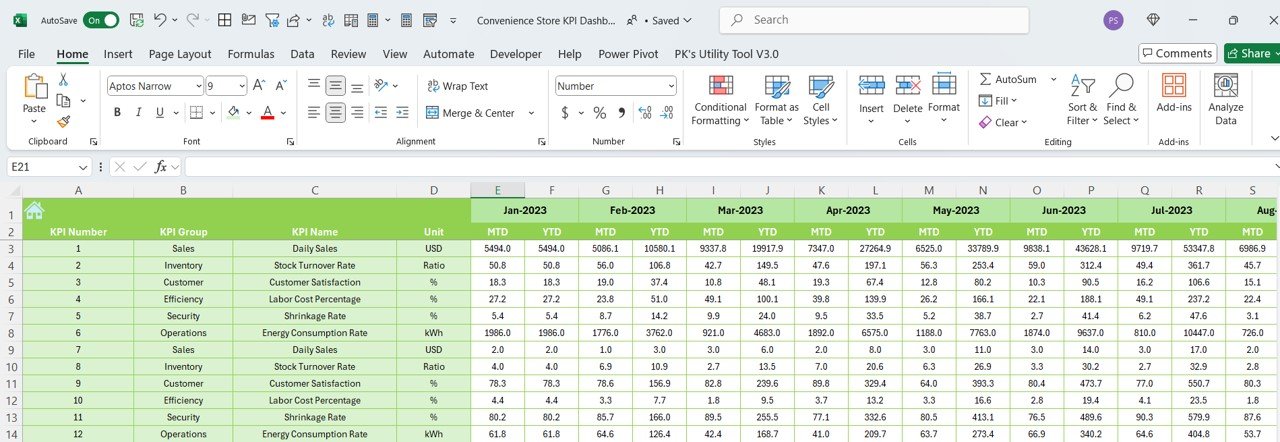
Sales Performance: Track daily, weekly, and monthly sales and compare actual performance with targets to measure growth.
-
Inventory Management: Monitor inventory turnover, stock levels, and track which products are selling the most to prevent stockouts.
-
Employee Productivity: Track staff performance, sales per employee, and customer satisfaction to ensure optimal employee output.
-
Profit and Margin Analysis: Track revenue, COGS, and profit margins to ensure that your store is financially sustainable.
-
Customer Retention: Measure customer loyalty, satisfaction, and repeat business to improve customer service and increase retention.
-
Custom Reports: Generate detailed reports on sales, inventory, employee performance, and customer satisfaction for more detailed analysis.
How to Use the Convenience Store KPI Dashboard in Excel:
1️⃣ Download the Template – Instantly access your Excel file upon purchase.
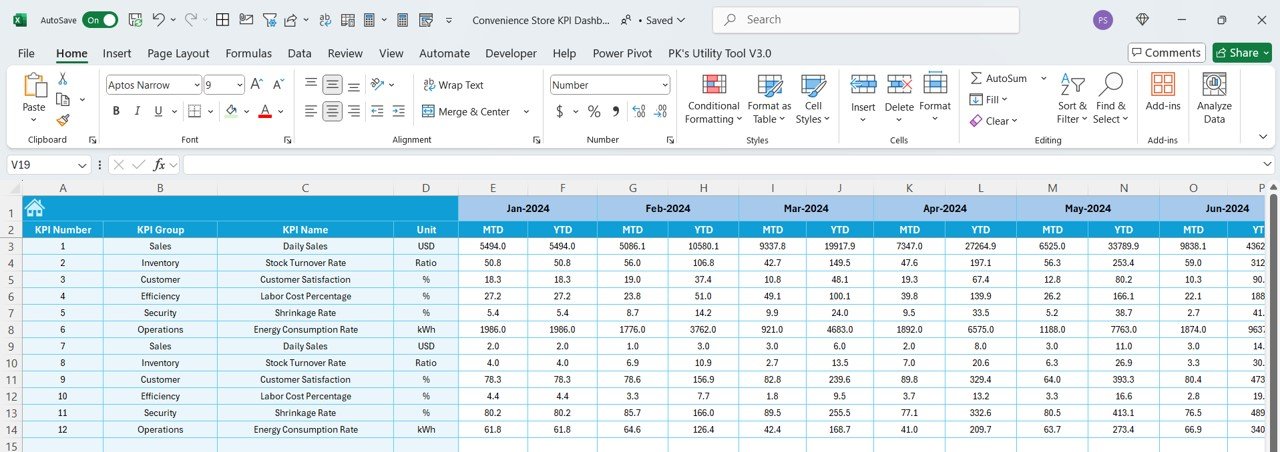
2️⃣ Input Sales and Inventory Data – Add your sales, inventory, and employee performance data to start tracking KPIs.
3️⃣ Monitor Sales Performance – Use the dashboard to track daily, weekly, and monthly sales performance and identify areas for improvement.
4️⃣ Manage Inventory – Keep track of stock levels, identify high-demand products, and prevent stockouts to ensure your shelves are always stocked.
5️⃣ Evaluate Employee Productivity – Measure employee performance and optimize your team’s productivity to meet sales targets.
6️⃣ Track Customer Satisfaction – Monitor customer satisfaction scores and repeat business to enhance customer experience and retention.
7️⃣ Generate Custom Reports – Create reports to analyze key data and optimize your convenience store’s operations.
Who Can Benefit from the Convenience Store KPI Dashboard in Excel:
-
Convenience Store Owners and Managers
-
Retail Store Managers
-
Financial Analysts in Retail
-
Sales and Marketing Teams
-
Inventory Managers
-
Operations Managers
-
Customer Service Teams
-
HR Managers
-
Business Consultants in Retail
The Convenience Store KPI Dashboard in Excel is an essential tool for managing and optimizing the performance of your convenience store. By tracking key metrics such as sales, inventory levels, employee productivity, and customer satisfaction, this dashboard helps you improve operational efficiency, increase profitability, and enhance customer service.
Click here to read the Detailed blog post
https://www.pk-anexcelexpert.com/convenience-store-kpi-dashboard-in-excel/
Visit our YouTube channel to learn step-by-step video tutorials
Youtube.com/@PKAnExcelExpert


Reviews
There are no reviews yet.