
🔑 Key Features of Content Creator Revenue Dashboard in Power BI
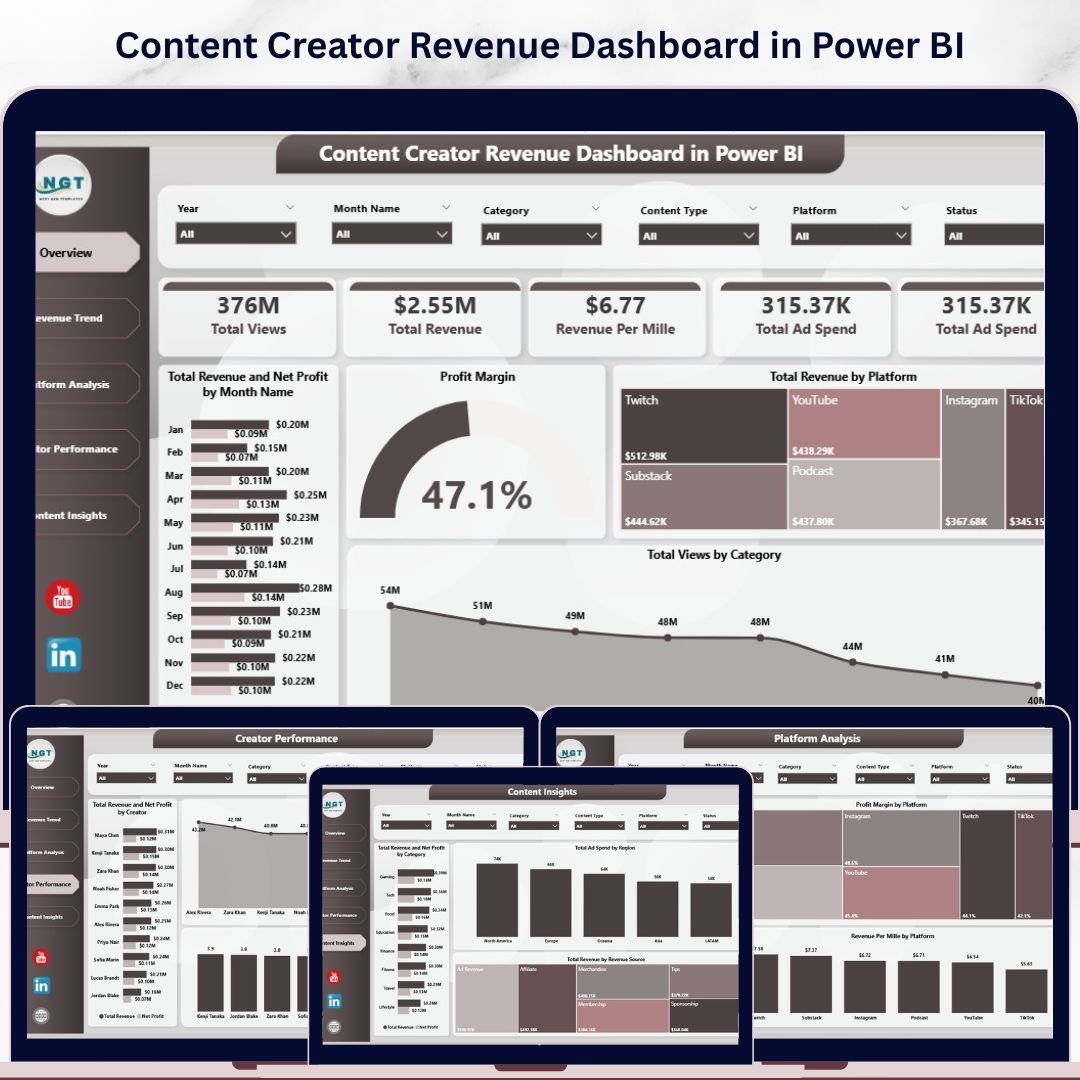
Content Creator Revenue Dashboard in Power BI is a professionally designed, ready-to-use Power BI template built for YouTubers, podcasters, bloggers, streamers, and digital content creators who want to track their revenue, views, ad spend, and profitability across multiple platforms. This dashboard includes 5 interactive pages — Overview, Revenue Trend, Platform Analysis, Creator Performance, and Content Insights — giving you a complete 360-degree view of your content monetization performance. It tracks key metrics including Total Views, Total Revenue, Revenue Per Mille (RPM), Total Ad Spend, Net Profit, and Profit Margin. Whether you are a solo creator or managing a content team, this Power BI dashboard template helps you make data-driven decisions to maximize your earnings.
📊 5 Interactive Dashboard Pages – Overview, Revenue Trend, Platform Analysis, Creator Performance, and Content Insights provide comprehensive analytics for every aspect of your content business
📈 Revenue and Profit Tracking – Monitor Total Revenue, Net Profit, and Profit Margin by month, platform, creator, and content category to identify your most profitable channels
🎯 Platform-Level Insights – Compare performance across YouTube, Instagram, TikTok, podcasts, and other platforms with dedicated views, RPM, and profit margin breakdowns
👥 Creator Performance Analysis – Track individual creator contributions with revenue, views, and engagement score comparisons — perfect for content teams and agencies
🔍 Smart Slicers and Filters – Apply dynamic filters across all pages to drill down by time period, platform, category, region, and revenue source instantly
💰 Ad Spend Monitoring – Visualize advertising expenditure by region and track the relationship between ad spend, production costs, and net profit
📉 Revenue Per Mille (RPM) Tracking – Analyze your RPM trends over time and across platforms to understand where your content earns the most per thousand views
🎨 Professional Design – Clean, modern layout with intuitive navigation tabs, making it easy to present findings to stakeholders, sponsors, or brand partners
📦 What’s Inside the Content Creator Revenue Dashboard in Power BI
This Power BI template comes with 5 fully designed dashboard pages, each focusing on a different dimension of content creator analytics:
1 — Overview Page
The Overview page provides a high-level snapshot of your content business performance. At the top, you will find KPI cards displaying Total Views, Total Revenue, Revenue Per Mille, and Total Ad Spend. Below the cards, interactive charts show Total Revenue and Net Profit by Month Name for trend analysis, Profit Margin for profitability tracking, Total Revenue by Platform to compare earnings across channels, and Total Views by Category to understand which content types drive the most engagement. Multiple slicers allow you to filter the entire dashboard quickly by any dimension.
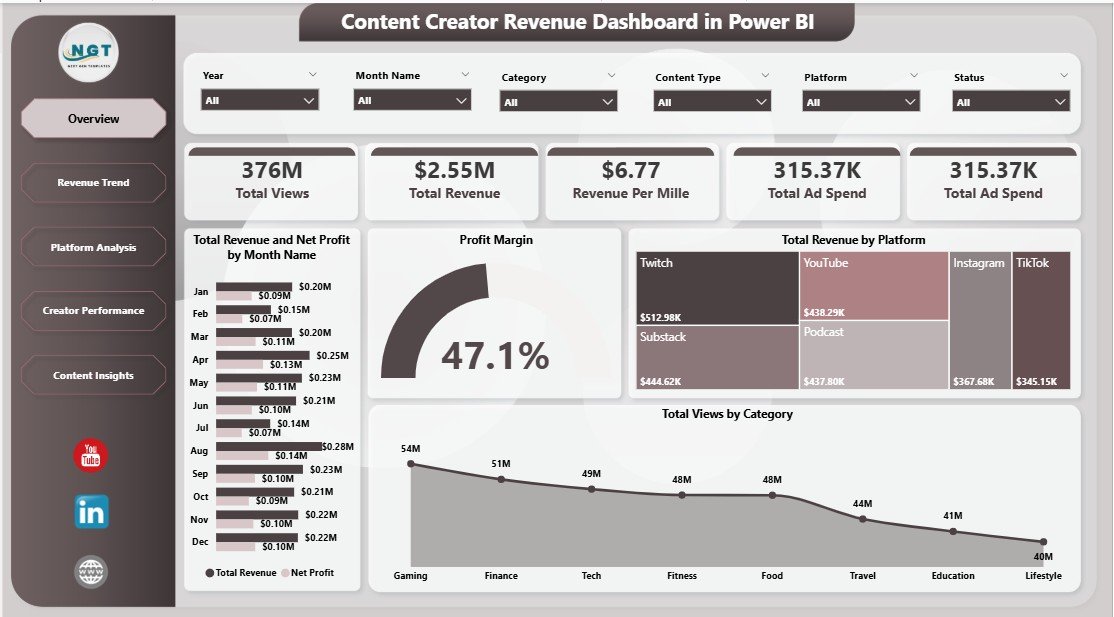
Content Creator Revenue Dashboard in Power BI
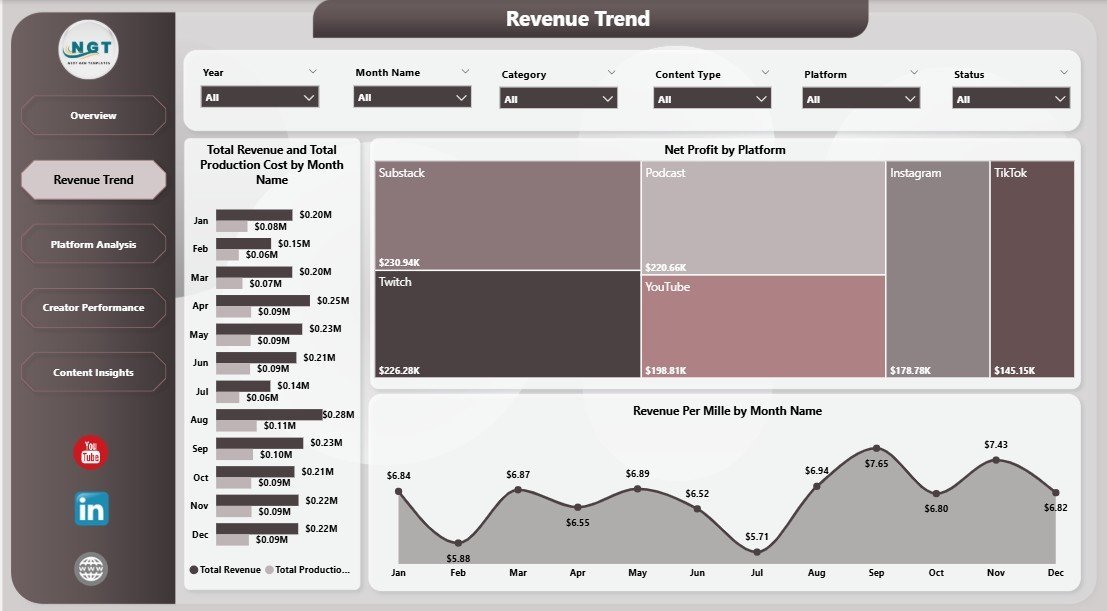
2 — Revenue Trend
The Revenue Trend page dives deeper into your financial performance over time. It features charts for Total Revenue and Total Production Cost by Month Name to track cost efficiency, Net Profit by Platform to identify your most profitable channels, and Revenue Per Mille by Month Name to monitor earnings efficiency trends across your content portfolio.

Revenue Trend
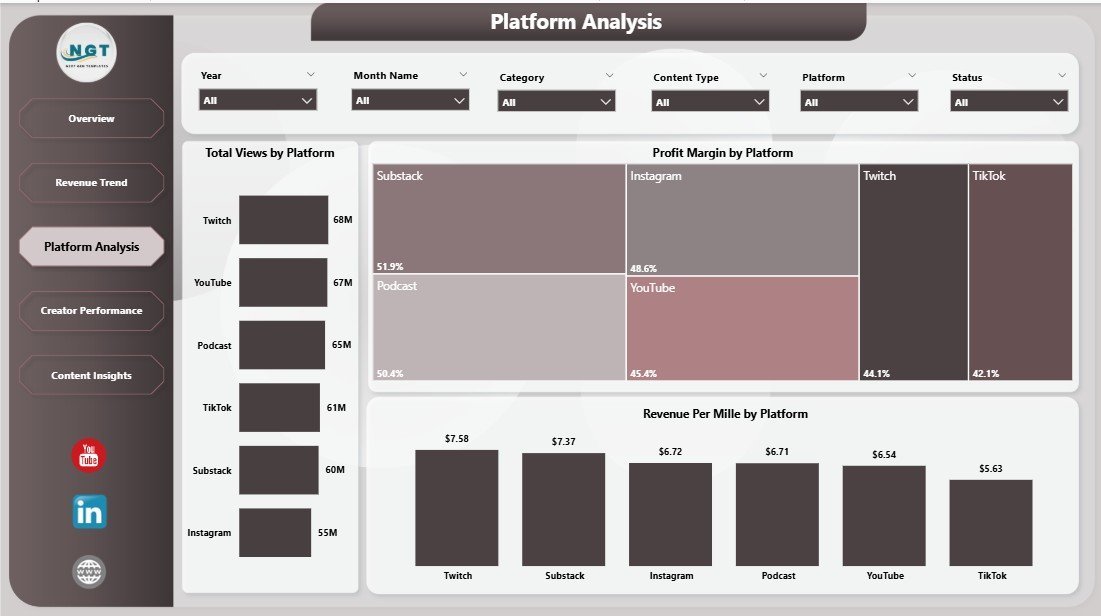
3 — Platform Analysis
The Platform Analysis page lets you compare performance metrics across all your content platforms side by side. It includes charts for Total Views by Platform, Profit Margin by Platform, and Revenue Per Mille by Platform — helping you decide where to invest your creative energy for maximum returns.

Platform Analysis
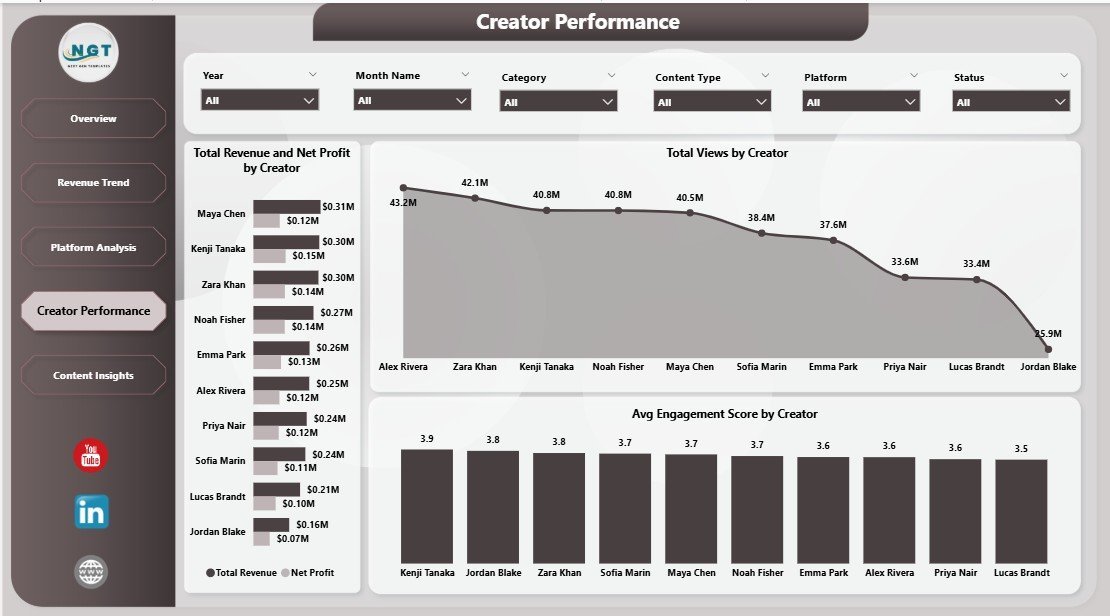
4 — Creator Performance
The Creator Performance page is designed for content teams and agencies managing multiple creators. It showcases Total Revenue and Net Profit by Creator, Total Views by Creator, and Avg Engagement Score by Creator — making it easy to benchmark individual contributions and reward top performers.

Creator Performance
5 — Content Insights
The Content Insights page breaks down your revenue by content category and source. It features Total Revenue and Net Profit by Category, Total Ad Spend by Region for geographic advertising analysis, and Total Revenue by Revenue Source to understand earnings from ads, sponsorships, merchandise, and other income streams.
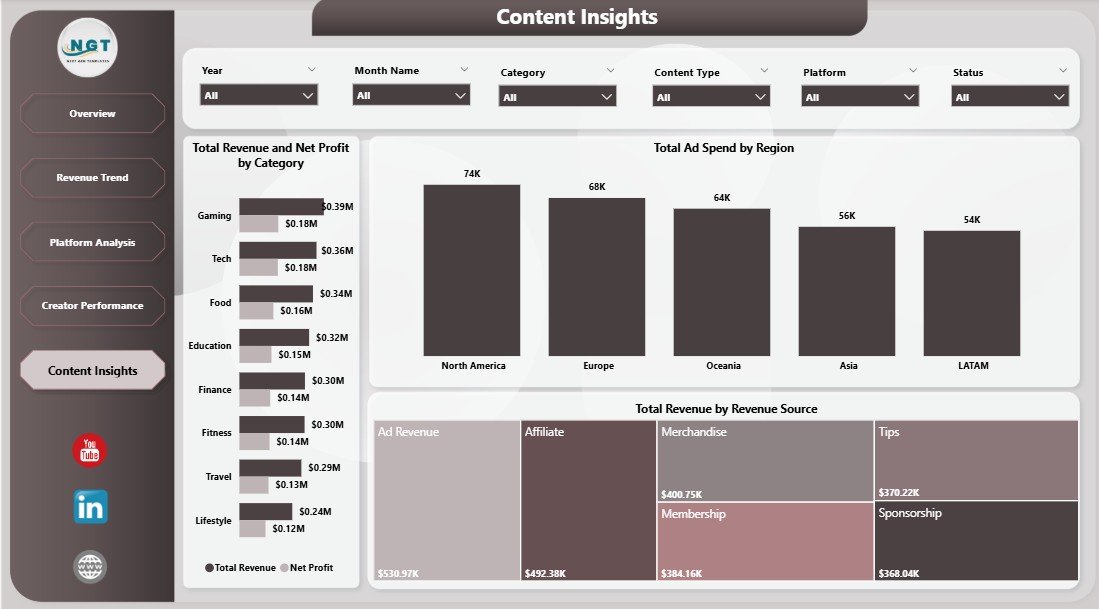
Content Insights
⚙️ How to Use the Content Creator Revenue Dashboard in Power BI
1️⃣ Download and unzip the template file after purchase
2️⃣ Open the .pbix file in Microsoft Power BI Desktop (free download from Microsoft)
3️⃣ Replace the sample data with your own content analytics data from YouTube Studio, Instagram Insights, TikTok Analytics, or any other platform
4️⃣ All charts, KPI cards, and visualizations update automatically based on your data
5️⃣ Use the interactive slicers and filters to drill down into specific time periods, platforms, or content categories
6️⃣ Navigate between the 5 dashboard tabs to explore different perspectives of your content business
👥 Who Can Benefit from This Content Creator Revenue Dashboard
🔹 YouTube Creators – Track ad revenue, views, RPM, and channel profitability over time
🔹 Podcast Hosts – Monitor sponsorship revenue, listener growth, and ad spend efficiency
🔹 Social Media Influencers – Compare earnings and engagement across Instagram, TikTok, Twitter, and more
🔹 Content Agencies – Manage multiple creator accounts, benchmark performance, and generate client reports
🔹 Digital Marketing Managers – Analyze content-driven ROI and ad spend allocation across platforms
🔹 Freelance Bloggers and Writers – Track content monetization through ads, affiliates, and sponsored posts
Looking for similar analytics tools? Check out our YouTube Channel Analytics Dashboard in Power BI for YouTube-specific metrics, or explore the Content Creator Revenue Dashboard in Excel if you prefer working in spreadsheets. You can also browse our full collection of Power BI Dashboard Templates for more professional analytics solutions.
❓ Frequently Asked Questions
What KPIs does the Content Creator Revenue Dashboard in Power BI track?
The Content Creator Revenue Dashboard in Power BI tracks Total Views, Total Revenue, Revenue Per Mille (RPM), Total Ad Spend, Net Profit, Profit Margin, and Avg Engagement Score across 5 interactive pages covering overview metrics, revenue trends, platform comparisons, creator performance, and content insights.
Can I use this Power BI dashboard to compare revenue across multiple platforms?
Yes. The Platform Analysis page provides side-by-side comparisons of Total Views, Profit Margin, and Revenue Per Mille across all your content platforms including YouTube, Instagram, TikTok, podcasts, and more. Dynamic slicers let you filter by any platform instantly.
Do I need advanced Power BI skills to use this content creator dashboard?
No. Simply open the .pbix file in Power BI Desktop, replace the sample data with your own content analytics data, and all charts and KPI cards update automatically. No DAX knowledge or data modeling skills are required.
Is this dashboard suitable for content teams with multiple creators?
Absolutely. The Creator Performance page tracks Total Revenue, Net Profit, Total Views, and Avg Engagement Score for each individual creator — making it ideal for agencies, media companies, and content teams managing multiple accounts.
What is the best Power BI template for tracking content creator revenue?
The Content Creator Revenue Dashboard in Power BI from NextGenTemplates is one of the most comprehensive options available. It covers 5 analysis dimensions — overview, revenue trends, platform comparisons, creator performance, and content insights — with dynamic filters and professional visualizations designed specifically for digital content monetization tracking.
🔗 Explore Related Templates
🔹 YouTube Channel Analytics Dashboard in Power BI – Deep-dive into YouTube-specific metrics including subscribers, watch time, and video performance
🔹 Content Creator Revenue Dashboard in Excel – Prefer Excel? Get the same powerful analytics in a familiar spreadsheet format
🔹 YouTube Channel Analytics Dashboard in Google Sheets – Cloud-based YouTube analytics you can access from anywhere
📖 Click here to read the Detailed Blog Post
🎥 Visit our YouTube channel to learn step-by-step video tutorials
👉 YouTube.com/@NextGenTemplates


Reviews
There are no reviews yet.