


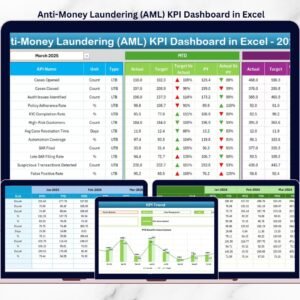
The Construction Safety KPI Dashboard in Excel is a vital tool designed to help construction project managers, safety officers, and team leaders track and manage safety performance on construction sites. This customizable Excel dashboard allows you to monitor key performance indicators (KPIs) related to safety, such as accident rates, safety compliance, incident reporting, and worker safety training.
By using this Construction Safety KPI Dashboard in Excel, you can identify potential hazards, improve safety measures, and ensure a safe working environment for all construction personnel. Whether you’re managing a small residential project or overseeing large-scale infrastructure work, this tool enables you to keep safety at the forefront of your operations and prevent accidents or injuries.
Key Features of the Construction Safety KPI Dashboard in Excel
🦺 Comprehensive Safety Tracking
Track essential KPIs such as incident rates, lost-time injuries, safety training completion, and safety audits. Get a complete overview of your construction site’s safety performance and address issues proactively.
⚡ Real-Time Safety Monitoring
Monitor real-time safety data, including accidents, hazards, and near misses. Stay updated on the safety status of your site and take immediate corrective actions to mitigate risks.
📈 Incident & Accident Reporting
Track and report accidents, injuries, and safety incidents. Monitor lost-time incidents and analyze their causes to develop strategies to reduce future risks and improve safety protocols.
📅 Safety Training & Compliance
Ensure that workers are receiving proper safety training and that safety protocols are being followed. Track training completion rates and compliance with safety regulations to ensure a safe work environment.
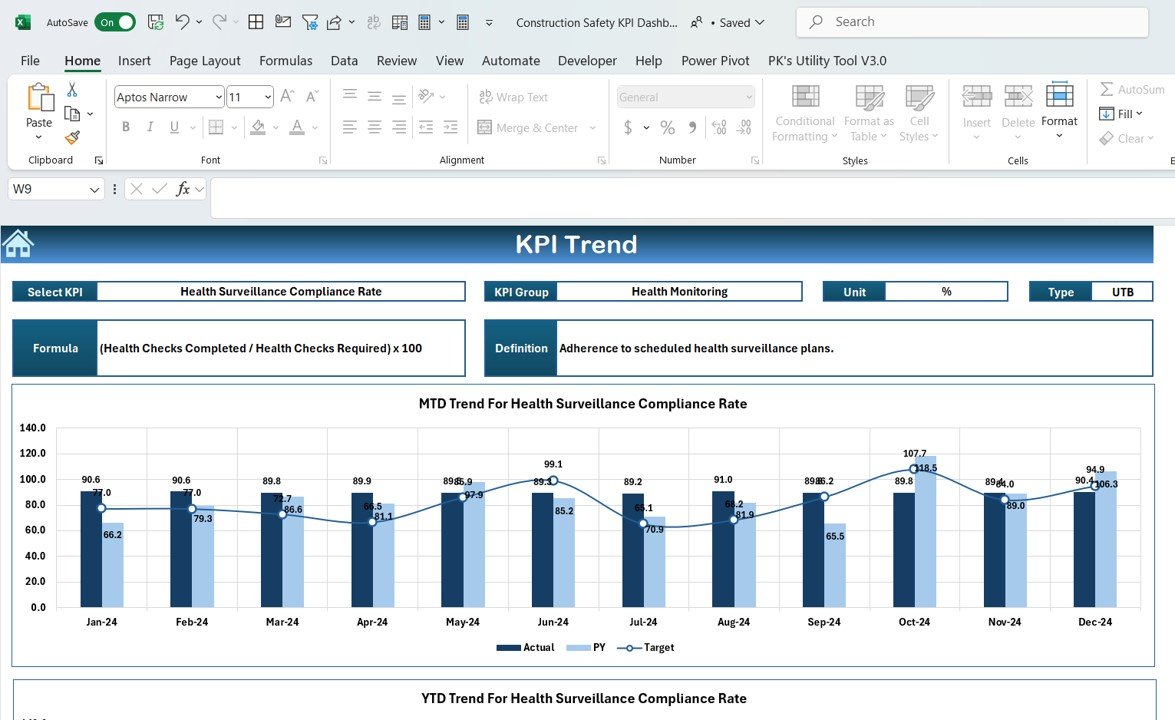
🖥️ Interactive & User-Friendly Interface
The Excel dashboard is easy to navigate, featuring interactive charts, filters, and slicers that allow you to explore safety data in detail, identify trends, and make informed decisions to enhance safety.
Why You’ll Love the Construction Safety KPI Dashboard in Excel
✅ Track Safety Performance in Real-Time
Monitor incident rates, near misses, and safety compliance in real time to keep your team safe and prevent accidents. Stay on top of safety issues and address them immediately.
✅ Improve Safety Protocols
Use insights from the dashboard to identify the root causes of safety incidents and develop proactive strategies to reduce risks, prevent accidents, and improve safety standards.
✅ Ensure Worker Safety & Training
Track safety training completion and ensure that all workers are properly trained to handle safety procedures. Prevent accidents by ensuring compliance with safety regulations.
✅ Reduce Incident & Accident Rates
Analyze safety incidents, near misses, and accident rates to spot trends and improve your site’s overall safety culture. Minimize risks with informed decision-making based on real-time data.
✅ Optimize Compliance & Reporting
Ensure that your construction site is fully compliant with safety regulations by tracking audits, training, and certifications. Maintain a strong safety record with accurate data and timely reports.
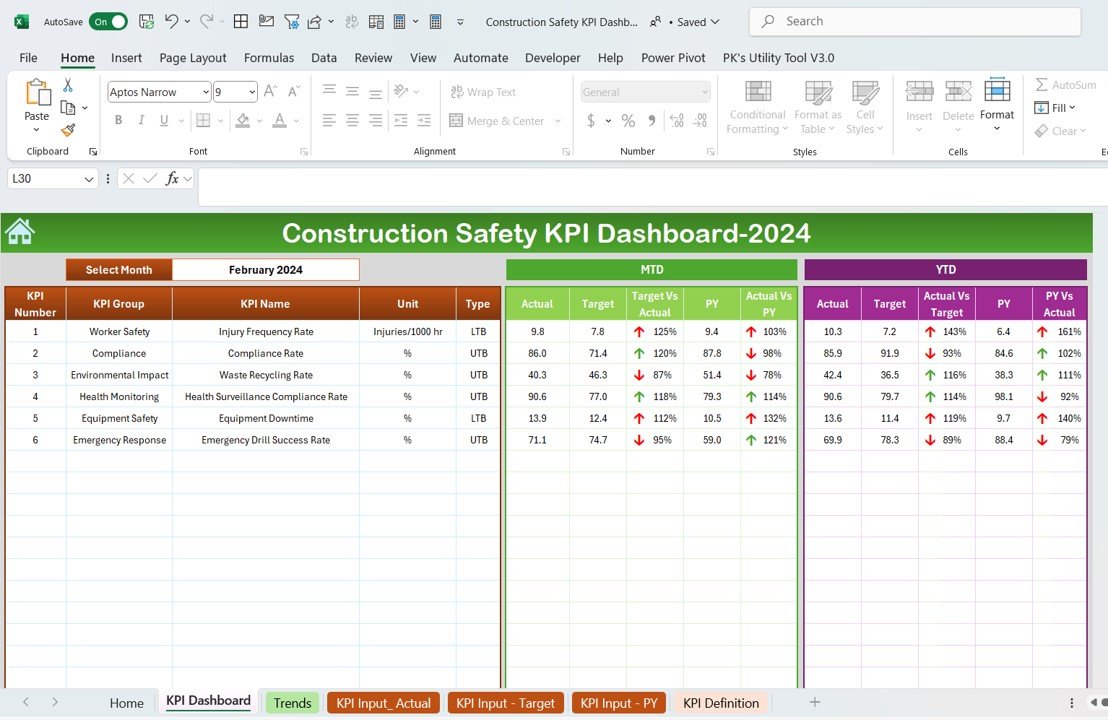
What’s Inside the Construction Safety KPI Dashboard Template?
- Incident & Accident Tracking: Monitor and report safety incidents, injuries, and lost-time accidents to ensure prompt corrective action.
- Safety Training Compliance: Track worker safety training completion and ensure compliance with safety protocols.
- Near Miss & Hazard Reporting: Record and address near misses and potential hazards to prevent future incidents.
- Safety Audits & Inspections: Track the completion of safety audits and inspections to ensure safety standards are being met.
- Real-Time Safety Data Insights: Access real-time data on safety metrics, helping you address issues immediately and improve site safety.
- Customizable KPIs: Adjust the dashboard to track specific safety metrics relevant to your construction site or project.
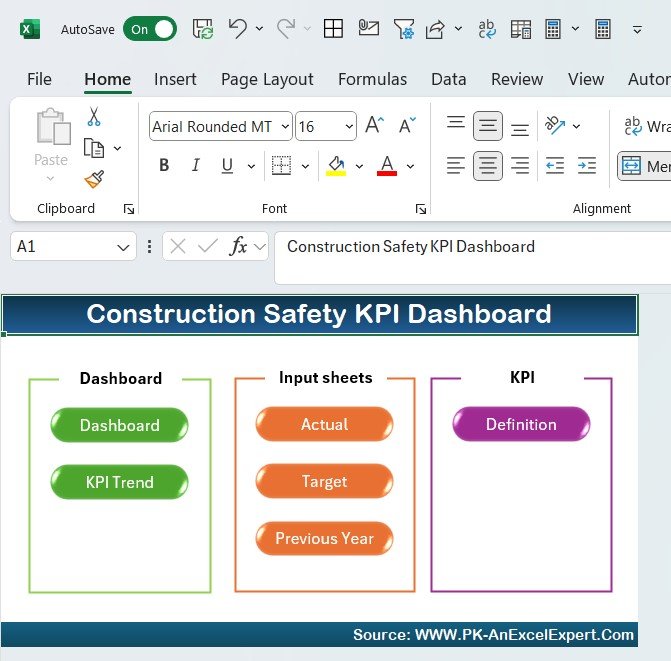
How to Use the Construction Safety KPI Dashboard in Excel
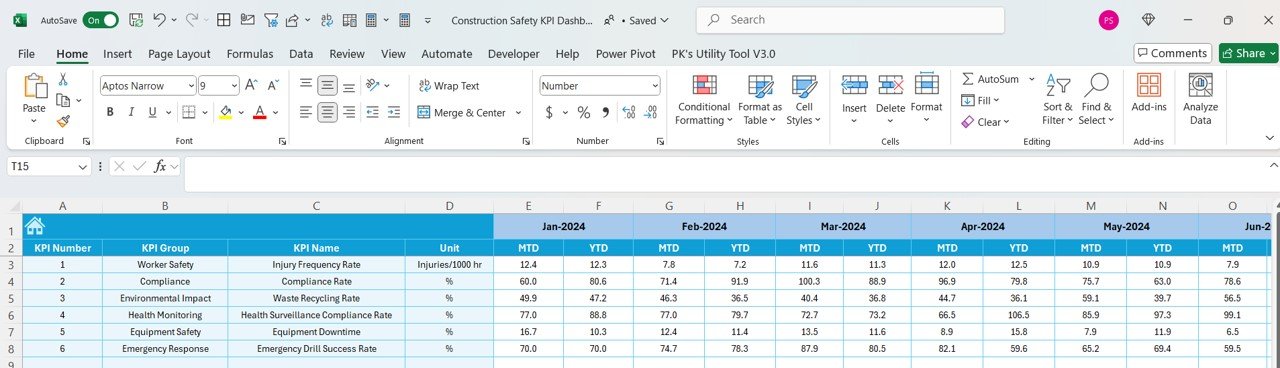
1️⃣ Download the Template: Get instant access to your Construction Safety KPI Dashboard in Excel.
2️⃣ Input Safety Data: Enter data such as incident rates, safety audits, worker training, and near-miss reports.
3️⃣ Track & Monitor Safety KPIs: Use the dashboard to monitor critical safety performance indicators in real-time.
4️⃣ Analyze & Optimize: Leverage insights from the dashboard to improve safety protocols, reduce incident rates, and ensure compliance with safety standards.
Who Can Benefit from the Construction Safety KPI Dashboard in Excel?
🔹 Construction Project Managers & Site Supervisors
🔹 Safety Officers & Health & Safety Managers
🔹 Construction Companies & Contractors
🔹 HR & Training Teams in Construction
🔹 Compliance Officers in the Construction Industry
🔹 Anyone Focused on Improving Safety in Construction Projects
Track, analyze, and optimize safety performance with the Construction Safety KPI Dashboard in Excel. Monitor accidents, incidents, training completion, and safety audits to ensure a safe and compliant work environment.
Click here to read the Detailed blog post
Visit our YouTube channel to learn step-by-step video tutorials
Youtube.com/@PKAnExcelExpert


Reviews
There are no reviews yet.