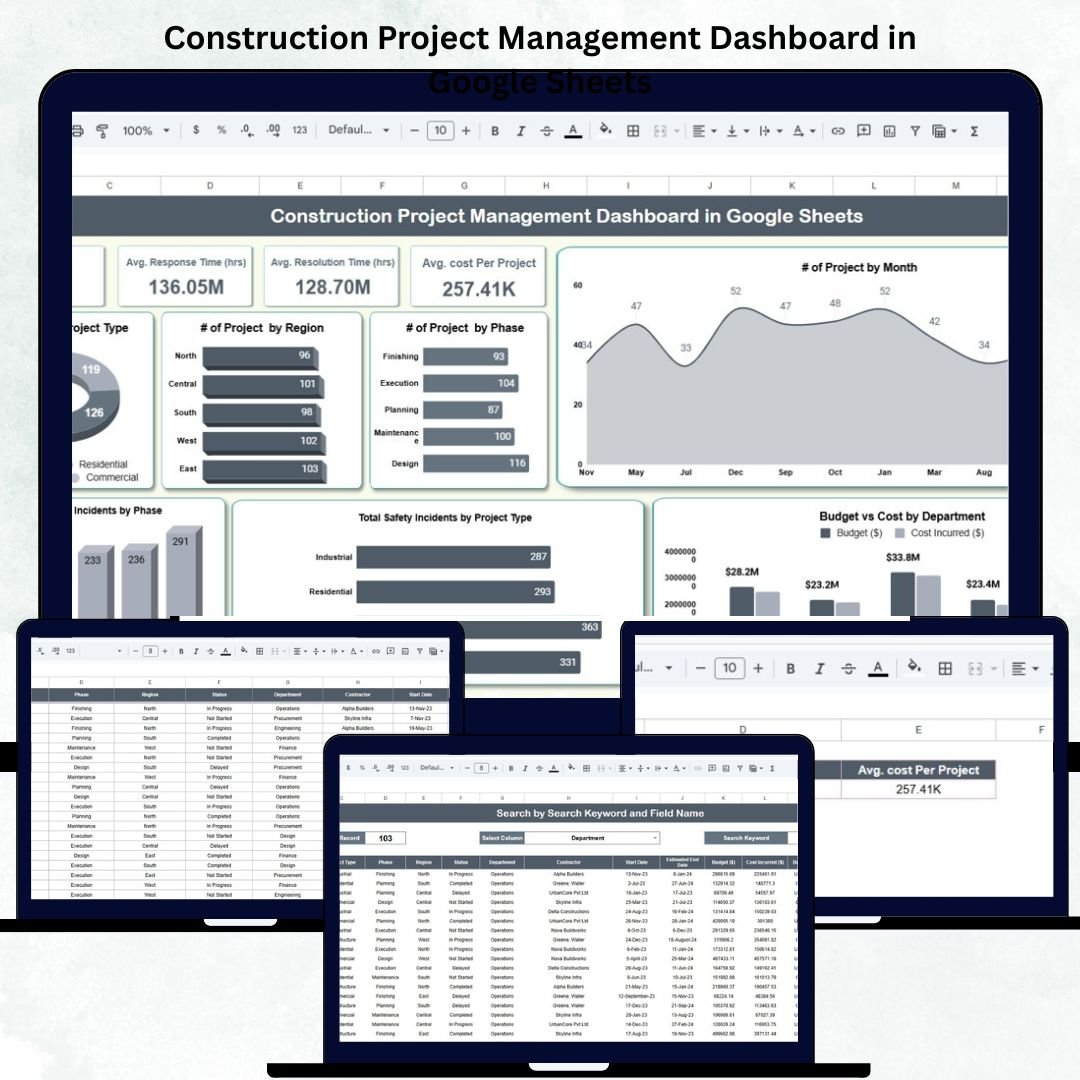
Managing construction projects requires constant coordination between budgets, schedules, teams, and safety standards. The Construction Project Management Dashboard in Google Sheets is a ready-to-use, automated, and data-driven solution that helps project managers, contractors, and stakeholders gain complete control over project performance — all in one interactive Google Sheets file. 🏗️📊
This powerful template provides a centralized view of all ongoing and completed projects, allowing users to monitor financials, timelines, and safety metrics in real time. Built entirely in Google Sheets, it’s easy to use, fully customizable, and accessible from anywhere — making it the perfect project tracking tool for construction professionals.
🔑 Key Features of the Construction Project Management Dashboard in Google Sheets
📋 Dashboard Sheet Tab (Main Overview)
Your all-in-one control center for monitoring multiple projects simultaneously.
-
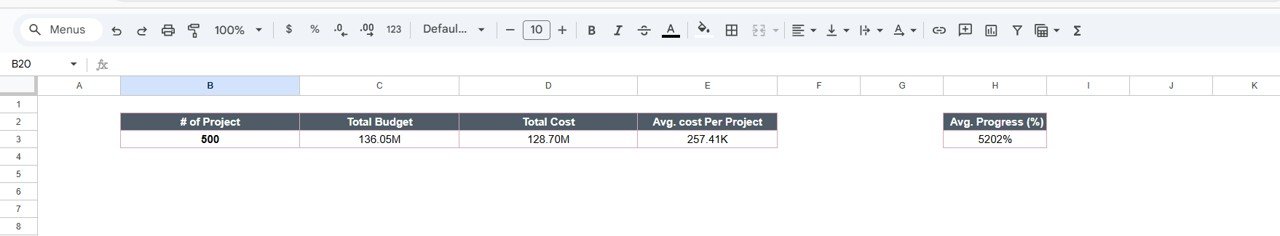
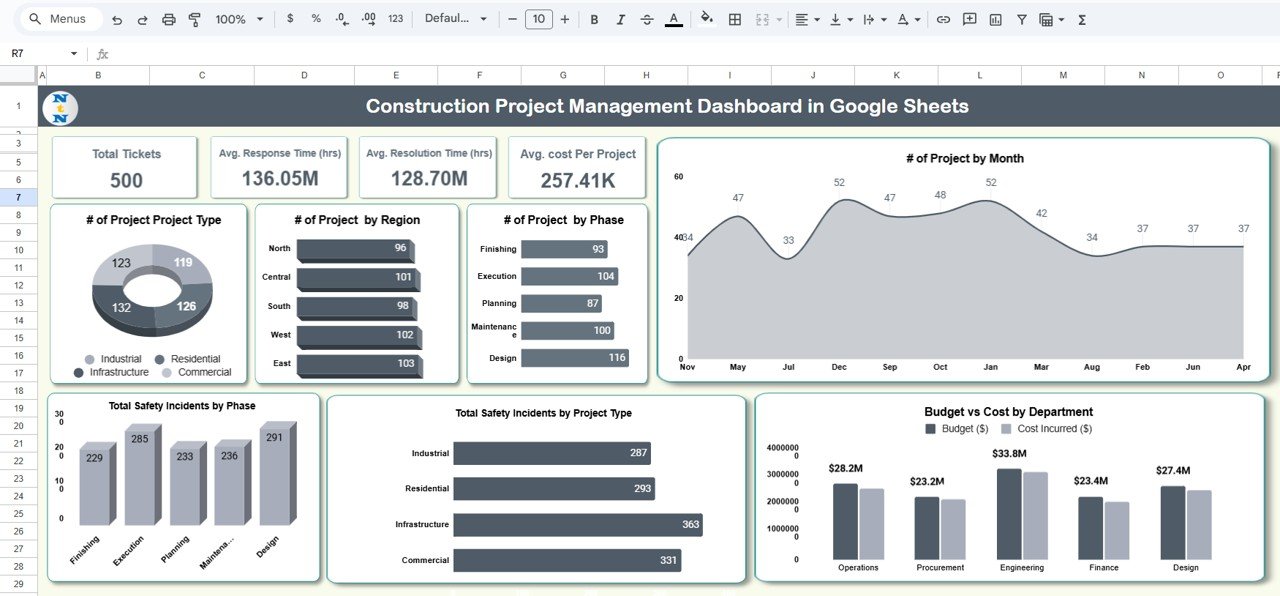
Displays # of Projects, Total Budget (USD), Total Cost (USD), and Average Cost per Project (USD).
-
Provides live comparisons of Budget vs Actual Costs for each department.
-
Includes safety and progress analytics for operational awareness.
📊 Charts and Visual Reports
Gain a clear understanding of project performance through dynamic visuals:
-
Projects by Type – View portfolio distribution (Residential, Commercial, Infrastructure, etc.)
-
Projects by Region – Assess performance across different geographical zones.
-
Projects by Phase – Identify project progress (Planning, Execution, Closure).
-
Budget vs Cost by Department – Detect cost overruns early.
-
Safety Incidents by Project Type & Phase – Track site safety trends and compliance.
-
Projects by Month – Analyze new project initiations and workload distribution.
Each chart updates automatically as new data is entered — giving you instant, actionable insights.
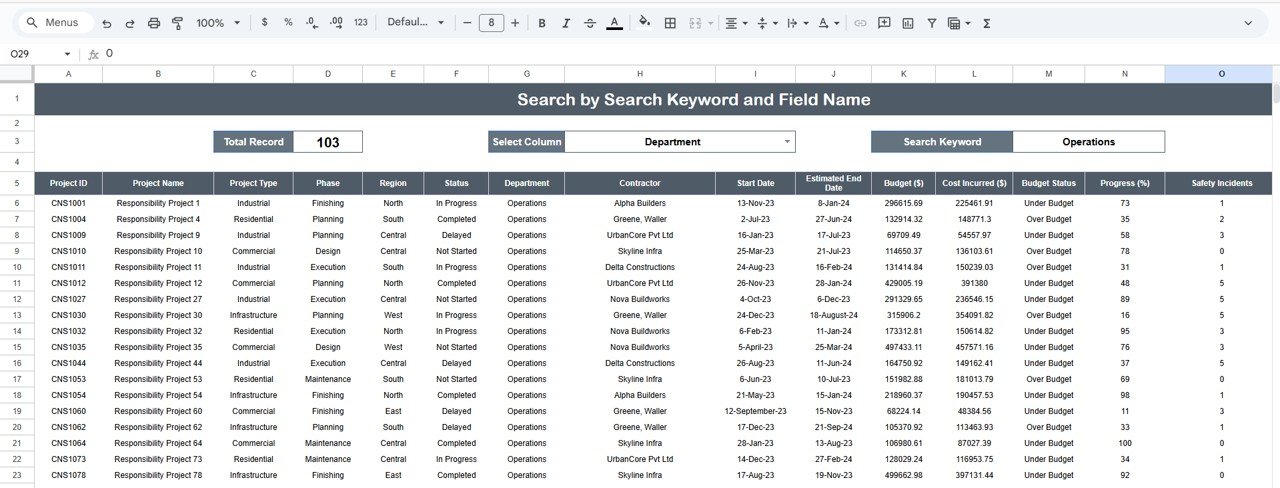
🔍 Search Sheet Tab
Quickly locate any project record by entering keywords or field names.
You can search by:
-
Project ID
-
Project Name
-
Department
-
Region
-
Phase
-
Manager Name
Perfect for large organizations managing dozens of projects across multiple regions.
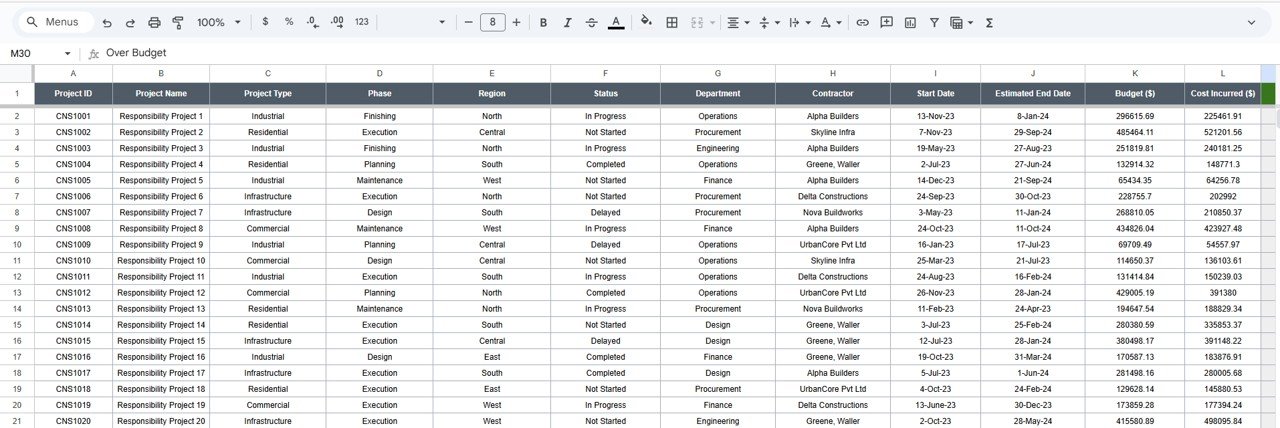
🧾 Data Sheet Tab
This is the foundation of the dashboard — where all project details are stored.
It includes structured fields for Project Name, Type, Region, Department, Budget, Cost, Phase, Start Date, End Date, Safety Incidents, and more.
Data entered here drives every chart and KPI automatically.
⚙️ Support Sheet Tab
Contains dropdown reference lists for Project Type, Region, Department, and Phase — ensuring clean, consistent data entry.
📦 What’s Inside the Construction Project Management Dashboard
✅ Fully functional Google Sheets Dashboard – Plug-and-play ready
✅ Dynamic Charts & KPIs – Auto-updated visuals for real-time analysis
✅ Search Functionality – Locate any project instantly
✅ Budget vs Cost Comparison – Identify variances easily
✅ Safety Performance Tracking – Monitor incidents by category
✅ Predefined Dropdown Lists – Standardized inputs for accuracy
✅ Cloud Collaboration – Multiple users can edit in real time
✅ Completely Customizable – Add more KPIs, charts, or filters anytime
🧑💼 Who Can Benefit from This Dashboard
👷 Project Managers – Track progress, costs, and safety in real time.
🏗️ Contractors & Builders – Manage multiple projects efficiently.
💼 Executives & Financial Controllers – Monitor budgets and ROI across sites.
🔧 Safety Officers – Evaluate incident trends by phase or type.
📊 Consultants & Analysts – Generate instant performance reports for clients.
This dashboard empowers your team to make data-driven decisions that improve efficiency, cost control, and on-site safety.
🧪 How to Use the Construction Project Management Dashboard
1️⃣ Input Data: Fill in project details in the Data Sheet Tab.
2️⃣ Analyze Dashboard: Watch charts and KPIs update automatically.
3️⃣ Search Projects: Use the Search Tab to locate specific entries.
4️⃣ Monitor Budgets: Compare actual costs against planned budgets.
5️⃣ Track Safety: Review incidents by type, phase, or project.
6️⃣ Collaborate & Share: Work in real time with your team or export to PDF for client presentations.
💡 Pro Tip: Add Google Form integration to collect field data directly from site managers.
🌟 Why Choose This Dashboard
-
Simplifies complex project tracking
-
Improves budget control and cost analysis
-
Promotes transparency across departments
-
Provides real-time, visual insights
-
Works 100% in Google Sheets — no coding, no extra tools
-
Fully customizable and scalable for organizations of any size
With the Construction Project Management Dashboard in Google Sheets, you can bring order, accountability, and clarity to your entire project portfolio — ensuring smarter decisions, fewer delays, and stronger profitability. 🚀
🔗 Click here to read the Detailed blog post
Watch the step-by-step video Demo:


Reviews
There are no reviews yet.