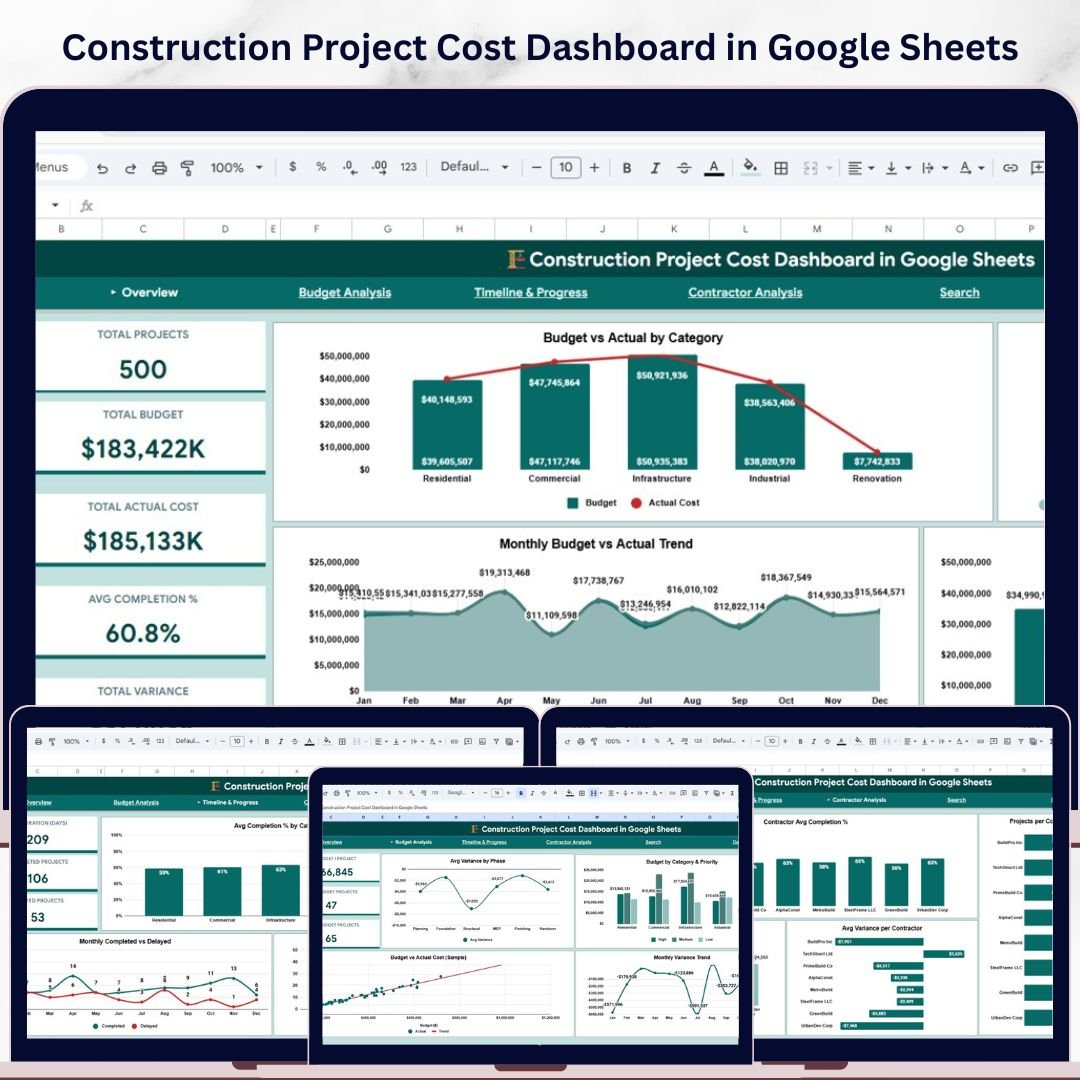


🔑 Key Features of Construction Project Cost Dashboard in Google Sheets
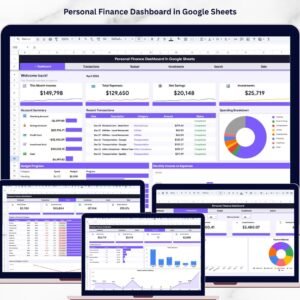
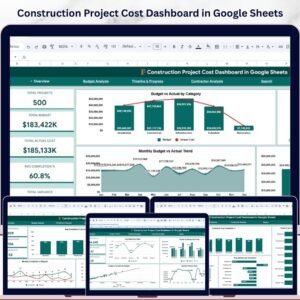
Construction Project Cost Dashboard in Google Sheets is a powerful, ready-to-use template designed to help project managers, contractors, and construction firms track budgets, actual costs, variances, and project progress — all in one dynamic Google Sheets dashboard. This template includes 5 interactive dashboard pages covering overview analytics, budget analysis, timeline tracking, contractor performance, and a quick-search page. It tracks critical KPIs including Total Projects, Total Budget, Total Actual Cost, Average Completion Percentage, and Total Variance across all your construction projects.
Whether you manage residential builds, commercial developments, or infrastructure projects, this dashboard gives you instant visibility into where your money is going and whether projects are on schedule. Explore our full collection of Google Sheets Dashboard Templates for more ready-made solutions.Construction Project Cost Dashboard in Google Sheets
📦 What’s Inside the Construction Project Cost Dashboard
📊 Overview Page — Get a bird’s-eye view of your entire construction portfolio with 5 KPI cards: Total Projects, Total Budget, Total Actual Cost, Avg Completion %, and Total Variance. Visualize trends through Budget vs Actual by Category, Project Status Distribution, Monthly Budget vs Actual Trend, and Budget by Region. Multiple slicers let you filter data instantly by category, region, status, and more.Construction Project Cost Dashboard in Google Sheets
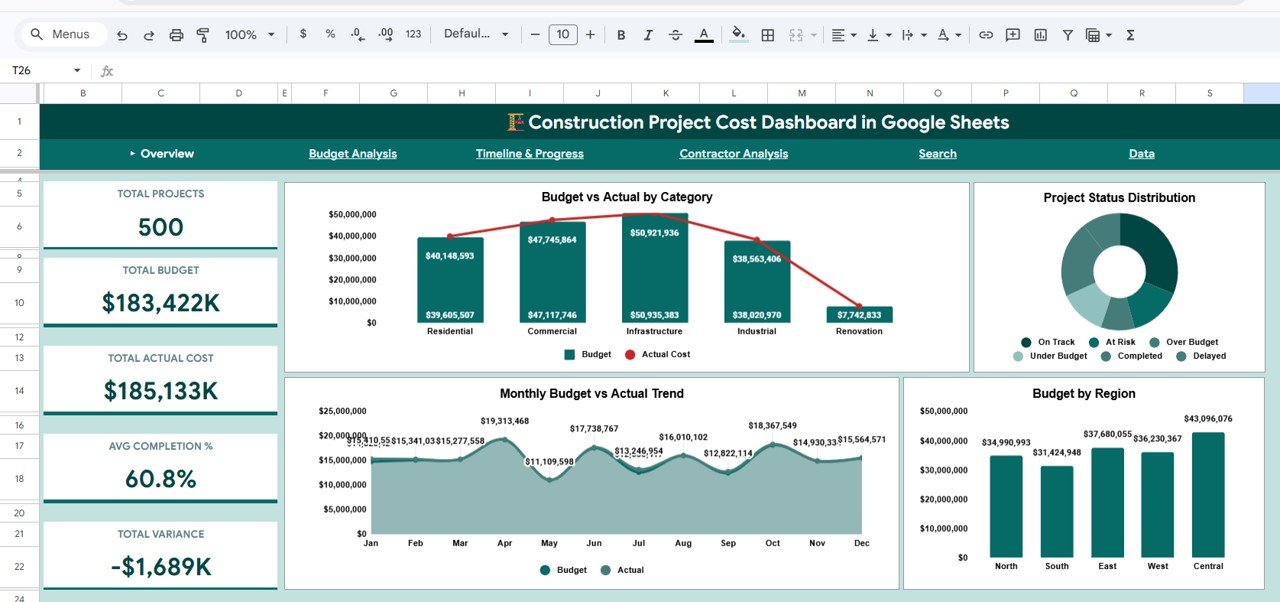
Overview Page
📈 Budget Analysis Page — Dive deeper into cost performance with Avg Variance by Phase, Budget by Category & Priority, Budget vs Actual Cost (Sample), and Monthly Variance Trend. Identify which project phases and categories are over or under budget at a glance.Construction Project Cost Dashboard in Google Sheets
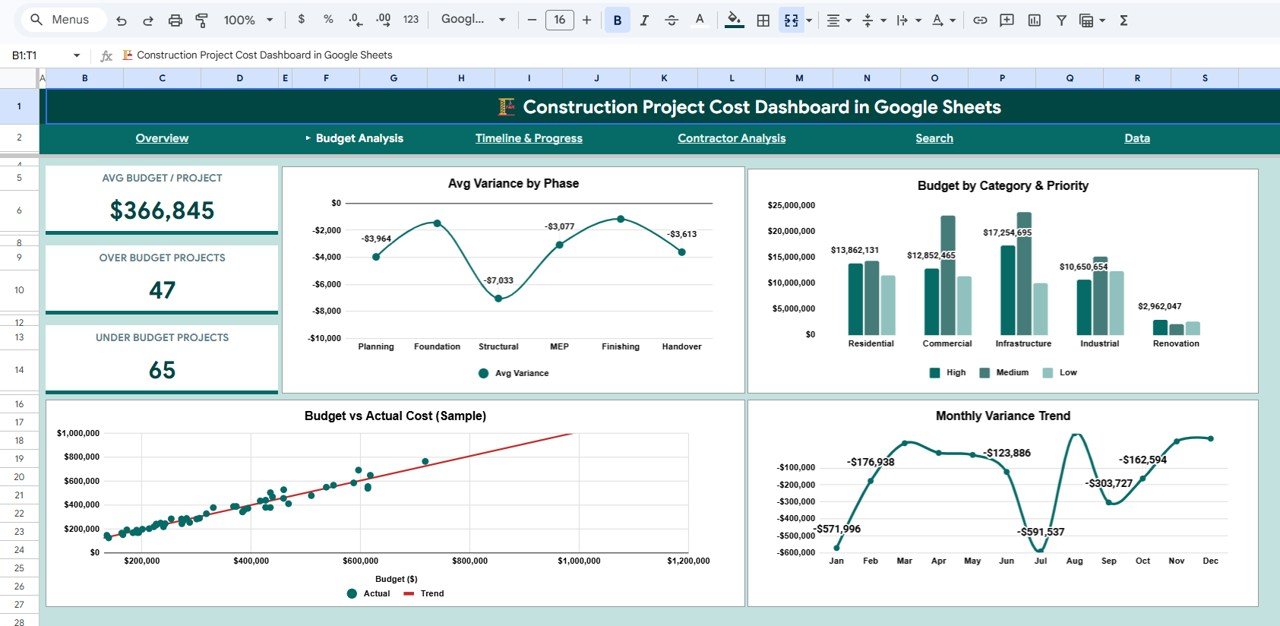
Budget Analysis
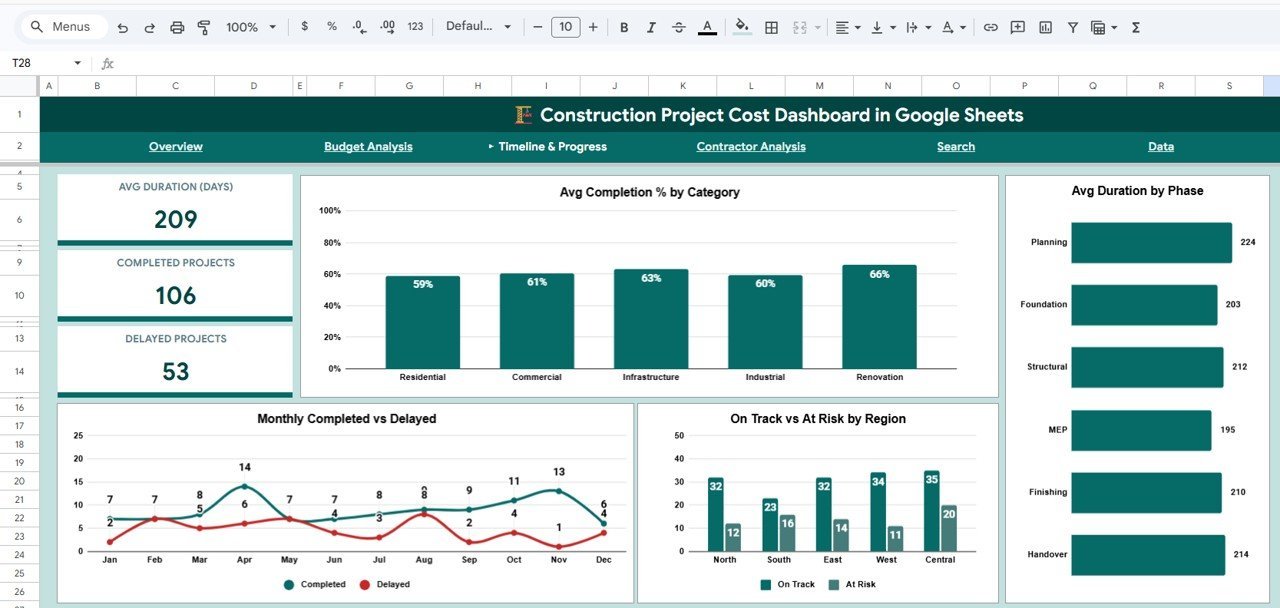
⏱️ Timeline & Progress Page — Monitor project timelines with Avg Completion % by Category, Avg Duration by Phase, Monthly Completed vs Delayed, and On Track vs At Risk by Region. Quickly spot delayed projects and take corrective action before costs escalate.
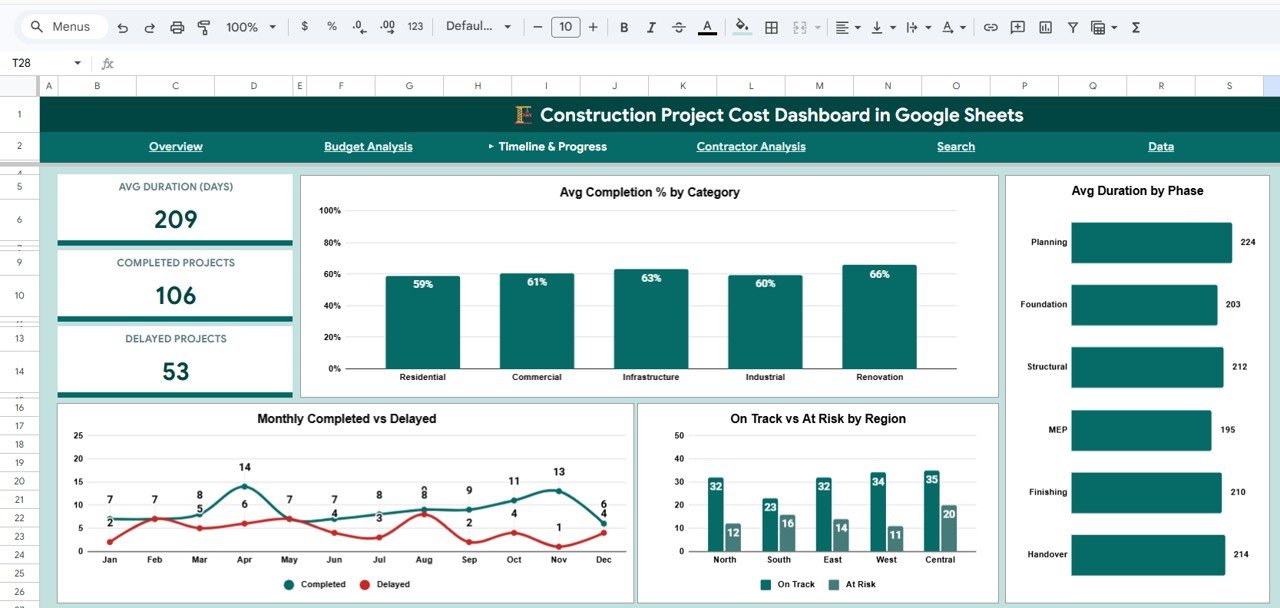
Timeline & Progress
🏗️ Contractor Analysis Page — Evaluate contractor performance with Contractor Avg Completion %, Projects per Contractor, Contractor Budget vs Actual, and Avg Variance per Contractor. Hold contractors accountable and make data-driven decisions on future partnerships. Similar insights are available in our Construction Progress & Cost Control Dashboard.
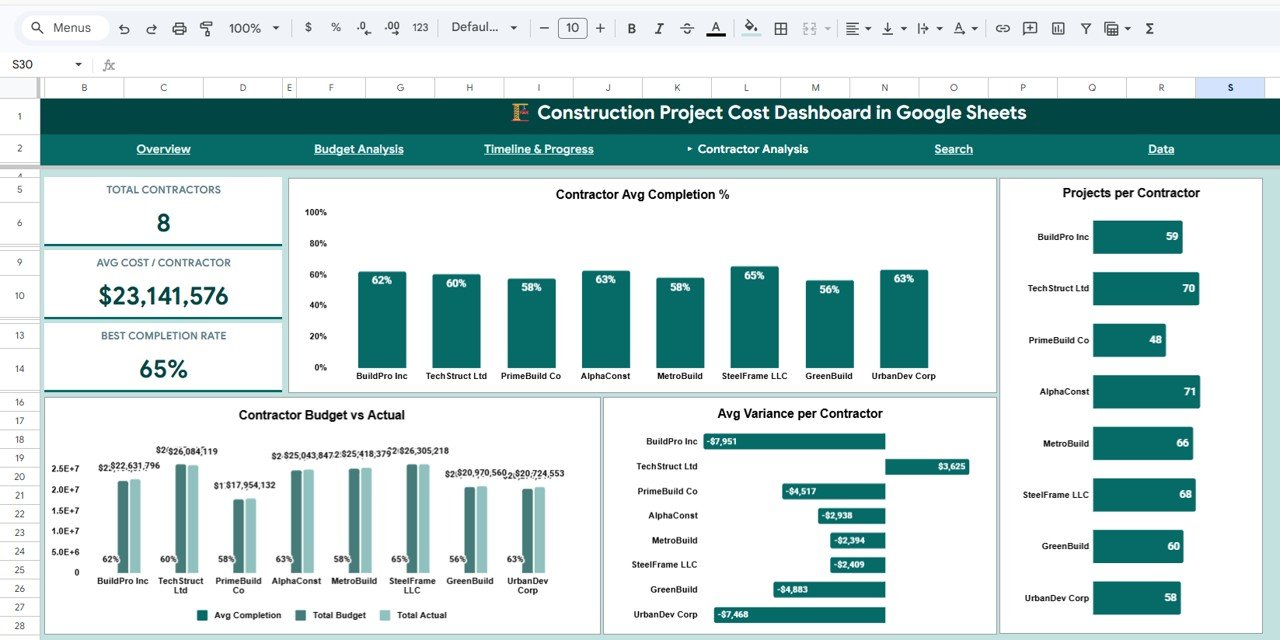
Contractor Analysis
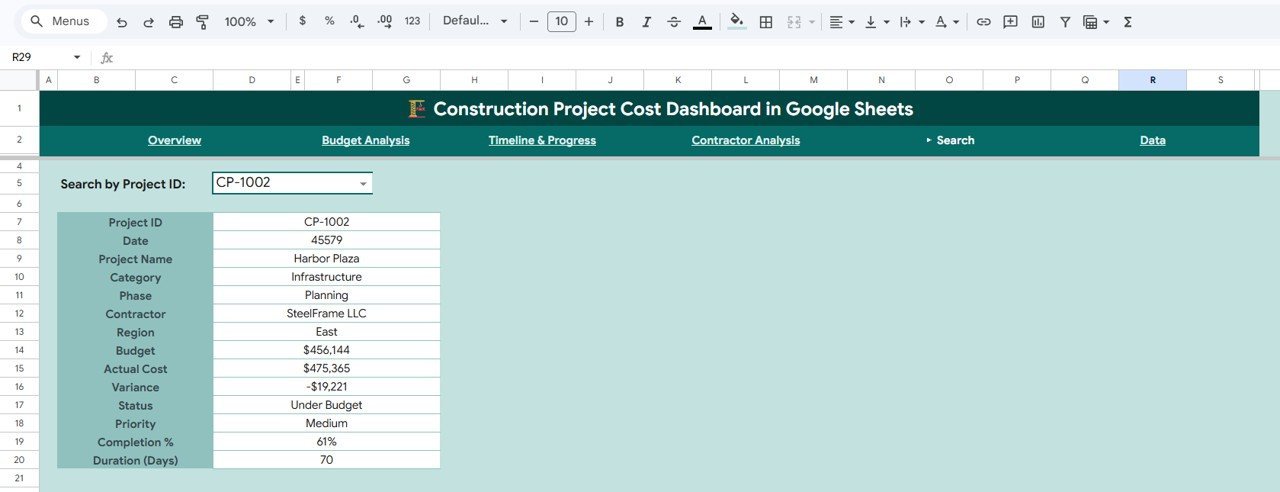
🔍 Search Page — Select any Project ID from the dropdown and instantly view all key details including Project Name, Category, Phase, Contractor, Region, Budget, Actual Cost, Variance, Status, Priority, Completion %, and Duration in Days. No more scrolling through endless rows of data.
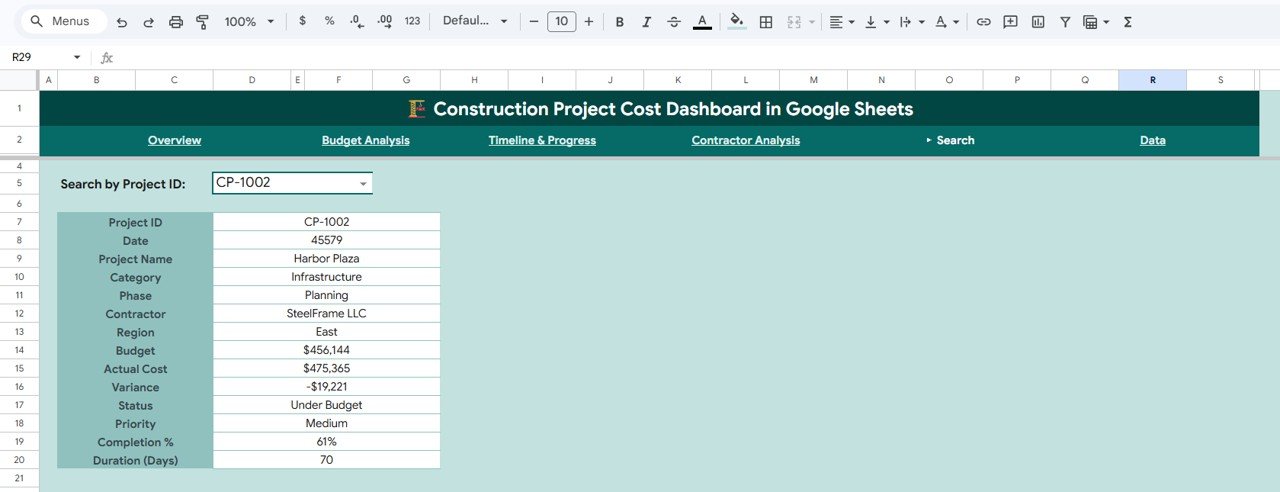
Search Page
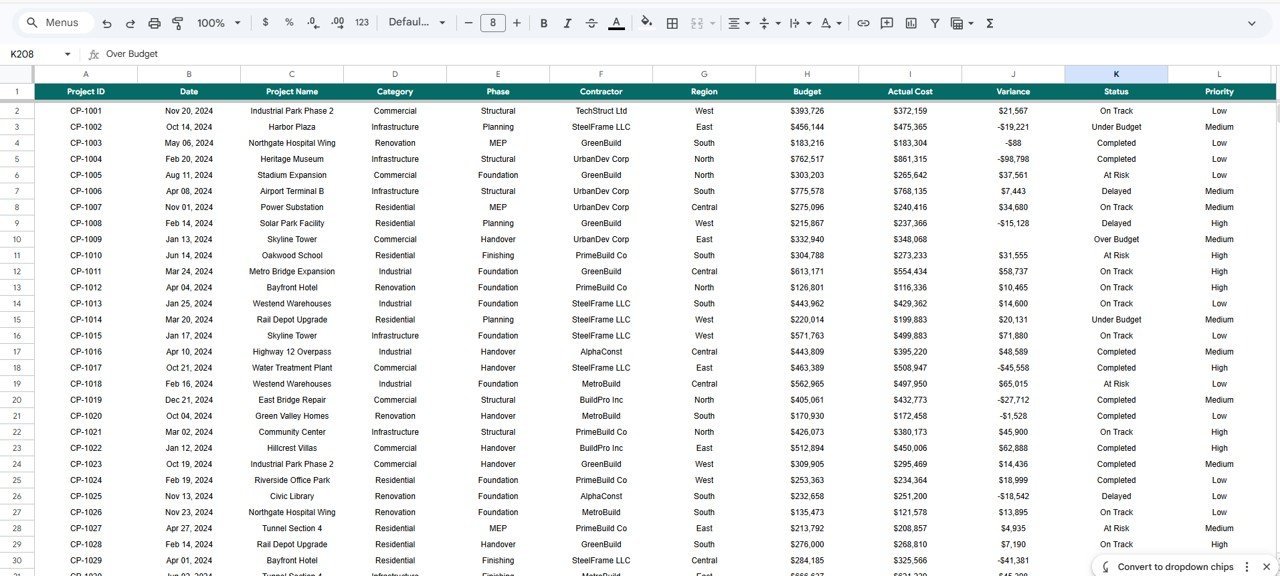
📋 Data Sheet — A structured data entry sheet where you add your project records. Simply replace the sample data with your own and every chart, card, and analysis page updates automatically.
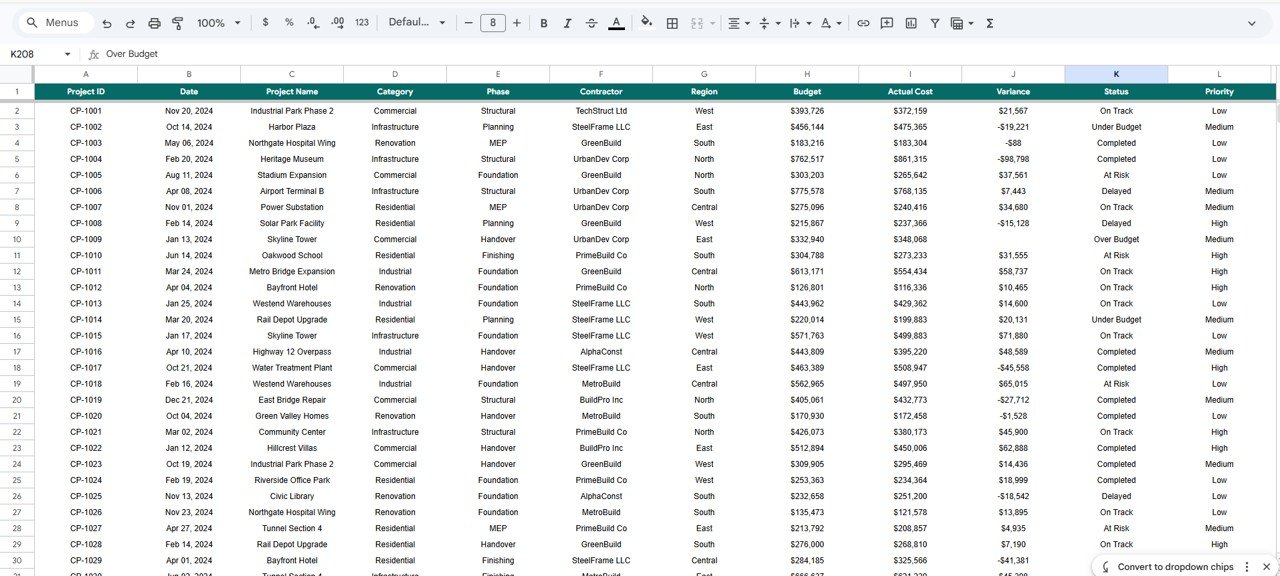
Data Sheet
⚙️ How to Use the Construction Project Cost Dashboard
1️⃣ Open the PDF guide included in your download and click the Google Sheets copy link to create your own editable version in Google Drive.
2️⃣ Navigate to the Data Sheet tab and replace the sample data with your actual construction project records — including project names, budgets, actual costs, phases, contractors, and regions.
3️⃣ Head to the Overview Page to see all 5 KPI cards and charts update automatically. Use the slicers to filter by category, region, or status.
4️⃣ Explore Budget Analysis, Timeline & Progress, and Contractor Analysis pages for detailed breakdowns.
5️⃣ Use the Search Page to look up individual project details instantly by selecting a Project ID from the dropdown.
👥 Who Can Benefit from This Construction Project Cost Dashboard
🏢 Construction company owners and managers tracking multi-project budgets
👷 Project managers monitoring cost overruns and timeline delays
📐 Civil engineers and architects overseeing project financials
💼 Freelance contractors managing multiple construction engagements
🏠 Real estate developers tracking residential and commercial build costs
📊 Financial analysts reviewing construction project performance. Also check out the Project Performance and Cost Control Dashboard for a complementary analysis tool.
❓ Frequently Asked Questions
What KPIs does the Construction Project Cost Dashboard track?
The Construction Project Cost Dashboard in Google Sheets tracks 5 key performance indicators: Total Projects, Total Budget, Total Actual Cost, Average Completion Percentage, and Total Variance. These KPIs give you a complete picture of your construction portfolio’s financial health.
Do I need advanced Google Sheets skills to use this template?
No. Simply replace the sample data in the Data Sheet with your own project records and all charts, KPI cards, and analysis pages update automatically. No formulas to write or charts to create from scratch.
Can I filter the dashboard by specific regions or project categories?
Yes. The Overview Page includes multiple slicers that let you filter the entire dashboard by category, region, status, and other dimensions instantly.
How many dashboard pages are included in this template?
This template includes 5 interactive dashboard pages: Overview, Budget Analysis, Timeline & Progress, Contractor Analysis, and a Search Page — plus a Data Sheet for your raw project data.
Can I use this dashboard for different types of construction projects?
Absolutely. The dashboard works for residential construction, commercial builds, infrastructure projects, renovation work, and any other construction project type. Simply customize the data fields to match your projects.
🔗 Explore Related Templates
🏗️ Construction Equipment KPI Dashboard in Google Sheets — Track equipment utilization, maintenance costs, and performance KPIs for your construction fleet.
☀️ Solar Project Construction Dashboard in Google Sheets — Specialized dashboard for managing solar energy construction projects with budget and timeline tracking.
🏢 Infrastructure KPI Scorecard in Google Sheets — Monitor infrastructure project KPIs with a scorecard-style layout for quick performance reviews.
📖 Click here to read the Detailed Blog Post
Watch the step-by-step video tutorial:


Reviews
There are no reviews yet.