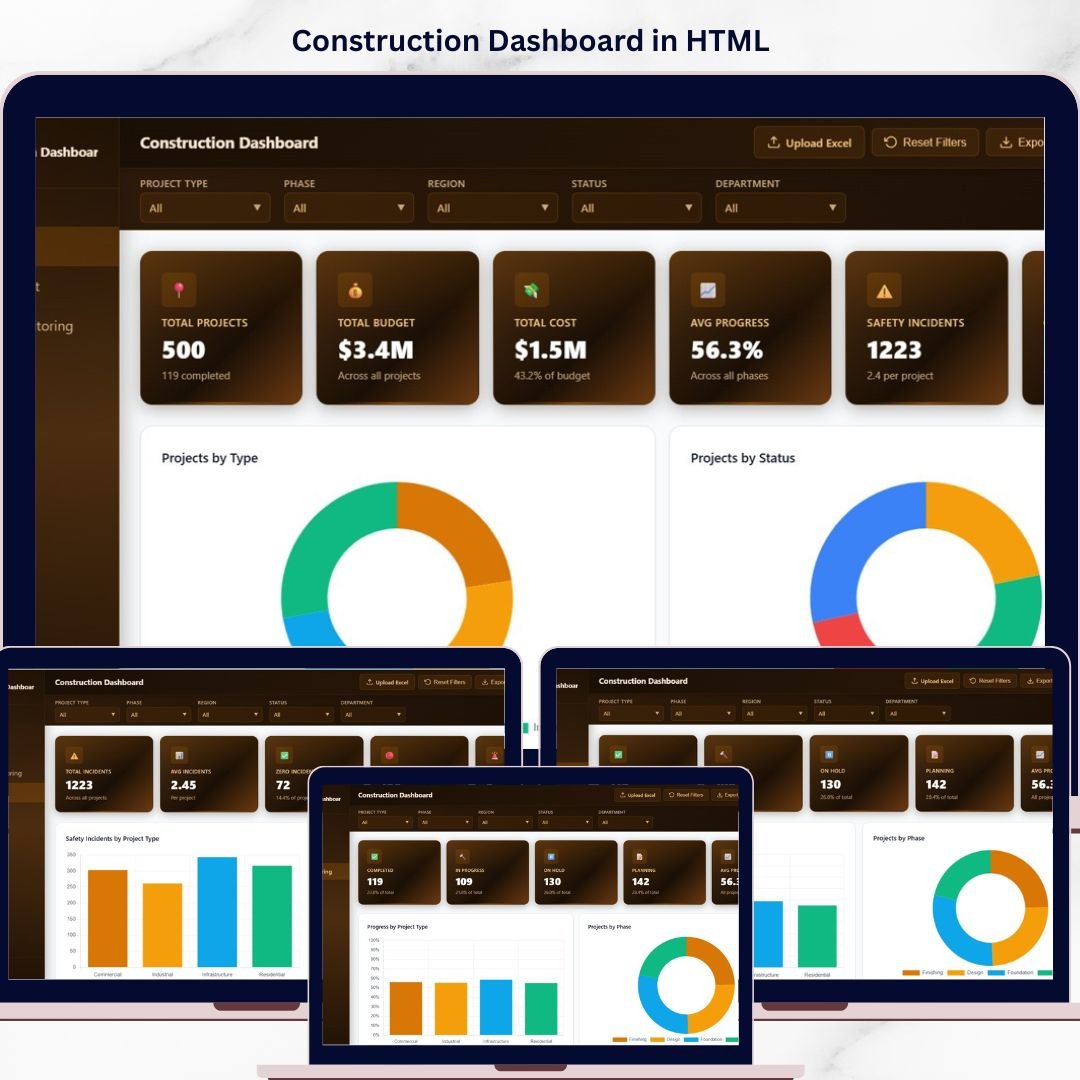
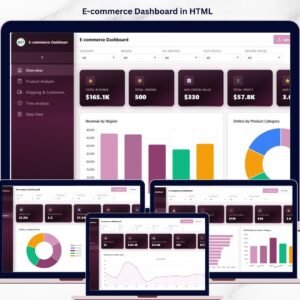
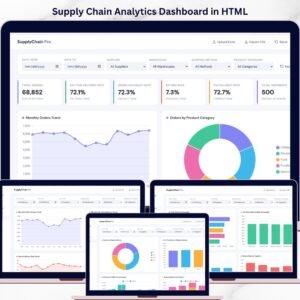
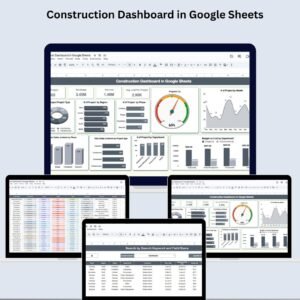
Construction Dashboard in HTML is a powerful, interactive, and visually stunning analytics solution designed for construction project managers, contractors, engineers, and stakeholders who want to monitor project performance, budget utilization, progress tracking, and safety metrics — all in one centralized dashboard. Whether you manage residential, commercial, or industrial construction projects, this HTML dashboard template provides the clarity and control you need to make faster, smarter decisions 🚀.
🔑 Key Features of Construction Dashboard in HTML
🏗️ 5 Interactive Dashboard Pages – Explore construction data across Overview, Budget vs Cost, Progress Monitoring, Safety and Risk, and a detailed Data View page — each purpose-built for a specific analytical perspective.
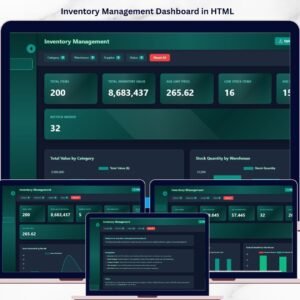
📊 Dynamic KPI Cards – Instantly track high-level metrics including Total Projects, Total Budget, Total Cost, Average Progress, Safety Incidents, and Over Budget indicators at a glance.
🔍 Advanced Slicers and Filters – Filter the entire dashboard by Region, Project Type, Department, Status, and Phase with a single click for targeted construction analytics.
📈 Budget vs Cost Analysis – Compare planned budgets against actual costs across project types, departments, and phases to detect overruns early.
📅 Progress Monitoring System – Track average project progress by region, project type, and department with monthly trend analysis for real-time visibility.
⚠️ Safety and Risk Tracking – Monitor safety incidents by project type, region, and department to identify high-risk areas and improve safety protocols.
📋 Detailed Data View Table – Access all project records with search, sort, pagination, and CSV export functionality for granular data exploration.
🎨 Professional Visual Design – Clean, modern chart layouts with consistent color themes that make presenting findings to stakeholders effortless and impactful.
📦 What’s Inside the Construction Dashboard in HTML
This ready-to-use HTML dashboard includes 5 powerful analytical pages designed to provide comprehensive construction project insights:
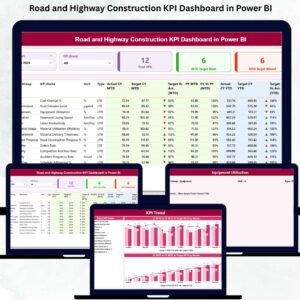
📊 Page 1 – Overview Page
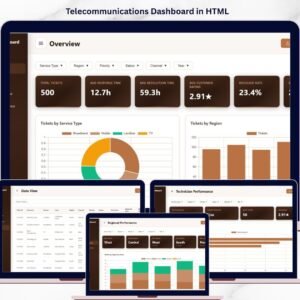
Your command center for construction monitoring. At the top, dynamic KPI cards display Total Projects, Total Budget, Total Cost, Average Progress, Safety Incidents, and Over Budget. Below, interactive charts present Projects by Type showing the distribution across construction categories, Projects by Status revealing active, completed, and delayed breakdowns, Budget vs Cost by Region highlighting regional spending patterns, Projects by Region comparing project volumes geographically, and Monthly Project Count tracking new project launches across months. Multiple slicers let you filter and explore the dashboard instantly.
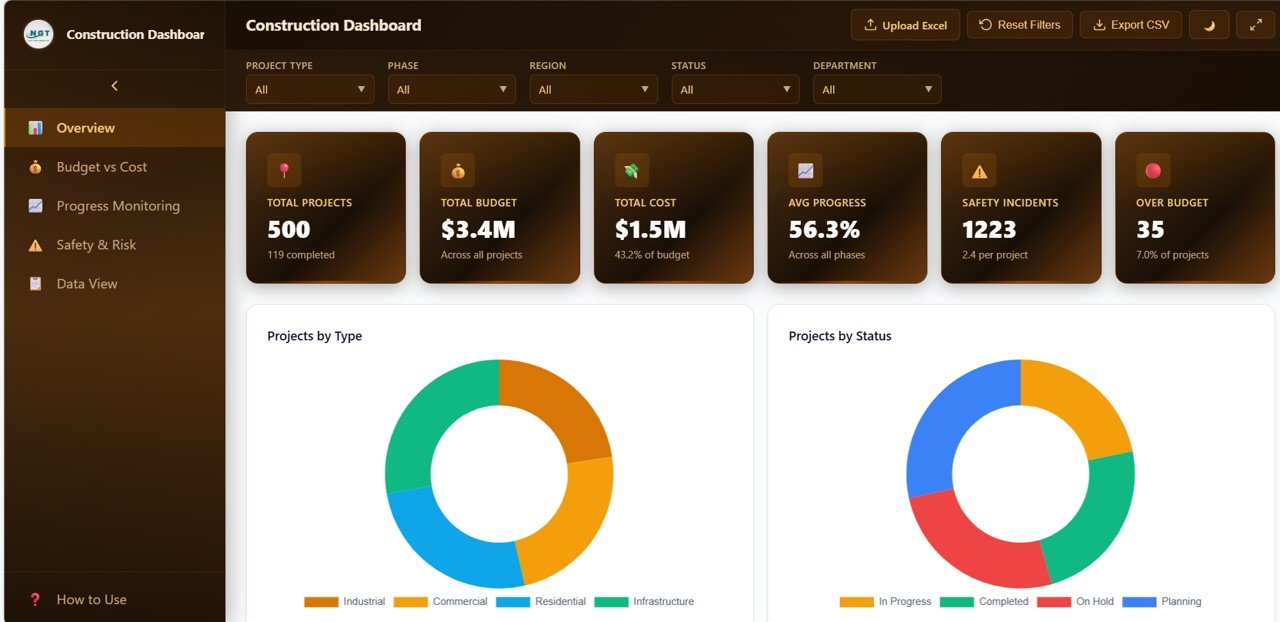
Construction Dashboard Overview
💰 Page 2 – Budget vs Cost
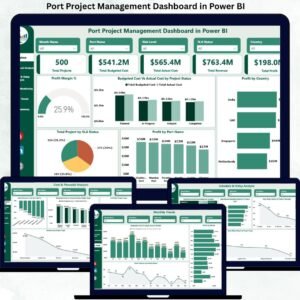
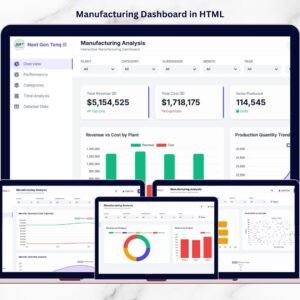
Dive deep into financial analysis with charts for Budget vs Cost by Project Type comparing planned versus actual spending across categories, Budget Status Distribution showing how many projects are under, on, or over budget, Budget vs Cost by Department revealing departmental spending efficiency, Cost Incurred by Phase tracking expenses at each construction stage, and Monthly Budget vs Cost Trend monitoring financial performance over time. Explore our Urban Metro Development KPI Dashboard in Power BI for more infrastructure solutions.
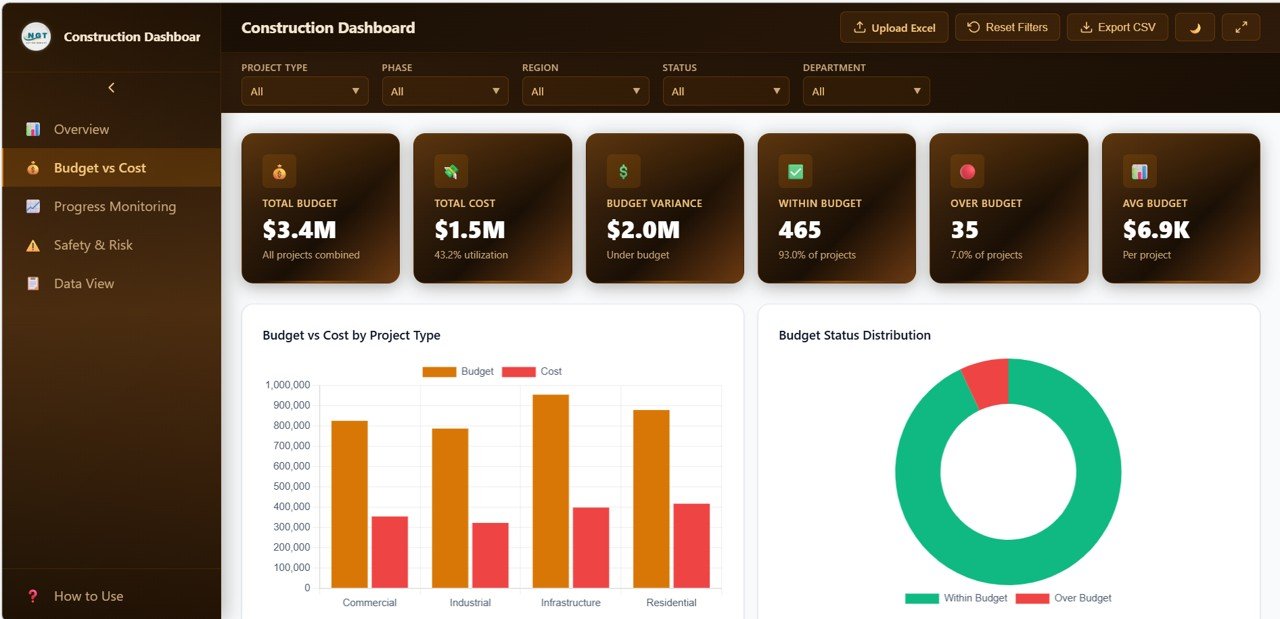
Budget vs Cost Analysis
📈 Page 3 – Progress Monitoring
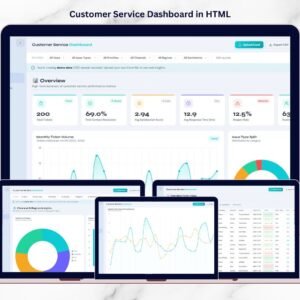
Track project completion rates with charts for Progress by Project Type analyzing completion percentages across categories, Projects by Phase showing the pipeline distribution, Average Progress by Region comparing regional completion rates, Status Distribution by Department revealing department-level project health, and Monthly Average Progress Trend tracking overall project momentum month by month.
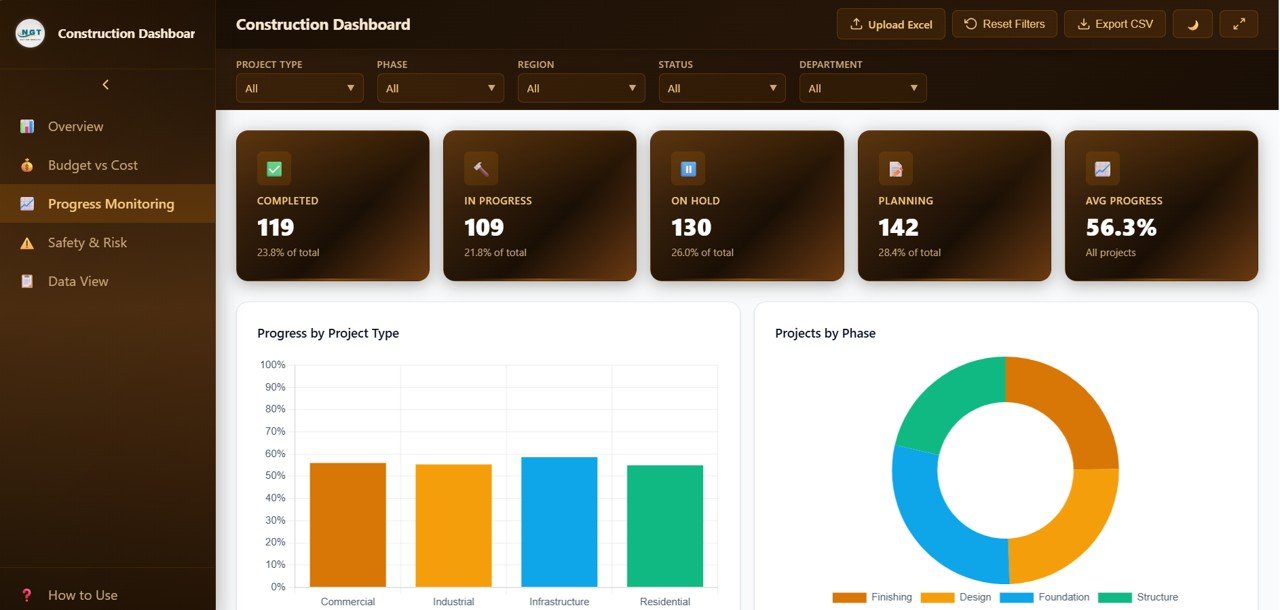
Progress Monitoring
⚠️ Page 4 – Safety and Risk
Monitor workplace safety with charts for Safety Incidents by Project Type identifying which project categories carry the most risk, Safety Incidents by Region highlighting geographical risk hotspots, Incident Distribution breaking down incident types, Safety Incidents by Department showing departmental safety performance, and Monthly Safety Incidents Trend tracking how safety metrics evolve over time.
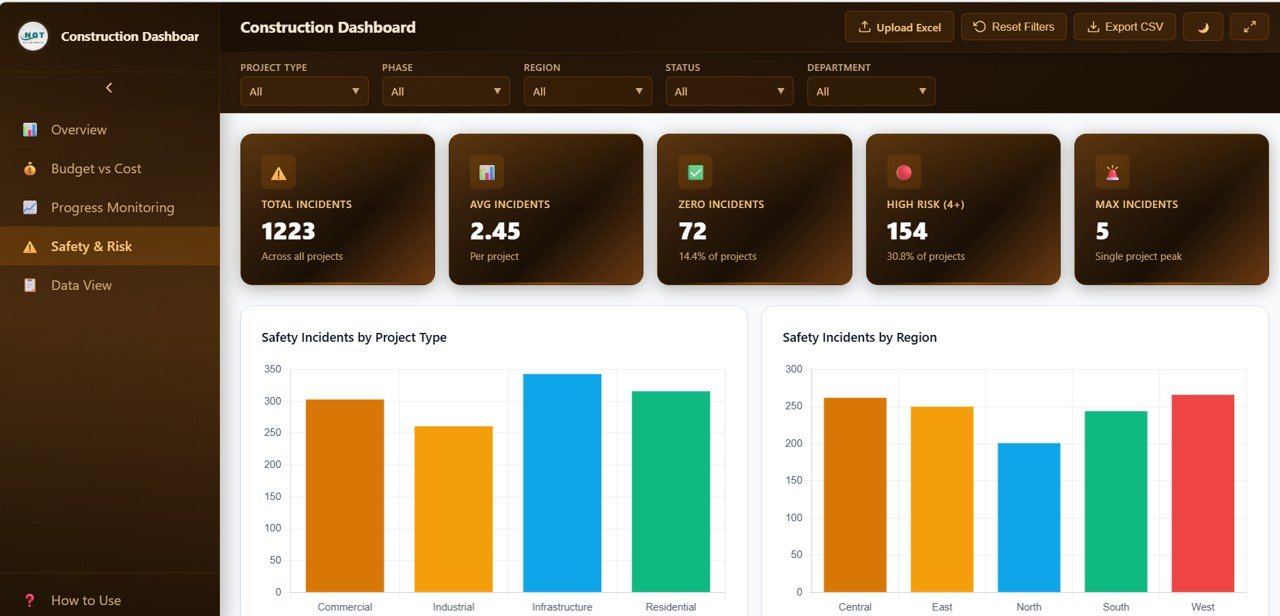
Safety and Risk Analysis
📋 Page 5 – Data View
This is the detailed data table page. Here you can see all the construction project records with powerful search, sort, and pagination features. You can also export the filtered data to CSV for further offline analysis and reporting.
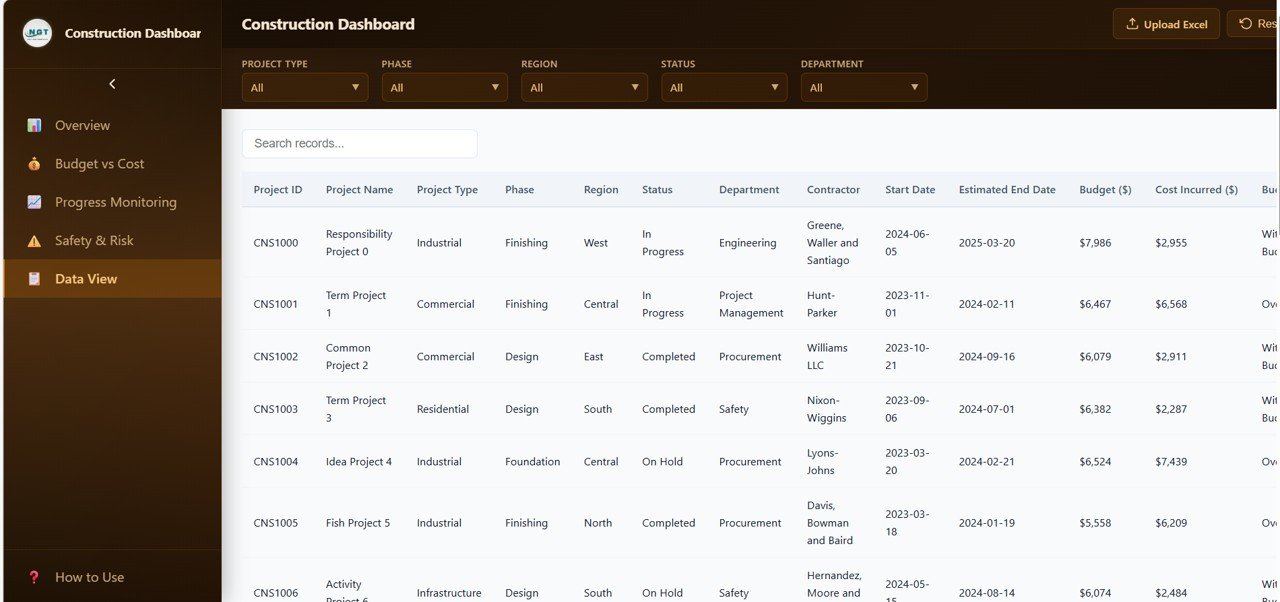
Data View Tab
⚙️ How to Use the Construction Dashboard in HTML
1️⃣ Download and extract the .zip file containing the HTML dashboard files
2️⃣ Open the main HTML file in any modern web browser (Chrome, Edge, Firefox)
3️⃣ Replace the sample data with your own construction project records
4️⃣ Use the slicers and filters on each page to explore project metrics
5️⃣ Navigate between the 5 dashboard pages to analyze different aspects
6️⃣ Export data from the Data View tab to CSV for offline reporting
7️⃣ Share the HTML file with team members or host it on your internal server
👥 Who Can Benefit from This Construction Dashboard in HTML
🏗️ Construction Project Managers – Monitor project progress, budgets, and timelines across all active sites
🏢 General Contractors – Track multiple construction projects and identify cost overruns quickly
👷 Safety Officers – Monitor safety incidents and implement risk mitigation strategies
📊 Data Analysts – Generate actionable insights from construction performance data
🏛️ Government Infrastructure Agencies – Oversee public construction projects with clear performance dashboards
🏠 Real Estate Developers – Track residential and commercial project pipelines efficiently
📖 Click here to read the Detailed Blog Post
🎥 Visit our YouTube channel to learn step-by-step video tutorials
👉 YouTube.com/@NextGenTemplates


Reviews
There are no reviews yet.