


🏗 Construction and Real Estate Risk Management KPI Dashboard in Excel – Your Ultimate Risk Tracking Solution
Managing risks in construction and real estate projects is a high-stakes challenge. Whether it’s budget overruns, schedule delays, compliance failures, or safety incidents, these risks can quickly derail a project. That’s why having a centralized, interactive, and data-driven tool is essential.
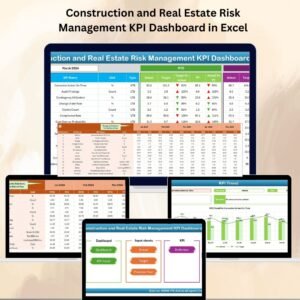
The Construction and Real Estate Risk Management KPI Dashboard in Excel is a ready-to-use Excel template designed to monitor, analyze, and control project risks in real time. With intuitive navigation, dynamic dashboards, and powerful trend analysis, it empowers project managers, developers, and investors to stay ahead of potential issues and make smarter decisions.
✨ Key Features of the Construction and Real Estate Risk Management KPI Dashboard

✅ Centralized Risk Monitoring – View all critical KPIs in one interactive dashboard.
✅ Month-to-Date (MTD) & Year-to-Date (YTD) Tracking – Instantly compare current results with targets and last year’s performance.
✅ Dynamic Dashboard with Conditional Formatting – Up/down arrows and color coding highlight performance trends at a glance.
✅ KPI Trend Analysis – Select any KPI from a drop-down menu to see historical patterns and risk developments.
✅ Customizable KPI Definitions – Add or edit KPIs to fit your organization’s unique risk profile.
✅ Multiple Data Sheets – Organized structure for actuals, targets, previous year data, and definitions.
✅ Quick Navigation – Home sheet with clickable buttons to move between sections.
✅ Cost-Effective & User-Friendly – No expensive software needed—just Excel.
📦 What’s Inside the Construction and Real Estate Risk Management KPI Dashboard
1️⃣ Home Sheet – Your navigation hub with one-click access to all sections.
2️⃣ Dashboard Sheet – The main visual interface showing MTD, YTD, and historical comparisons.
3️⃣ KPI Trend Sheet – Analyze individual KPI performance over time.
4️⃣ Actual Numbers Input Sheet – Log your latest performance data for instant updates.
5️⃣ Target Sheet – Define both monthly and yearly targets for every KPI.
6️⃣ Previous Year Numbers Sheet – Store last year’s results for accurate year-over-year comparisons.
7️⃣ KPI Definition Sheet – Maintain clarity with KPI names, groups, units, and formulas.
🛠 How to Use the Construction and Real Estate Risk Management KPI Dashboard
1️⃣ Download & Open the Excel file.
2️⃣ Enter KPI Definitions in the KPI Definition sheet.
3️⃣ Set Monthly & Yearly Targets in the Target Sheet.
4️⃣ Add Previous Year Data for historical comparison.
5️⃣ Update Actuals Monthly in the Actual Numbers Input sheet.
6️⃣ Analyze Results in the Dashboard and KPI Trend sheets.
7️⃣ Share Insights with stakeholders via PDF export or screen sharing.
👥 Who Can Benefit from This Dashboard
🏗 Construction Firms – Track safety, cost variance, schedule delays, and quality risks.
🏢 Real Estate Developers – Monitor sales performance, compliance, and delivery timelines.
🏠 Property Management Companies – Manage maintenance backlogs and tenant-related risks.
💼 Project Investors – Assess financial and operational risks before they escalate.
📊 Consultants & Risk Managers – Provide clients with clear, visual, and data-backed insights.
💡 Why This Dashboard is a Game-Changer
-
Proactive Risk Management – Identify problems before they become costly crises.
-
Historical Trend Analysis – Learn from past performance to improve future planning.
-
Customizable for Any Project – Modify KPIs, targets, and data structures easily.
-
Fast Decision-Making – Visual indicators make it easy to see where immediate action is needed.
-
Budget-Friendly Solution – Delivers premium risk monitoring without high software costs.
📌 Best Practices for Maximum Impact
-
📅 Update Data Regularly – Keep your dashboard accurate with monthly or weekly updates.
-
📏 Standardize Units & Formats – Avoid confusion in KPI measurements.
-
🎯 Define KPIs Clearly – Ensure all stakeholders understand the metrics.
-
🔍 Review Trends Frequently – Detect risks early by analyzing KPI patterns.
-
🤝 Collaborate with Teams – Share reports with decision-makers for informed action.
📖 Click here to read the Detailed Blog Post
📺 Visit our YouTube Channel to learn step-by-step video tutorials.


Reviews
There are no reviews yet.