


The Conflict Resolution KPI Dashboard in Excel is an essential tool for HR professionals and managers to monitor, track, and optimize their conflict resolution processes. This dashboard allows you to gain insights into critical performance indicators (KPIs) related to managing conflicts within the organization. By using this dashboard, you can ensure that your conflict resolution strategies are effective, and continuously improve workplace harmony.

Key Features of the Conflict Resolution KPI Dashboard in Excel
📊 Comprehensive KPI Tracking
-
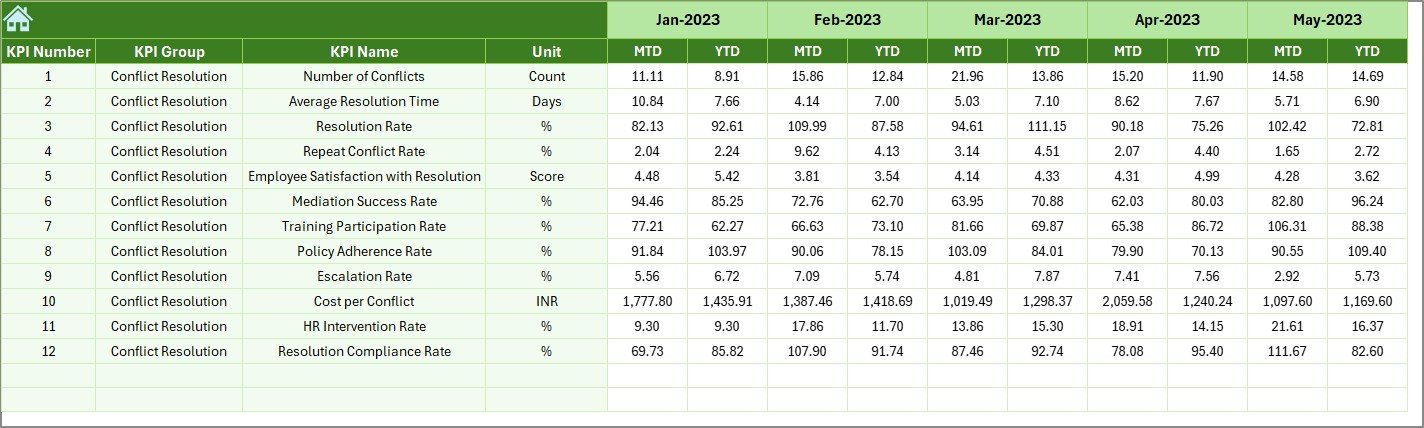
Track Key Metrics: Monitor critical KPIs such as conflict resolution time, number of conflicts reported, satisfaction rates, and recurrence rates of conflicts.
-
Measure Effectiveness: Use the data to evaluate the success of your conflict resolution processes and strategies.
📈 Visual Analytics
-
Data Visualization: Leverage interactive charts and graphs to visualize trends, identify patterns, and pinpoint areas needing improvement.
-
Monitor Progress: Keep an eye on progress over time with visual representation of data, including improvements or recurring issues.
🔧 Customizable Dashboard
-
Tailor KPIs: Customize the dashboard to track KPIs that are most relevant to your conflict resolution objectives and goals.
-
Adjust Layouts: Modify the dashboard to reflect the unique needs of your organization and how you handle conflict.
📅 Real-Time Data Integration
-
Instant Updates: Easily integrate with your existing data sources to ensure that the metrics are always up to date.
-
Accurate Reporting: Automate data entry and make your reporting process quicker and more reliable.
Benefits of Using the Conflict Resolution KPI Dashboard
✅ Informed Decision-Making
The dashboard provides real-time insights, enabling HR and management to make informed decisions regarding conflict management strategies.
✅ Improved Conflict Management
Analyze the data to identify recurring problems, trends, and areas for improvement, leading to more efficient conflict resolution strategies.
✅ Boosted Employee Satisfaction
By tracking key conflict resolution metrics, organizations can improve their processes, reduce employee dissatisfaction, and create a positive work environment.
✅ Resource Optimization
Understand where conflicts arise most frequently and optimize resource allocation to address the root causes of conflicts more effectively.
How to Use the Conflict Resolution KPI Dashboard in Excel
-
Download the Template: Download the Conflict Resolution KPI Dashboard template and save it to your Excel.
-
Input Data: Input your organization’s data on conflict resolution, including details like conflict type, duration, outcomes, and employee satisfaction levels.
-
Customize the Dashboard: Adjust the dashboard to reflect your organization’s unique conflict resolution processes and KPIs.
-
Monitor Data: Regularly track the metrics, using charts and graphs to evaluate progress and effectiveness.
-
Take Action: Use the insights to make necessary changes to conflict resolution strategies, ensuring a more harmonious and productive work environment.
By using the Conflict Resolution KPI Dashboard in Excel, organizations can enhance their ability to resolve conflicts efficiently, improve employee satisfaction, and optimize conflict management processes.
Click here to read the Detailed blog post
Conflict Resolution KPI Dashboard in Excel
Visit our YouTube channel to learn step-by-step video tutorials
YouTube.com/@PKAnExcelExpert


Reviews
There are no reviews yet.