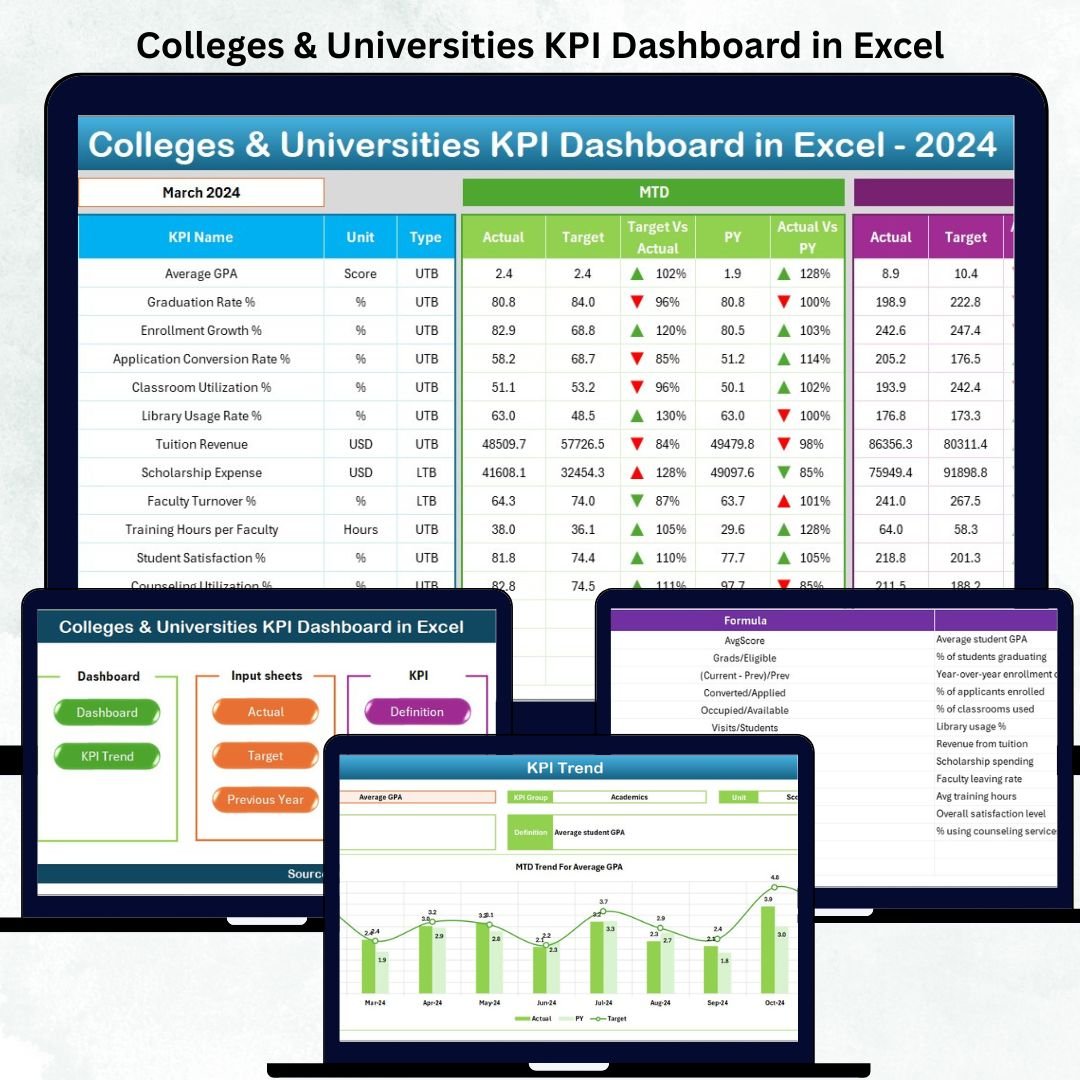
Managing performance in colleges and universities becomes simple when all your academic, operational, and administrative KPIs appear in one clean, automated, and professional Excel dashboard. Whether you are handling admissions, academic results, attendance, budgeting, or research output, this Colleges & Universities KPI Dashboard in Excel gives you a powerful, ready-to-use performance monitoring solution—without needing any advanced Excel skills.Colleges & Universities KPI Dashboard in Excel
This premium Excel dashboard is designed to help institutions track Month-to-Date (MTD) and Year-to-Date (YTD) numbers, compare progress with targets, study previous year trends, monitor monthly performance, and get instant insights using dynamic charts, tables, and conditional indicators. With structured sheets, smart formulas, automated updates, and user-friendly navigation, this template becomes your institution’s performance command center.
✅ ✨ Key Features of Colleges & Universities KPI Dashboard in Excel
This dashboard is packed with practical, high-value features designed for real academic environments:Colleges & Universities KPI Dashboard in Excel
📌 Dynamic Month Selection
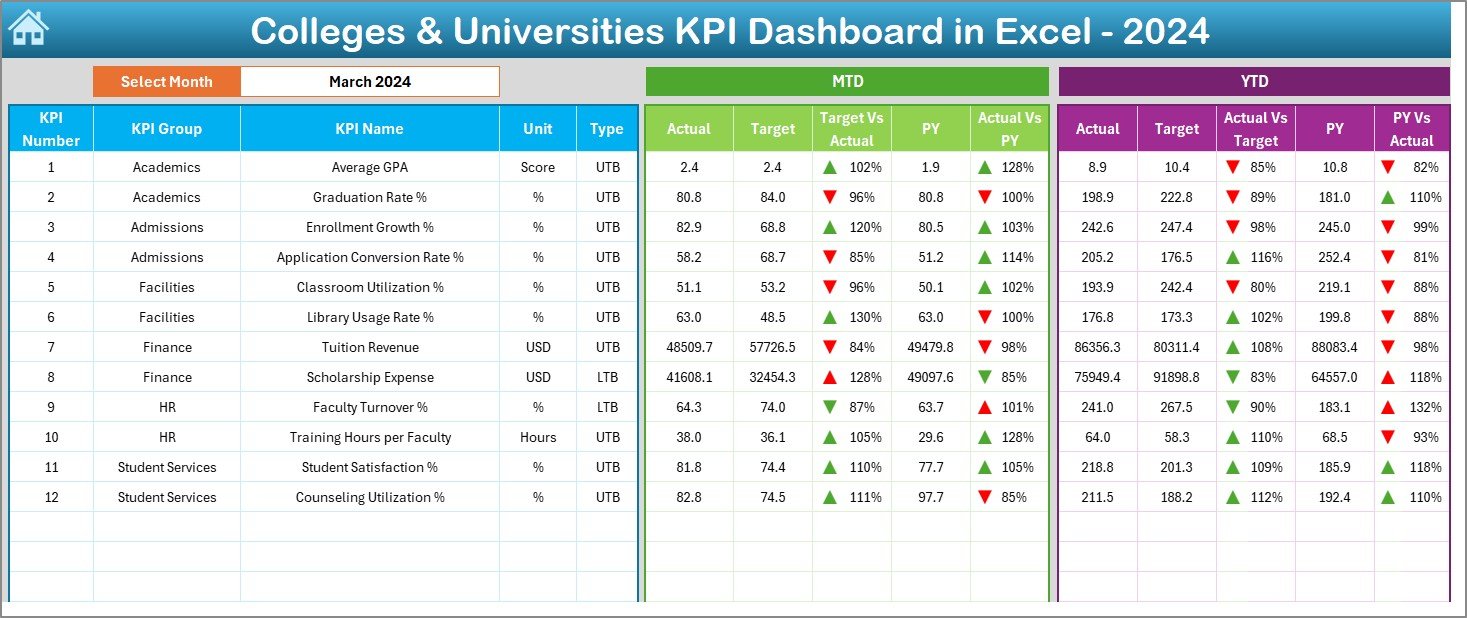
Select any month from a single drop-down, and the entire dashboard updates automatically, saving hours of manual reporting.
📌 MTD & YTD Comparison in One View
Track Actual vs Target and Actual vs Previous Year for every KPI with visual indicators.
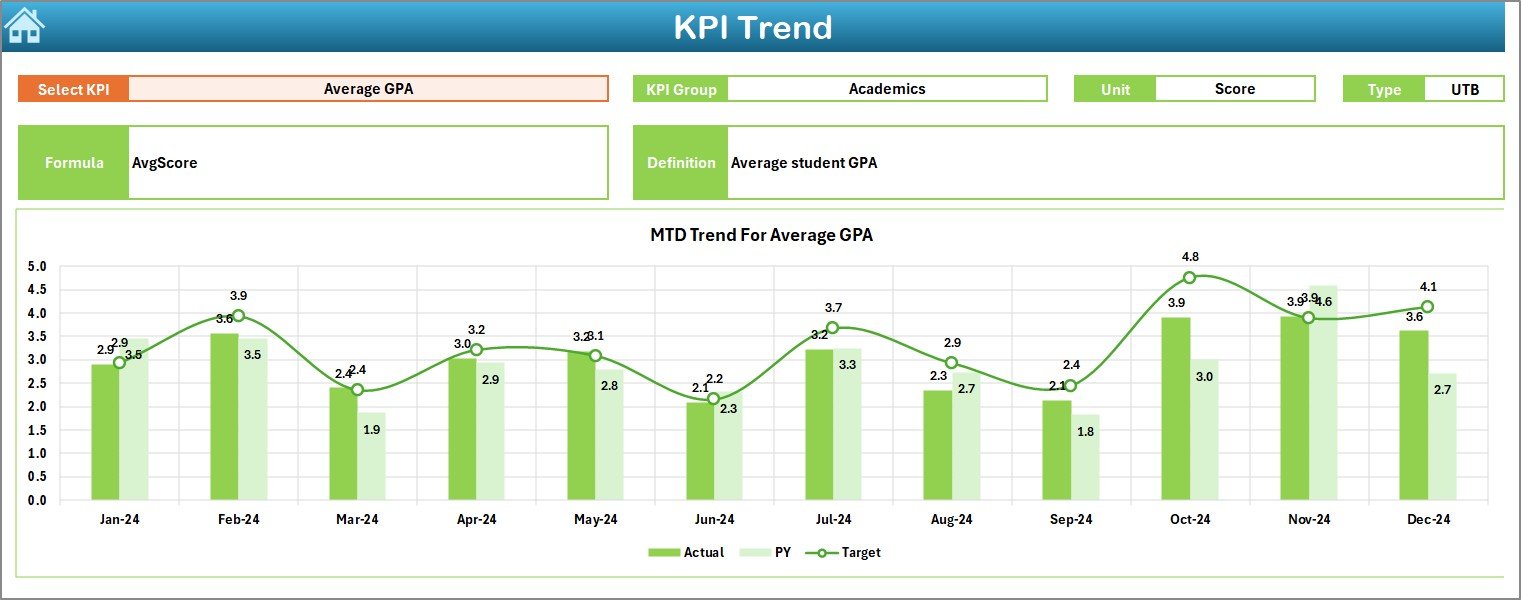
📌 Automated Trend Charts
Identify improvement or decline using MTD and YTD trend graphs for each KPI.
📌 User-Friendly Navigation Buttons
Jump between sheets instantly using an intuitive Summary Page with quick links.Colleges & Universities KPI Dashboard in Excel
📌 Fully Editable & Customizable
Modify, add, or remove KPIs to fit your institution’s needs—no coding required.
📌 Professionally Structured Worksheets
Seven organized sheets help different departments work efficiently and consistently.
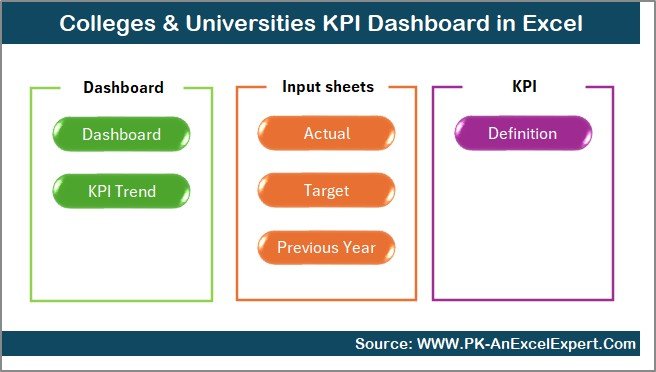
✅ 📦 What’s Inside the Colleges & Universities KPI Dashboard
You get a complete Excel system that includes:
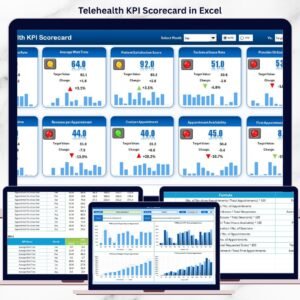
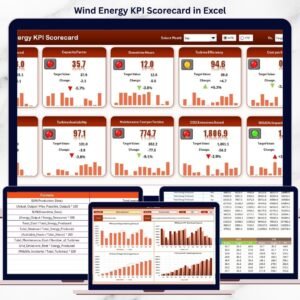
📄 1. Summary Page
A clean navigation hub with buttons for every key section.
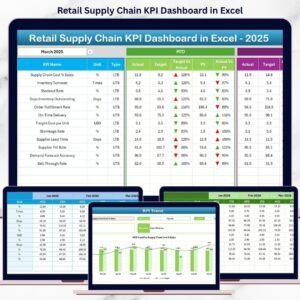
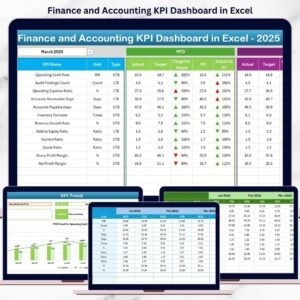
📄 2. Dashboard Sheet
The main performance page showing MTD/YTD actuals, targets, and previous year comparisons.
📄 3. Trend Sheet
Deep dive into KPI trends, performance patterns, seasonal effects, and long-term improvements.
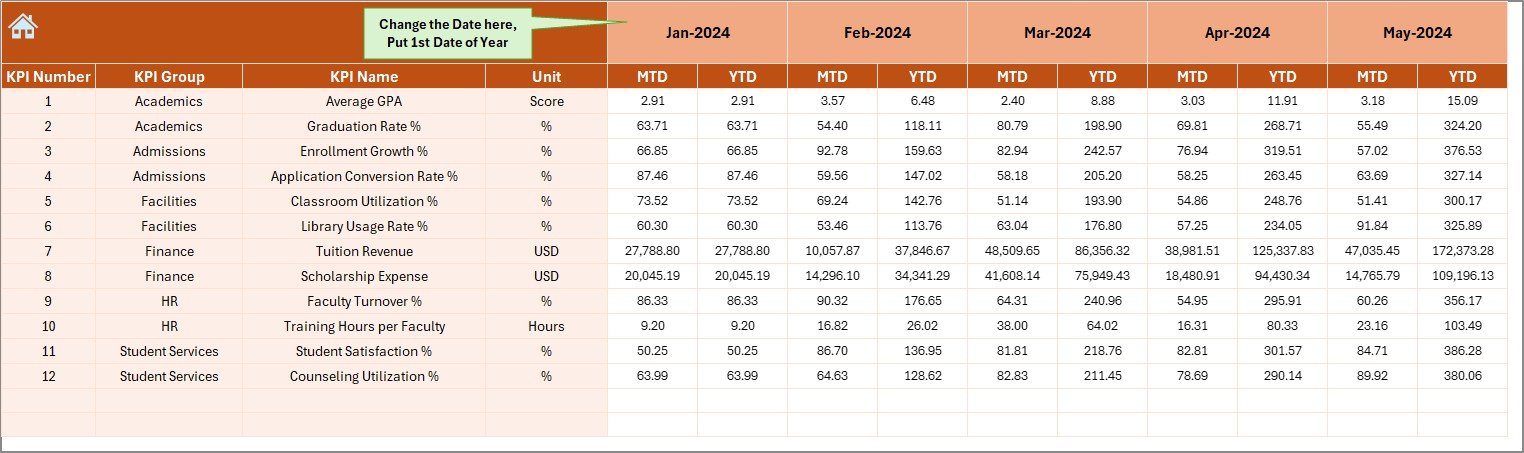
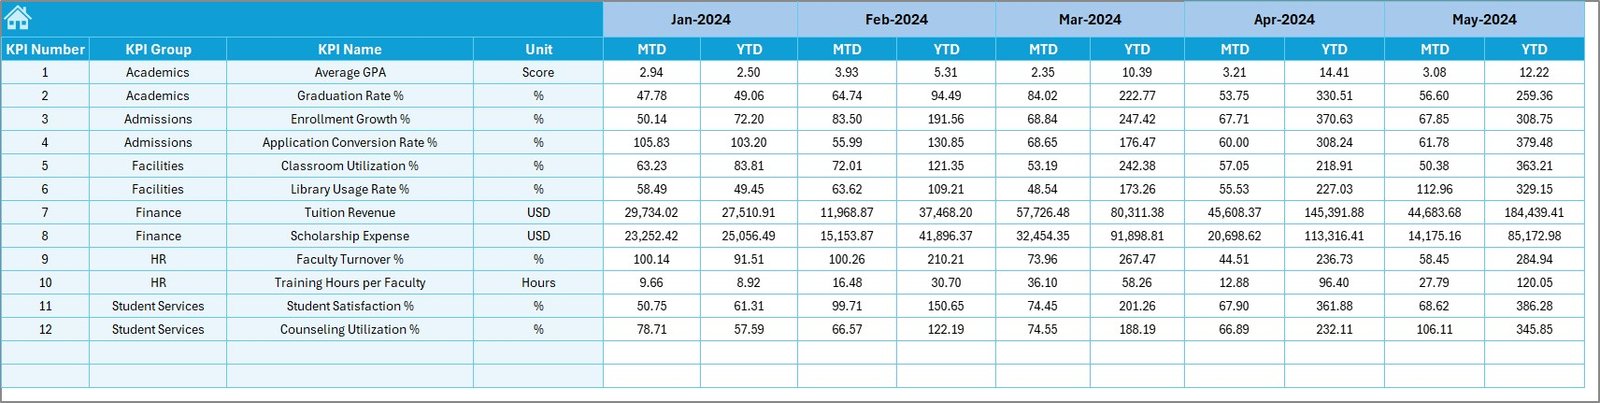
📄 4. Actual Numbers Sheet
Enter monthly data and instantly update your dashboard.
📄 5. Target Sheet
Set monthly MTD/YTD targets for academic, operational, and administrative KPIs.
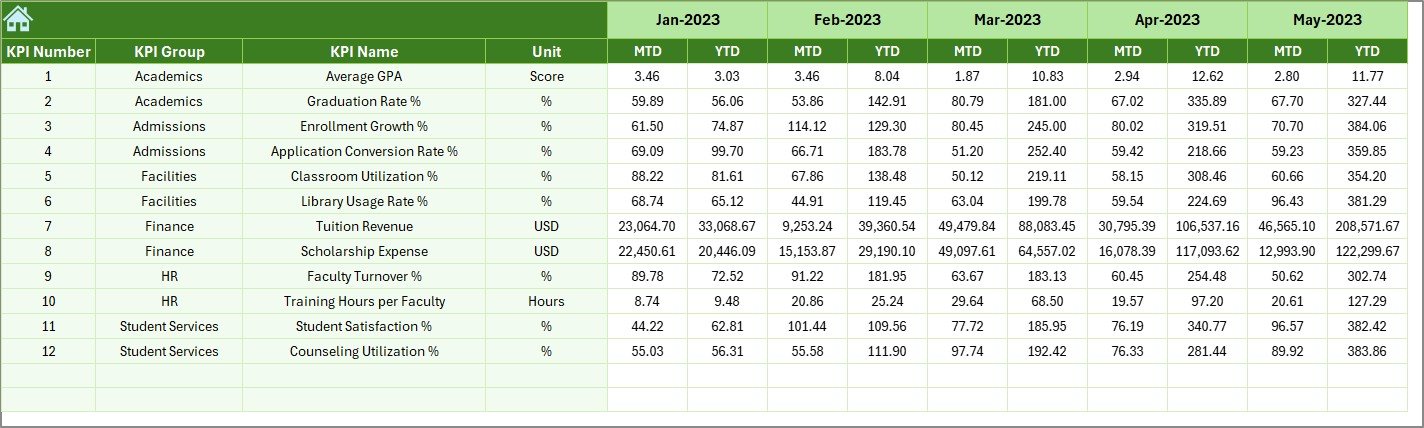
📄 6. Previous Year Sheet
Store historical values for meaningful year-over-year analysis.
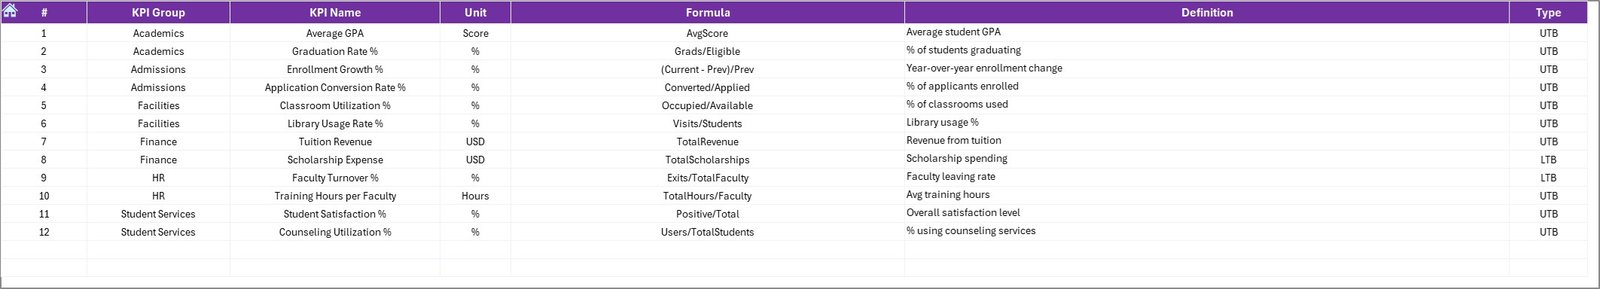
📄 7. KPI Definition Sheet
A full KPI library with units, formulas, type (LTB/UTB), and detailed definitions.
✅ 🛠️ How to Use the Colleges & Universities KPI Dashboard
This template is extremely easy to use—even for beginners:
➡️ Step 1: Enter your monthly Actual Numbers
Input MTD & YTD values in the Actual Numbers sheet.
➡️ Step 2: Set your Targets
Define goals in the Target Sheet for each KPI.
➡️ Step 3: Add Previous Year Data (Optional)
Helps in better trend comparison and yearly analysis.
➡️ Step 4: Select any month
Choose a month from the drop-down in the Dashboard Sheet.Colleges & Universities KPI Dashboard in Excel
➡️ Step 5: Review performance insights
See instant visual updates, charts, arrows, and comparisons.
➡️ Step 6: Use trend charts for planning
Identify gaps, monitor growth, and plan improvements.
✅ 👥 Who Can Benefit from This KPI Dashboard in Excel?
This dashboard is a perfect fit for:
🎓 Academic Administrators
Track academic and student performance consistently.
🏫 University & College Management Teams
Make strategic decisions using data-driven insights.
Colleges & Universities KPI Dashboard in Excel
👨🏫 Faculty & Department Heads
Monitor departmental outcomes and improvement areas.
📊 Finance & Operations Teams
Track budgets, revenue, attendance, occupancy, and more.
📚 Training Institutes & Coaching Centers
Adapt the dashboard for student results, attendance, or operations.
Whether your institution is small or large, public or private—this dashboard gives you a complete performance monitoring system inside Excel.
### Click here to read the Detailed blog post
Watch the step-by-step video tutorial:


Reviews
There are no reviews yet.