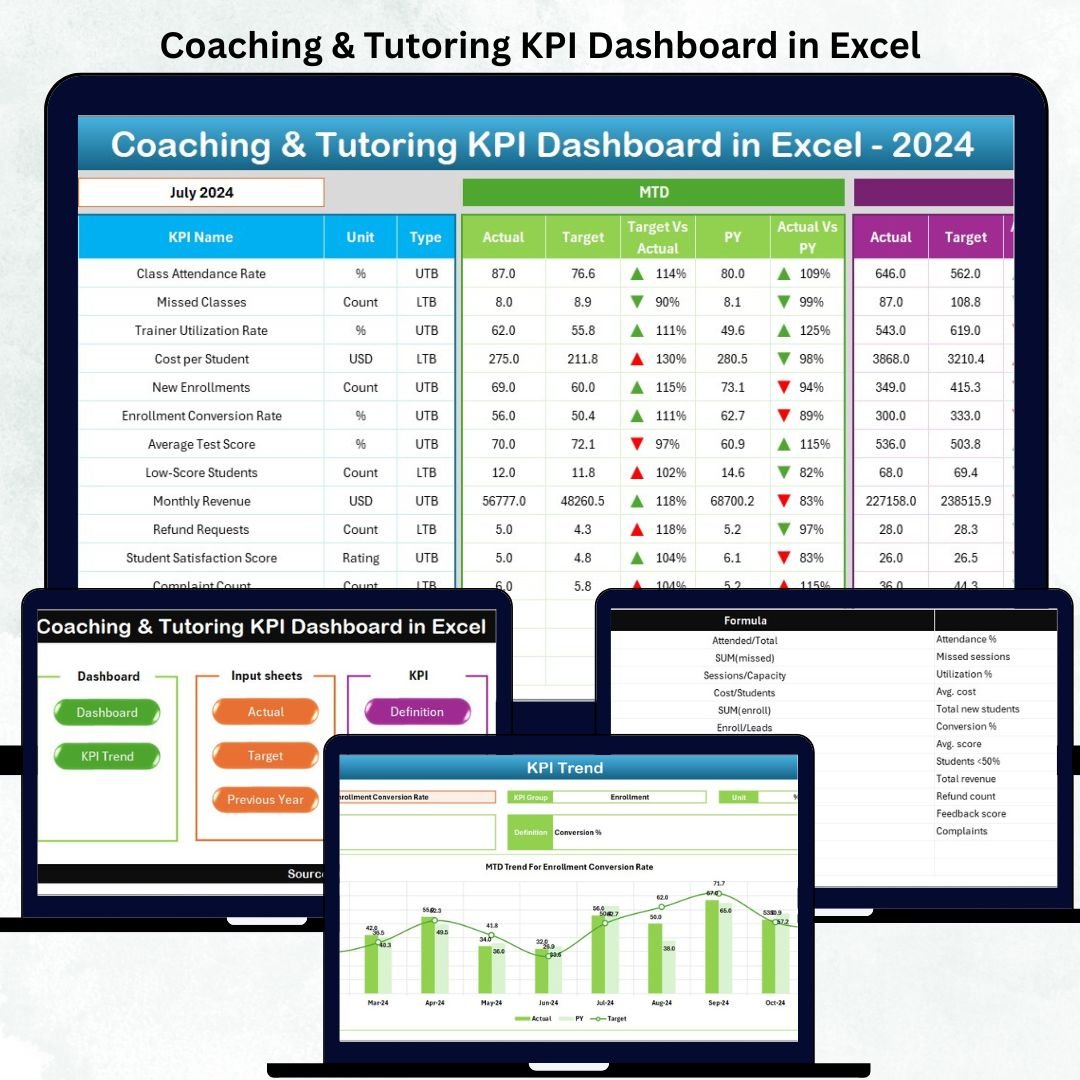
Managing a coaching or tutoring institute involves much more than delivering lectures. You need to track student performance, monitor tutor quality, analyze revenue, manage attendance, and maintain consistent academic results. When all this data sits across multiple Excel sheets, files, or manual reports, it becomes difficult to understand what’s working and what needs improvement. That’s exactly why we created the Coaching & Tutoring KPI Dashboard in Excel — a complete performance management system designed to simplify your entire coaching operations effortlessly.Coaching & Tutoring KPI Dashboard in Excel,
This powerful Excel dashboard helps you view Month-to-Date (MTD) and Year-to-Date (YTD) performance, analyze trends, monitor targets, and make faster decisions. Whether you manage a coaching center, private tuition class, online tutoring platform, or academic institute, this dashboard provides the insights you need to grow consistently.Coaching & Tutoring KPI Dashboard in Excel.
✨ Key Features of the Coaching & Tutoring KPI Dashboard in Excel
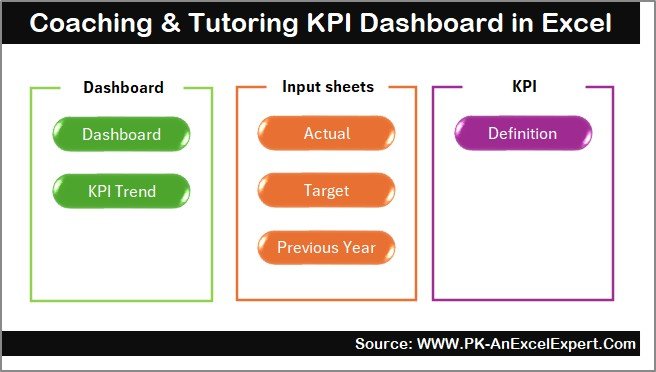
Our dashboard is designed with seven smartly structured worksheets that help you manage your entire coaching performance from one place.
🔹 Summary Page – Your Navigation Hub
The Summary Page includes six clickable buttons that take you directly to other sheets. This ensures quick navigation and saves time when reviewing KPIs.Coaching & Tutoring KPI Dashboard in Excel.
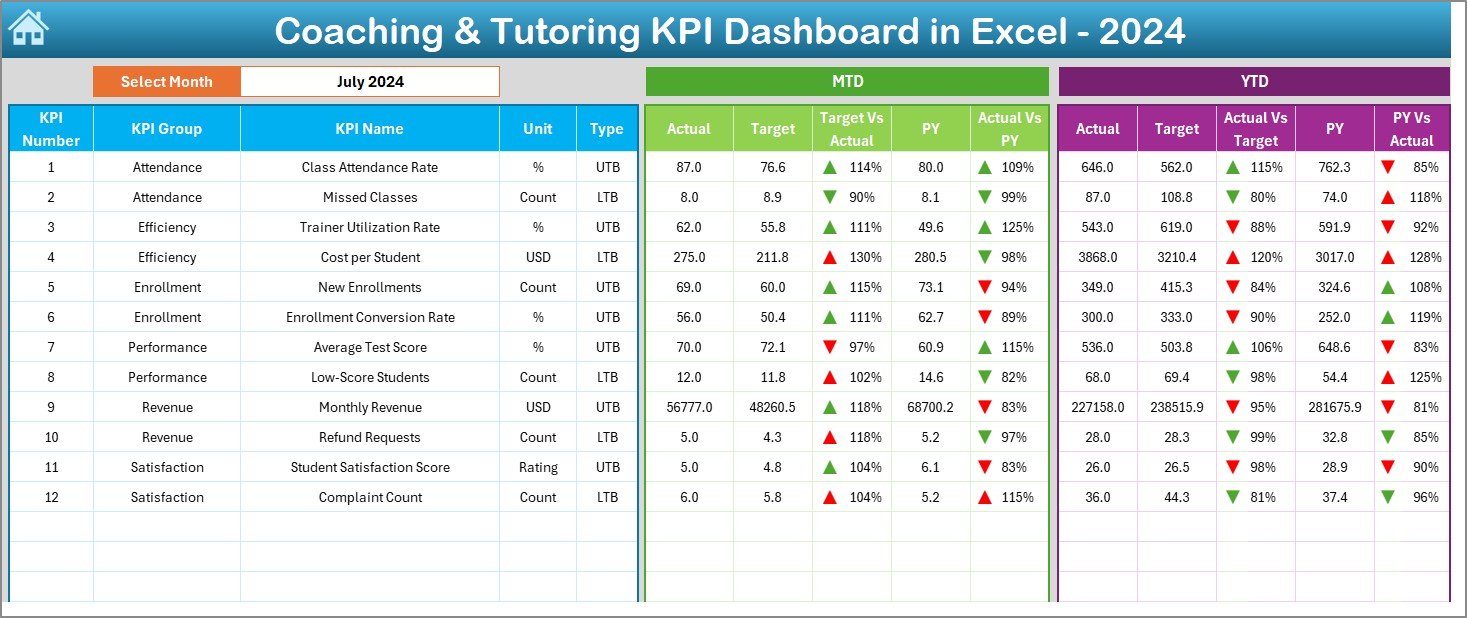
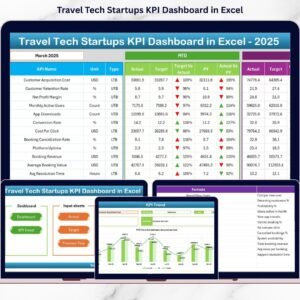
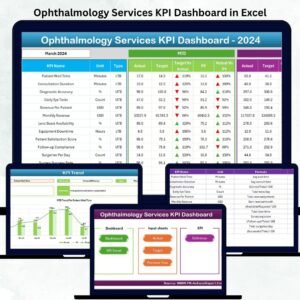
🔹 Dashboard Sheet – Complete MTD & YTD Insights
This is the main performance page where you can select any month from a dropdown and instantly see:
-
📌 Actual, Target & Previous Year values
-
📌 MTD and YTD summaries
-
📌 Target vs Actual comparison
-
📌 Previous Year vs Actual comparison
-
📌 Up/Down indicator arrows for performance clarity
Everything refreshes automatically with one click.
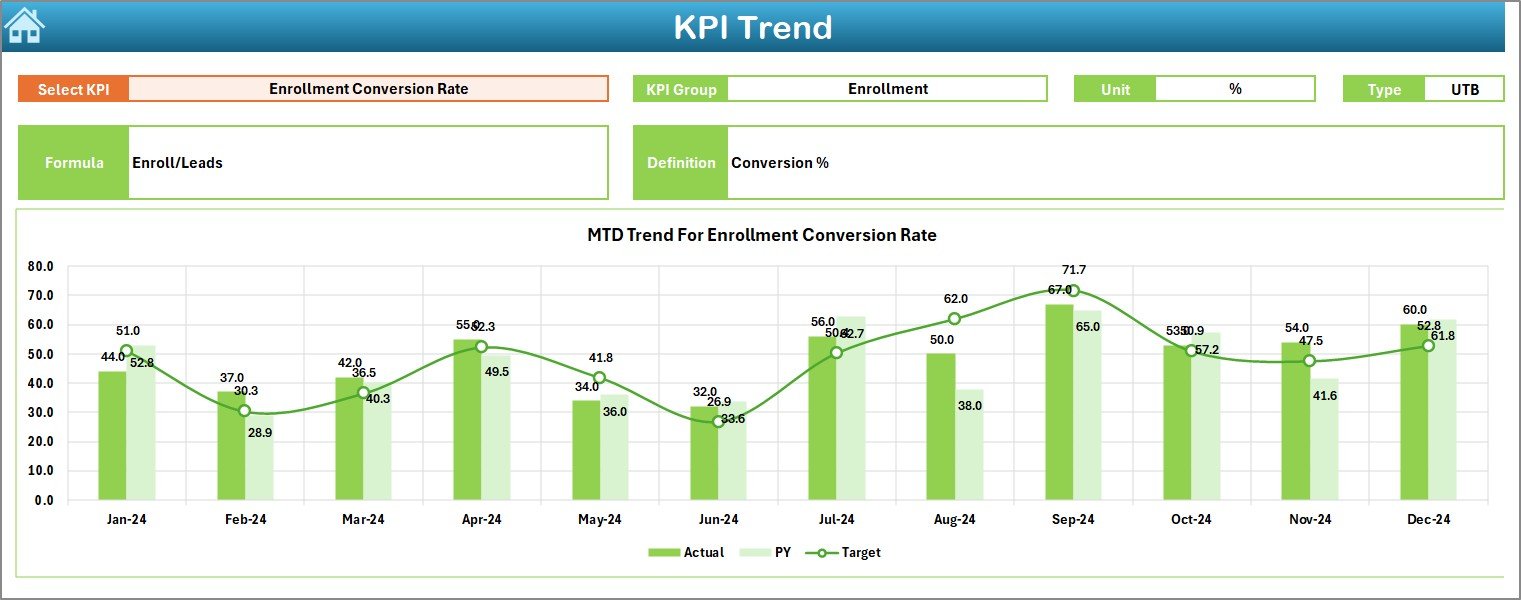
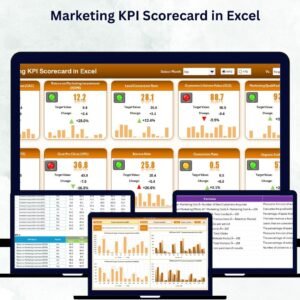
🔹 Trend Sheet – Visual KPI Analysis
Choose any KPI from a dropdown to view:
-
KPI definition
-
KPI unit
-
KPI formula
-
KPI type (UTB / LTB)
-
Monthly trend charts
-
Actual vs Target vs Previous Year
This sheet shows which KPIs are improving and which need attention.
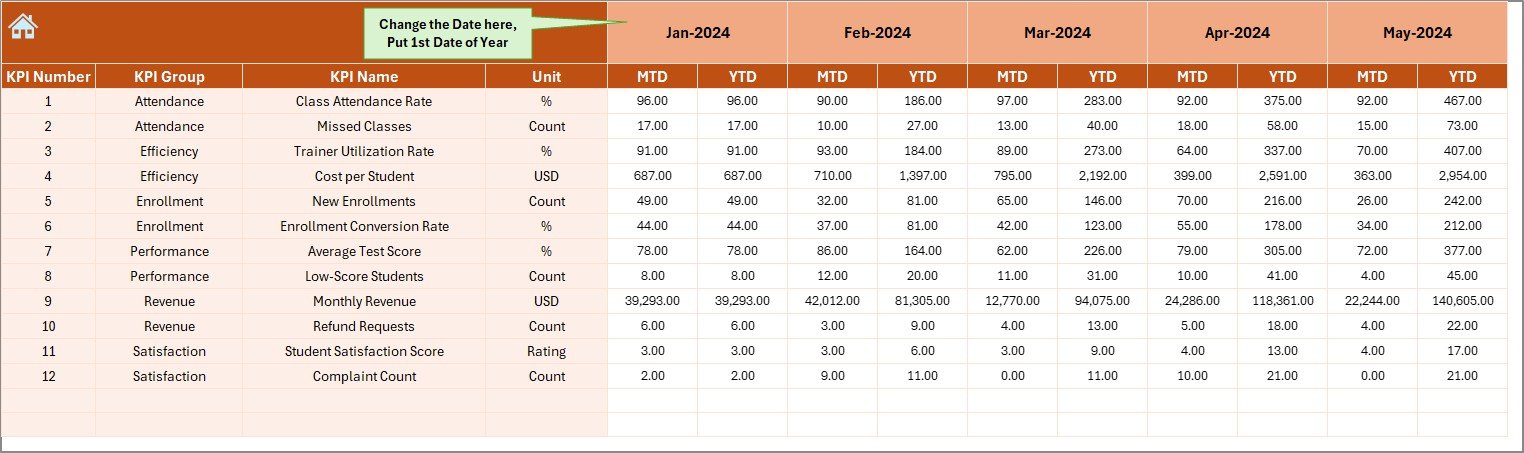
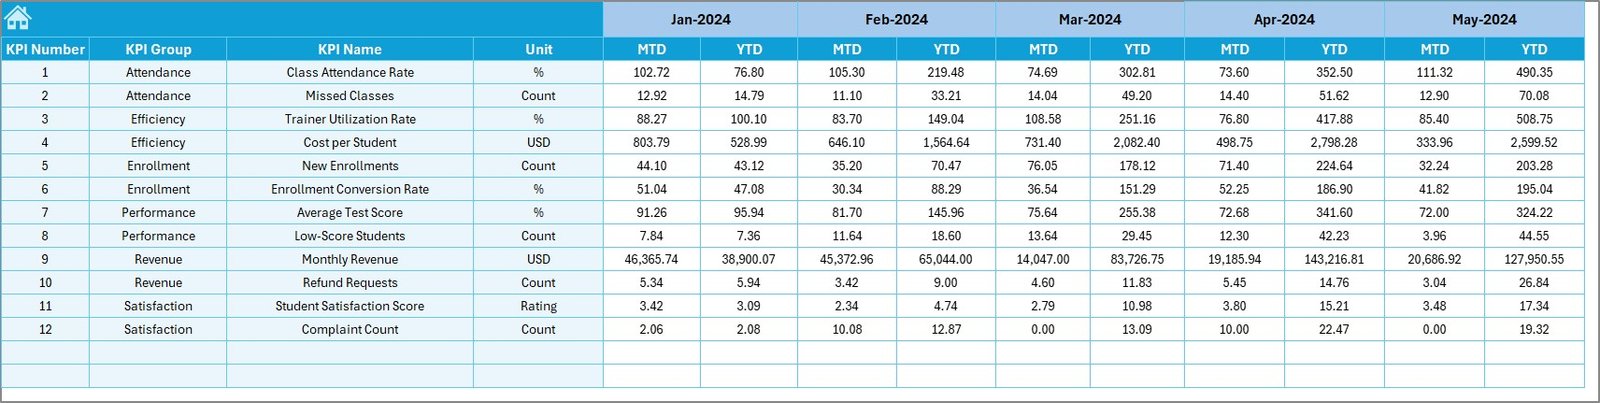
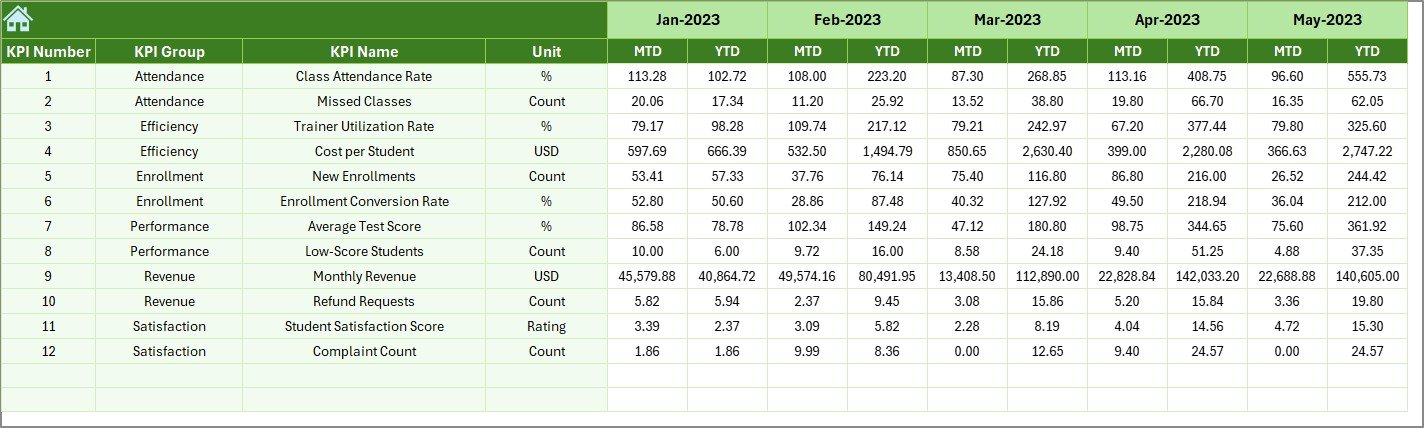
🔹 Actual, Target & Previous Year Input Sheets
Enter your monthly data in simple columns. The dashboard updates automatically, giving you real-time results without any manual calculation.
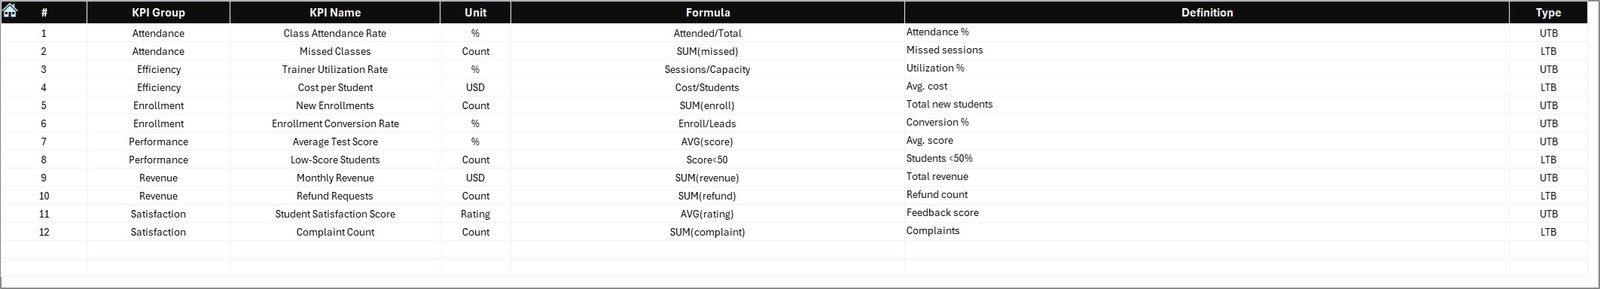
🔹 KPI Definition Sheet
Every KPI includes:
-
Name
-
Group
-
Unit
-
Formula
-
Definition
This helps educators understand their metrics clearly.
📦 What’s Inside the Coaching & Tutoring KPI Dashboard in Excel
Here’s everything included inside the downloadable Excel file:Coaching & Tutoring KPI Dashboard in Excel
-
✔ 7 Organized Worksheets
-
✔ Dropdown Month Selector
-
✔ KPI Trend Charts
-
✔ MTD & YTD Performance View
-
✔ Target vs Actual Comparison
-
✔ Previous Year Analysis
-
✔ KPI Library (Definition Sheet)
-
✔ Fully Automated Dashboard
-
✔ Easy navigation buttons
-
✔ Editable and customizable template
This template is professionally designed and perfect for both beginners and advanced Excel users.
🛠 How to Use the Coaching & Tutoring KPI Dashboard in Excel
Using this dashboard is extremely easy:Coaching & Tutoring KPI Dashboard in Excel
-
Enter your actual data in the “Actual Numbers Input” sheet.
-
Enter monthly targets in the “Target Sheet.”
-
Add previous year numbers for comparison.
-
Go to the Dashboard Sheet → Select month from dropdown → View instant insights.
-
Use the Trend Sheet to monitor KPI-level patterns.
-
Export charts, share reports, or present to management anytime.
No complex formulas. No coding. No additional software.
🎯 Who Can Benefit from This Coaching & Tutoring KPI Dashboard in Excel
This dashboard is perfect for:
🏫 Coaching Institute Owners
Track financial KPIs, academic results, and operational efficiency in one place.
📘 Academic Heads & Coordinators
Monitor batch performance, tutor ratings, student attendance, and satisfaction trends.
👨🏫 Tutors & Faculty Members
Review teaching performance, student outcomes, and areas needing improvement.
🧾 Admin & Operations Teams
Improve reporting accuracy, admissions tracking, lead conversion, and attendance monitoring.
📊 Education Consultants
Help coaching centers optimize processes and data-driven decision-making.
This dashboard makes performance management easier, faster, and more intelligent.
### Click here to read the Detailed blog post
Watch the step-by-step video tutorial:


Reviews
There are no reviews yet.