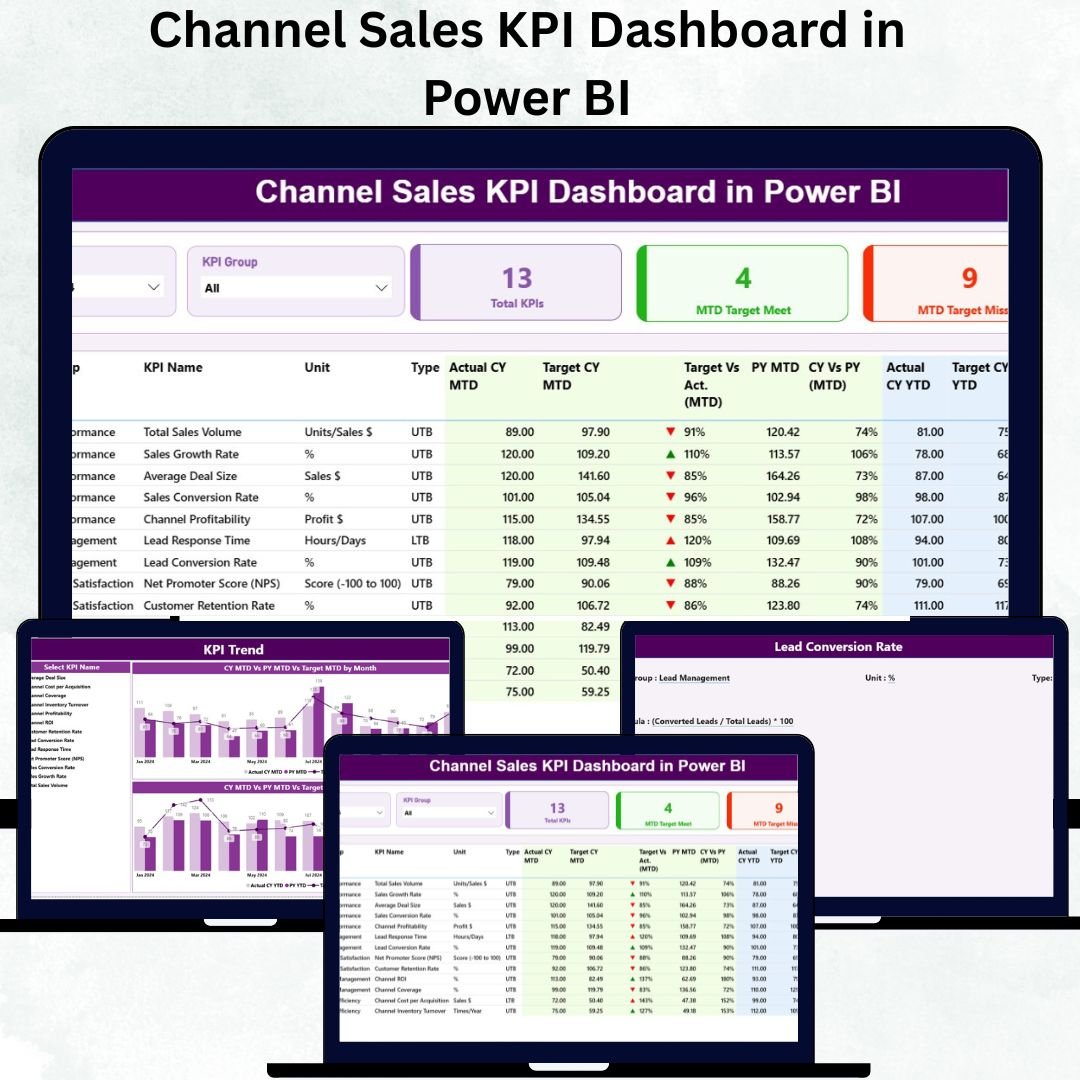
Managing channel sales efficiently is crucial for businesses that rely on distributors, resellers, or partners to drive growth. The Channel Sales KPI Dashboard in Power BI is a modern, interactive analytics tool designed to monitor sales performance, track KPIs, and empower data-driven decisions — all in real time. 🚀📊
This ready-to-use Power BI dashboard provides a complete performance overview across regions, channel partners, and product categories. It consolidates Month-to-Date (MTD) and Year-to-Date (YTD) metrics, enabling managers to assess progress, identify underperforming areas, and take immediate corrective action.
💎 Key Features of the Channel Sales KPI Dashboard in Power BI
📊 Three Analytical Pages:
The dashboard includes a Summary Page, KPI Trend Page, and KPI Definition Page — each designed for clarity, insight, and fast decision-making.
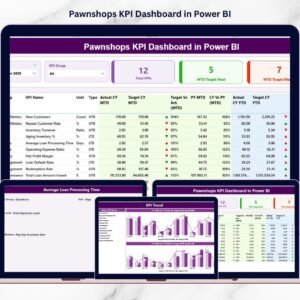
📋 Summary Page:
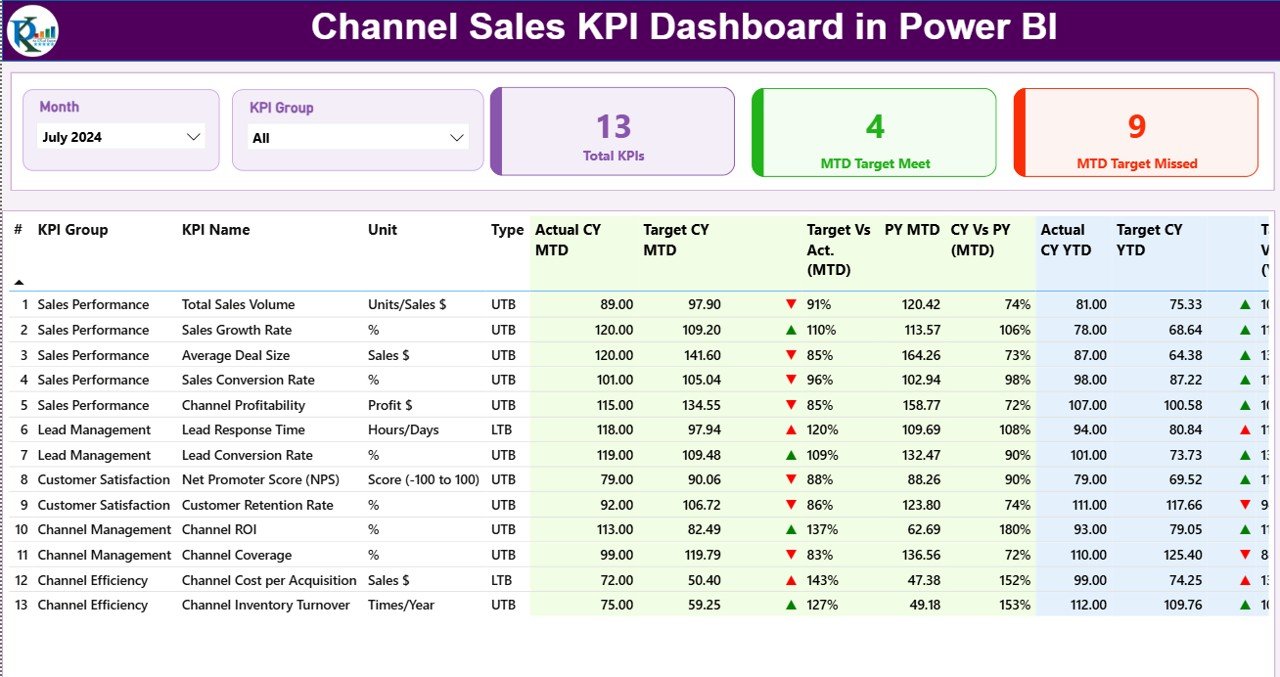
The main control hub of the dashboard. It features slicers for Month and KPI Group, and three main KPI cards showing:
-
Total KPIs Count
-
MTD Target Met Count
-
MTD Target Missed Count
With its structured visuals and interactive filters, users can easily identify performance gaps, benchmark progress, and evaluate success at a glance.
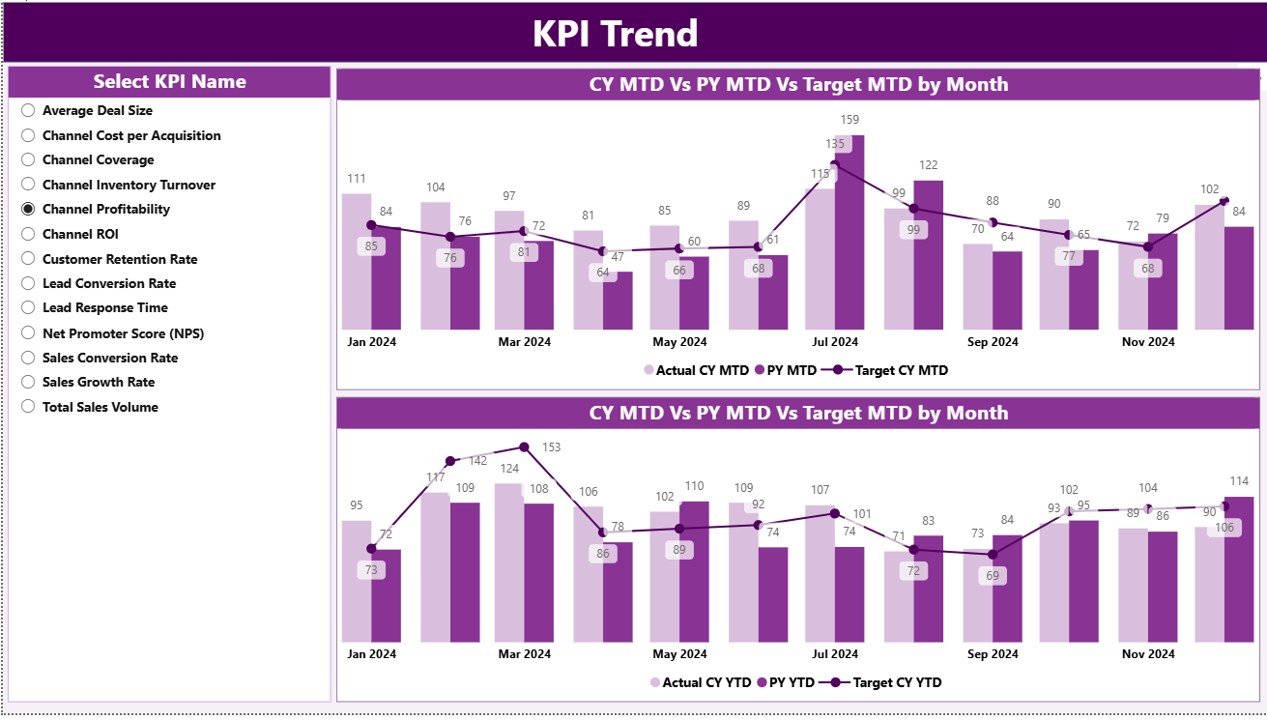
📈 KPI Trend Page:
Analyze performance trends over time using combo charts that display Current Year, Previous Year, and Target comparisons for both MTD and YTD.
A slicer lets you select any KPI and explore its historical trend — helping you detect growth patterns, seasonal fluctuations, and strategic improvements.
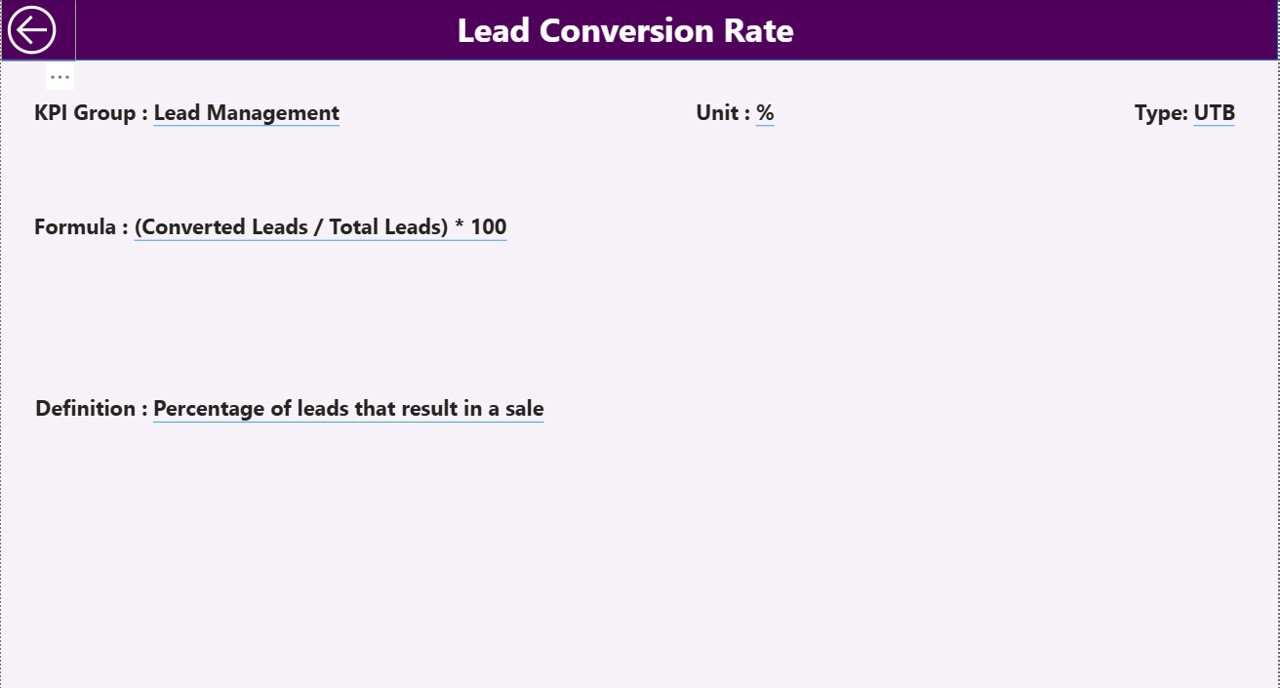
🧾 KPI Definition Page:
Drill deeper into each KPI’s details — including formula, definition, calculation logic, and type (LTB or UTB).
A built-in Back Button ensures smooth navigation between insights and overview pages.
📦 What’s Inside the Dashboard
When you download this Power BI template, you’ll receive a fully connected, Excel-integrated reporting system consisting of:
✅ 3 Core Pages: Summary, KPI Trend, and KPI Definition.
✅ Linked Excel Data Source: Three structured sheets — Input_Actual, Input_Target, and KPI Definition.
✅ Dynamic Calculations: Compare MTD vs. YTD performance across all KPIs.
✅ Interactive Slicers: Filter data by month, KPI group, or name instantly.
✅ Drill-Through Insights: Dive deep into KPI details with one click.
✅ User-Friendly Interface: Clean visuals with zero coding required.
This structure ensures transparency, interactivity, and effortless performance monitoring.
⚙️ How to Use the Channel Sales KPI Dashboard in Power BI
🪄 Step 1: Open the Power BI file and connect it to your Excel data source.
🪄 Step 2: Enter performance numbers in the Input_Actual sheet and targets in Input_Target.
🪄 Step 3: Refresh the dashboard to update all metrics automatically.
🪄 Step 4: Use slicers to filter by month or KPI group.
🪄 Step 5: Review the Summary Page for overall performance, and explore detailed insights in KPI Trend and KPI Definition pages.
No coding or advanced Power BI knowledge needed — everything is prebuilt and automated! ⚡
👥 Who Can Benefit from This Dashboard
🏢 Sales Managers: Monitor KPI achievement rates and compare regional performance.
📦 Channel Partners: Gain clarity on targets, trends, and overall contributions.
💰 Finance Teams: Track profitability, cost trends, and sales targets in one place.
🧭 Business Analysts: Access dynamic, drill-down insights for strategic planning.
🌍 Executives: Get a high-level, visual summary of channel efficiency and growth.
From small distributors to global sales networks, this Power BI dashboard fits perfectly across all scales and industries.
🌟 Why Choose This Power BI Dashboard
✔️ All-in-One Performance Hub – View every KPI from one dashboard.
✔️ Real-Time Insights – Auto-updating visuals ensure decisions are data-driven.
✔️ Target vs. Actual Analysis – Track exactly where you stand each month.
✔️ Clear Trend Analysis – Monitor year-over-year improvements.
✔️ Customizable KPIs – Modify, add, or remove KPIs to suit your business.
✔️ User-Friendly Design – Ideal for managers, not just data analysts.
The Channel Sales KPI Dashboard in Power BI helps transform static reports into intelligent analytics — improving accountability, boosting performance, and supporting long-term growth. 📈💼
### Click here to read the Detailed blog post
Visit our YouTube channel to learn step-by-step video tutorials


Reviews
There are no reviews yet.