🏭 Transform Your Ceramic Manufacturing Data into Powerful Insights!
Managing ceramic manufacturing operations involves tracking production, quality, cost, energy usage, and plant performance every single day. When this data is scattered across multiple files, it becomes difficult to analyze and act quickly.
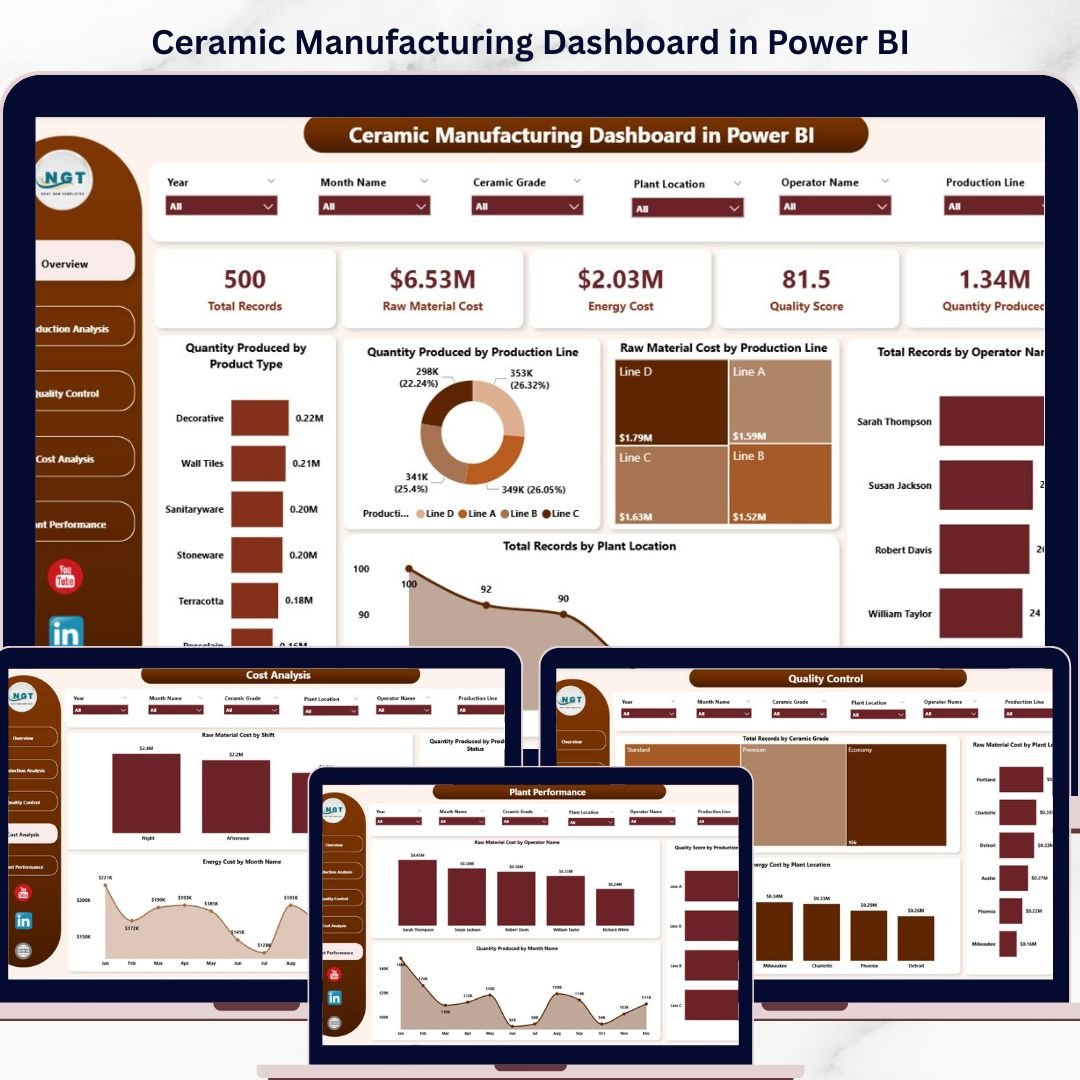
👉 The Ceramic Manufacturing Dashboard in Power BI is your all-in-one solution to monitor, analyze, and optimize your manufacturing operations with ease.
This ready-to-use dashboard converts complex production data into clear, interactive visuals that help you make faster and smarter decisions. Instead of manually reviewing reports, you can now track key performance indicators, identify inefficiencies, and improve productivity—all in one place.
With just a simple data update and refresh, your dashboard instantly provides real-time insights into production output, quality levels, costs, and trends.
🔑 Key Features of Ceramic Manufacturing Dashboard in Power BI
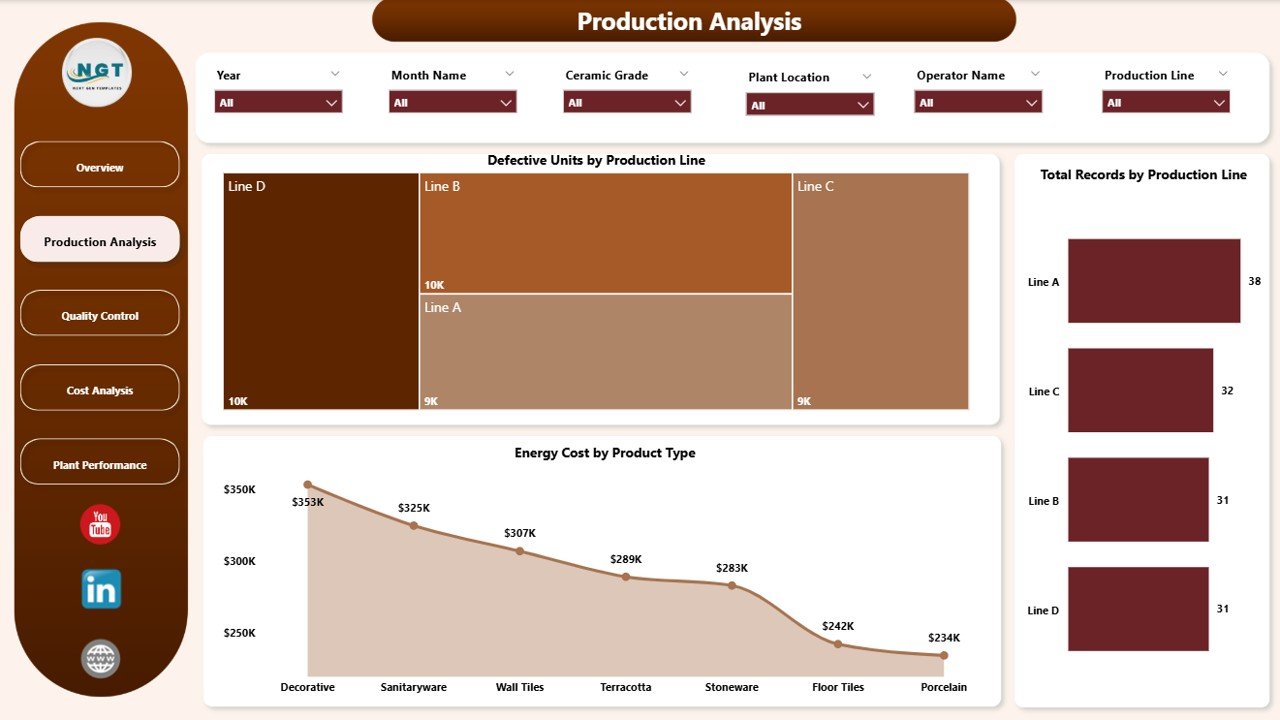
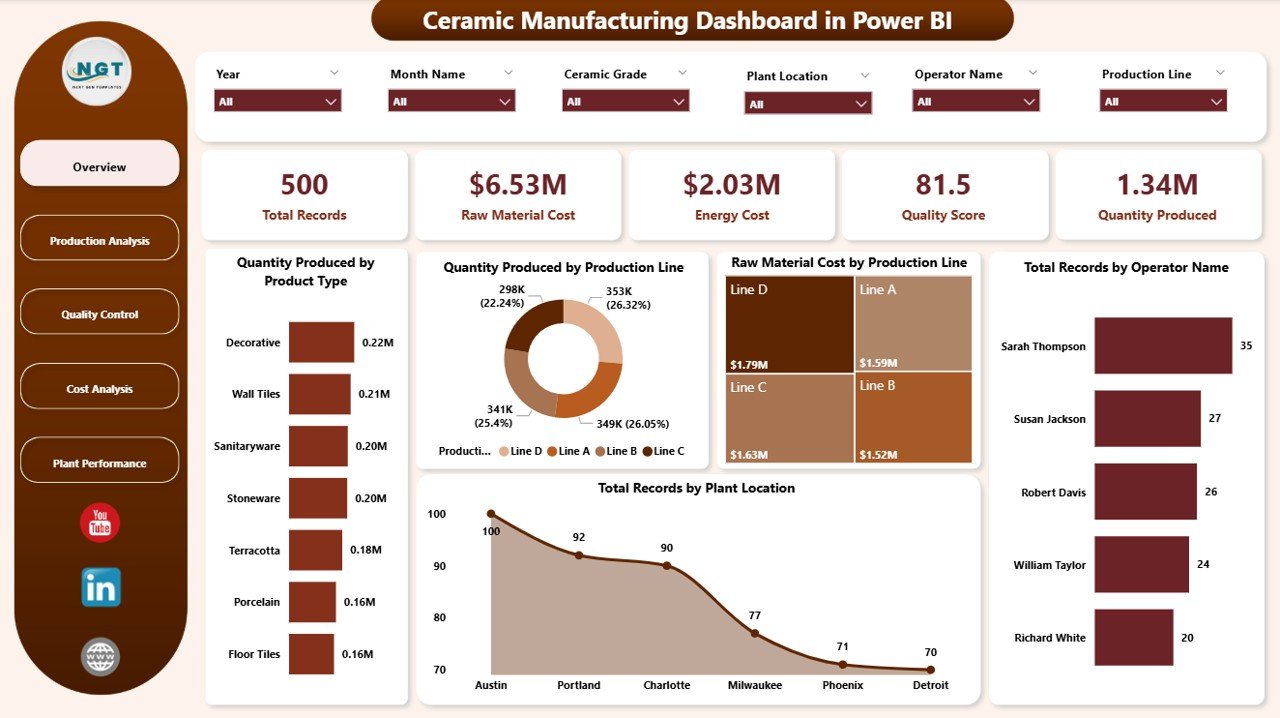
✨ Interactive Multi-Page Dashboard – Analyze data across Overview, Production Analysis, Quality Control, Cost Analysis, and Plant Performance.
📊 Powerful KPI Cards – Monitor Total Records, Quantity Produced, Quality Score, Raw Material Cost, and Energy Cost instantly.
🎯 Advanced Filters & Slicers – Drill down into data by plant, operator, product type, shift, and month.
📈 Dynamic Visualizations – Understand trends, defects, and cost distribution through intuitive charts.
⚡ Real-Time Data Refresh – Update your data and refresh instantly for accurate insights.
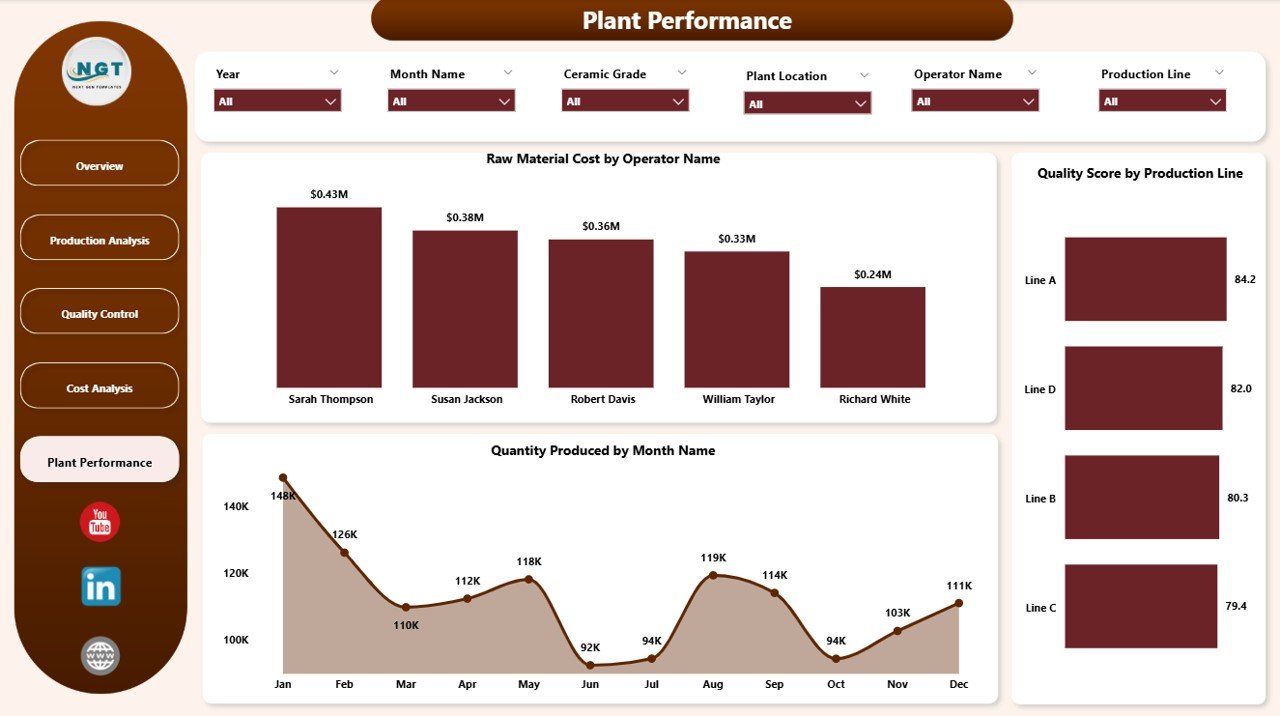
🏭 Plant-Level Performance Tracking – Compare multiple plants and identify performance gaps.
👨🏭 Operator Performance Insights – Analyze productivity and cost efficiency by operator.
📅 Monthly Trend Analysis – Track production and cost trends over time for better planning.
📦 What’s Inside the Ceramic Manufacturing Dashboard in Power BI
📁 5 Fully Interactive Dashboard Pages
- Overview Dashboard
- Production Analysis
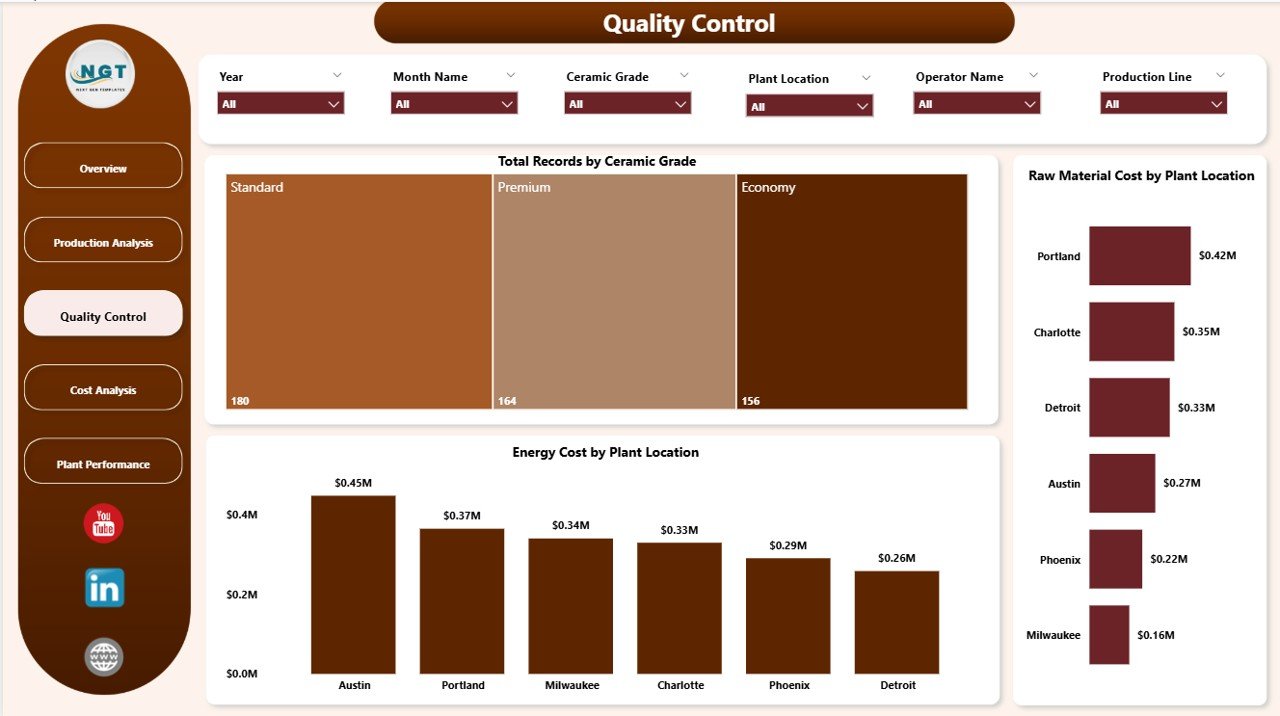
- Quality Control
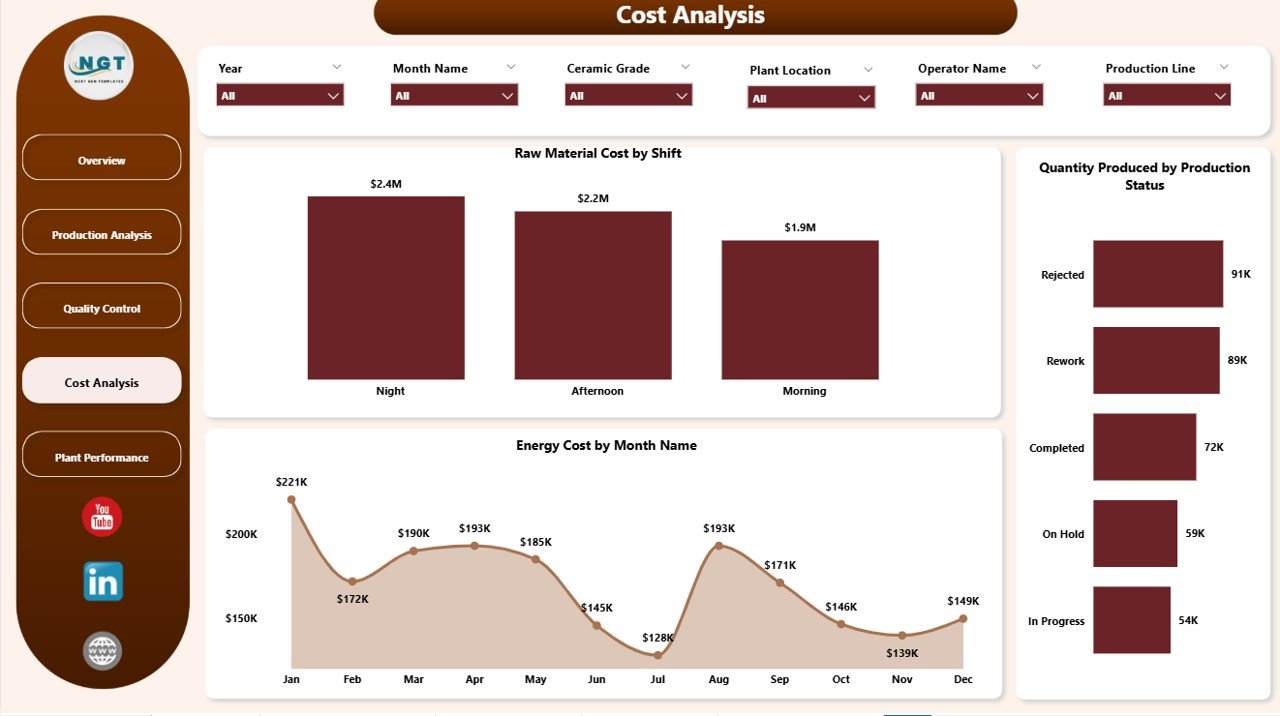
- Cost Analysis
- Plant Performance
📊 Pre-Built KPI Metrics & Charts
- Quantity Produced & Total Records
- Raw Material & Energy Cost Analysis
- Defective Units & Quality Score
- Production by Shift, Product Type, and Plant
- Monthly Cost & Output Trends
🎛️ Interactive Filters & Slicers
- Filter by Plant Location
- Filter by Operator Name
- Filter by Product Type
- Filter by Production Line & Month
📂 Ready-to-Use Power BI File
- Fully designed and formatted
- Plug-and-play structure
- Easy customization
⚙️ How to Use the Ceramic Manufacturing Dashboard in Power BI
1️⃣ Open the Power BI file after download
2️⃣ Connect or update your manufacturing dataset
3️⃣ Click Refresh to update all visuals
4️⃣ Use slicers to filter data dynamically
5️⃣ Analyze KPIs and charts to make better production decisions
💡 No advanced Power BI skills required—this dashboard is designed for simplicity and efficiency.
👥 Who Can Benefit from This Ceramic Manufacturing Dashboard in Power BI
🏭 Plant Managers – Monitor production, cost, and plant efficiency
👨🏭 Production Supervisors – Track output, defects, and shift performance
🔍 Quality Control Teams – Analyze quality scores and defective units
📊 Cost Analysts – Evaluate raw material and energy costs
💼 Business Owners – Get a complete view of manufacturing performance
This dashboard simplifies complex manufacturing data into clear, actionable insights. As a result, you can improve production efficiency, reduce operational costs, and maintain consistent product quality.
Instead of relying on slow manual reporting, you can now use real-time analytics to drive better decisions and achieve operational excellence.
📖 Click here to read the Detailed blog post
🎥 Visit our YouTube channel to learn step-by-step video tutorials
👉 https://youtube.com/@PKAnExcelExpert


