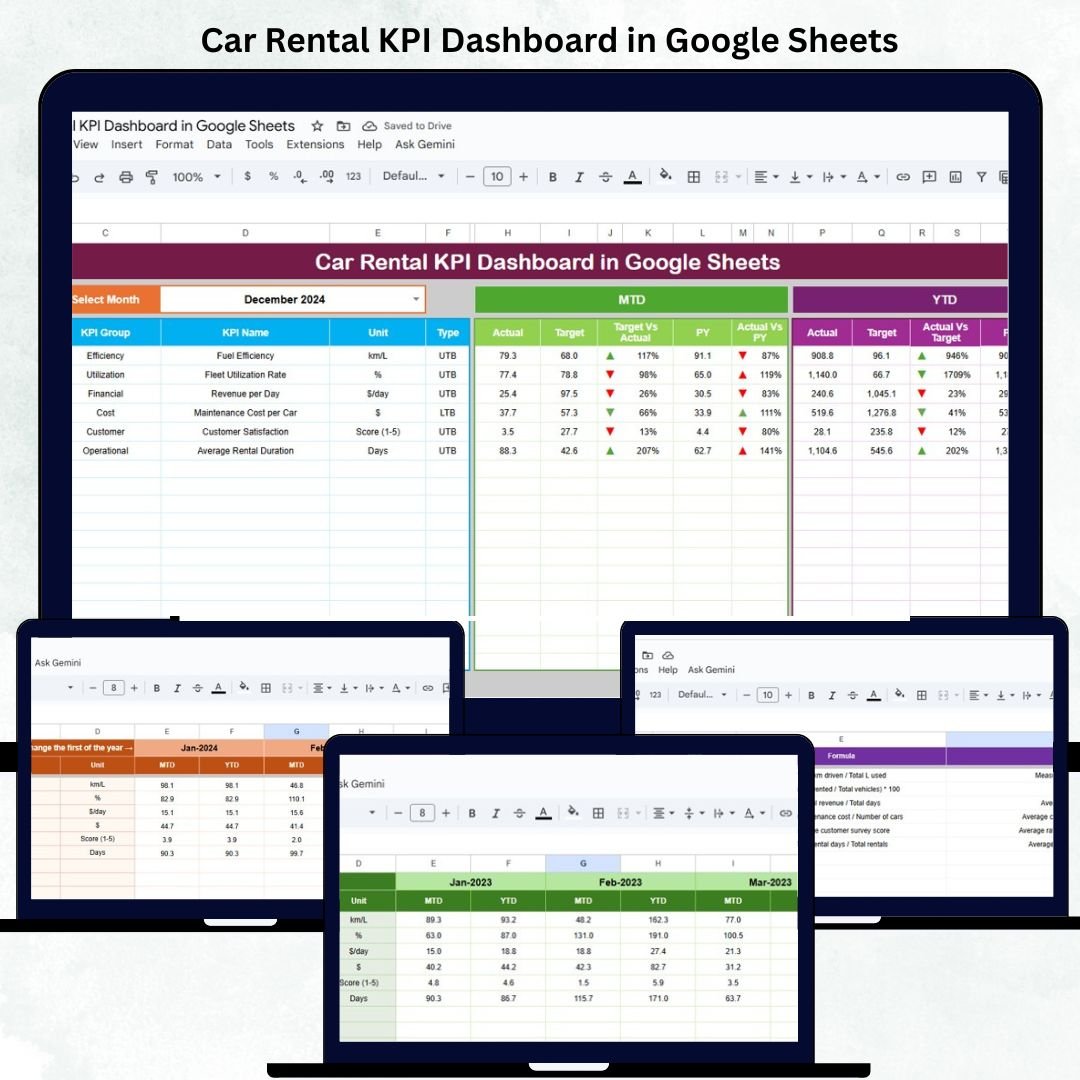
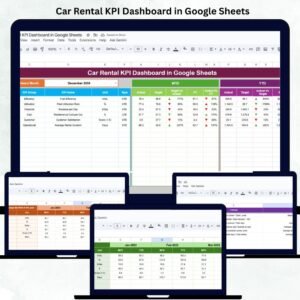
Running a successful car rental business demands accurate tracking of revenue, fleet utilization, maintenance costs, and customer satisfaction. The Car Rental KPI Dashboard in Google Sheets provides a ready-to-use, data-driven solution to simplify performance monitoring and enhance decision-making. 🚗📊
Built entirely in Google Sheets, this dashboard offers automated insights into Month-to-Date (MTD) and Year-to-Date (YTD) performance, compares actual results with targets and previous year data, and uses color-coded visuals to indicate performance trends. It’s perfect for rental companies, fleet managers, and franchise operators who need a real-time, cloud-based analytics tool — without investing in expensive software.
🔑 Key Features of the Car Rental KPI Dashboard in Google Sheets
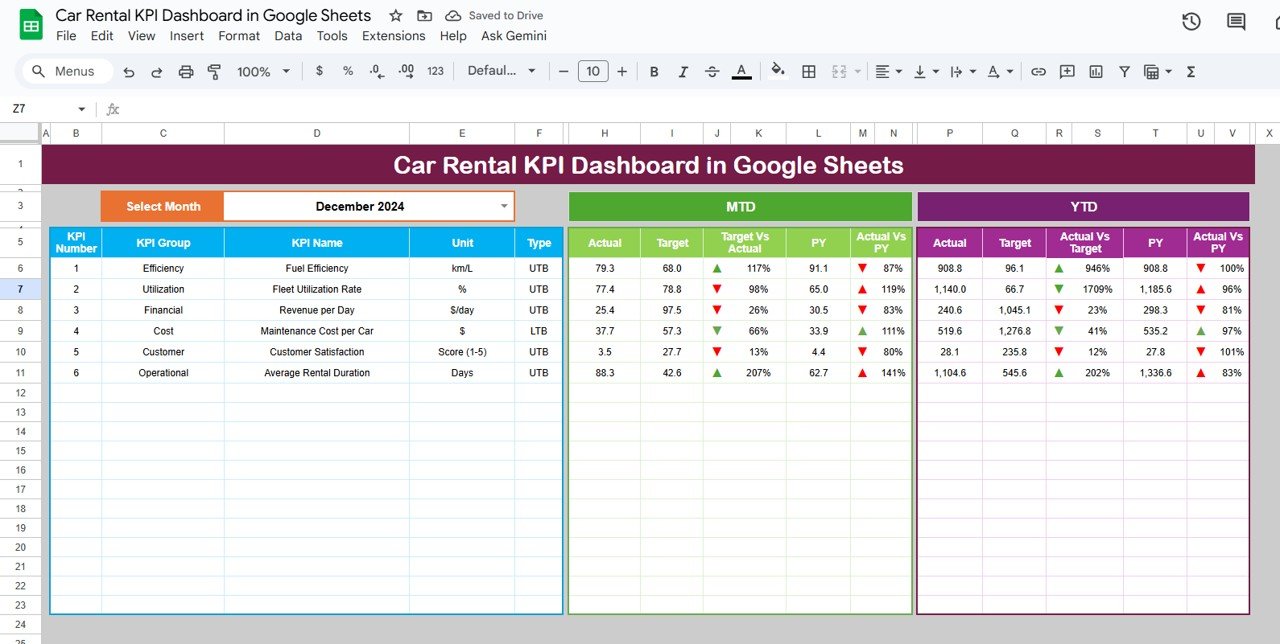
📋 Dashboard Sheet Tab (Main Dashboard)
The Dashboard Sheet is the heart of this tool, displaying key performance indicators through interactive visuals.
Features:
-
Dynamic month selection (cell D3) to filter performance data.
-
KPI cards showing MTD, YTD, Target, and Previous Year (PY) metrics.
-
Conditional formatting and trend arrows for visual interpretation.
-
Automatic updates when data changes.
KPIs Displayed:
-
🚗 Total Bookings: Total rentals completed for the selected month.
-
💰 Total Revenue (USD): Overall revenue generated from car rentals.
-
📈 Fleet Utilization (%): Percentage of vehicles rented versus total fleet.
-
🛠 Maintenance Cost (USD): Total spent on maintenance and repairs.
-
🌟 Avg. Customer Rating: Average satisfaction score from post-rental feedback.
Charts Included:
-
📊 Revenue vs. Target by Month – Compare monthly revenue with goals.
-
🚘 Fleet Utilization Trend – Track vehicle availability and usage rate.
-
💵 Maintenance Cost by Car Type – Identify which vehicle categories are costliest to maintain.
-
👥 Bookings by Customer Segment – Measure demand by customer type (Corporate, Individual, Partner).
-
🏙️ Revenue by Location – See which branches or regions generate the most income.
-
⭐ Avg. Customer Rating by Car Type – Analyze satisfaction differences across models.
All charts are automatically linked to data sheets, updating instantly when new data is added.
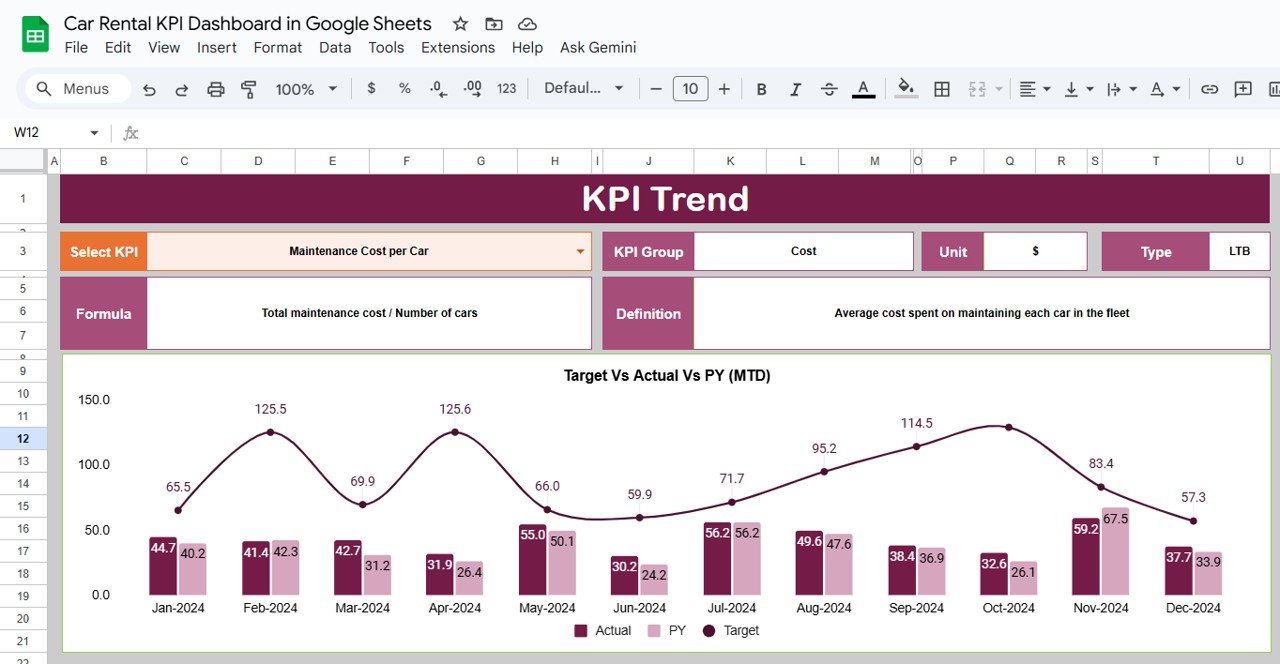
📊 KPI Trend Sheet Tab (Performance Analysis)
Analyze any KPI over time. Simply select a KPI from the dropdown (cell C3), and the dashboard will display its monthly trend with key metadata.
Displayed Fields:
-
KPI Group
-
Unit of Measurement
-
Type (UTB – Upper the Better / LTB – Lower the Better)
-
Formula
-
Definition
This section helps identify performance improvements, declines, or seasonal fluctuations.
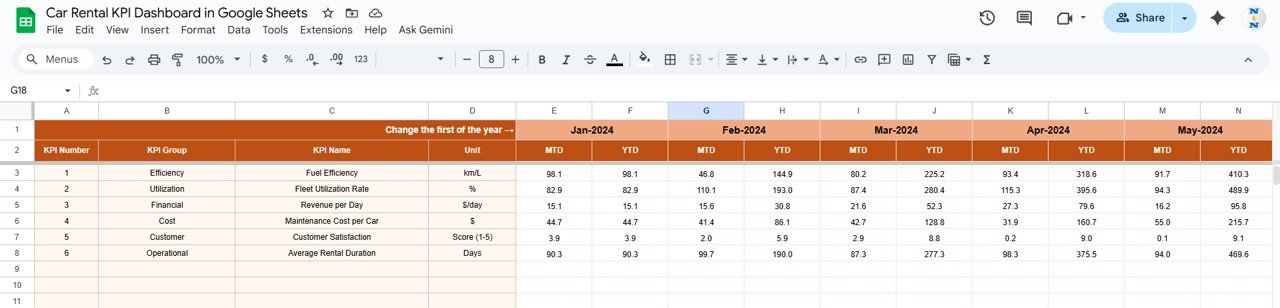
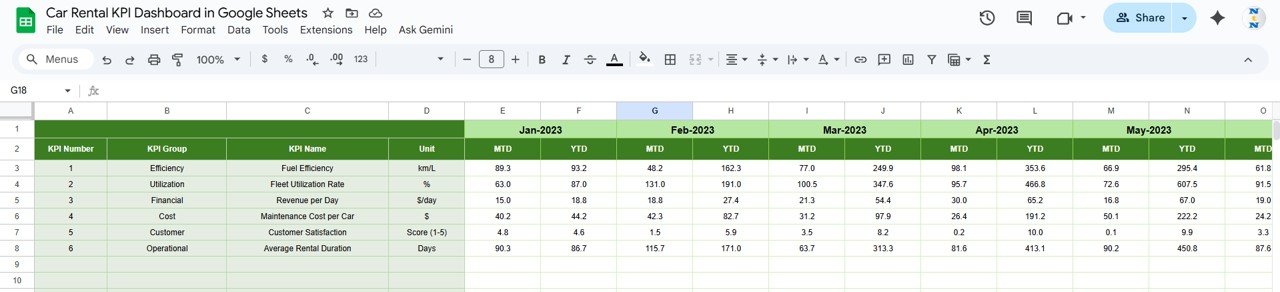
📘 Actual Number Sheet Tab
Input monthly performance data for each KPI here.
Columns include:
-
Month
-
MTD Actual
-
YTD Actual
The fiscal year start month (E1) can be modified to adjust all related calculations automatically.
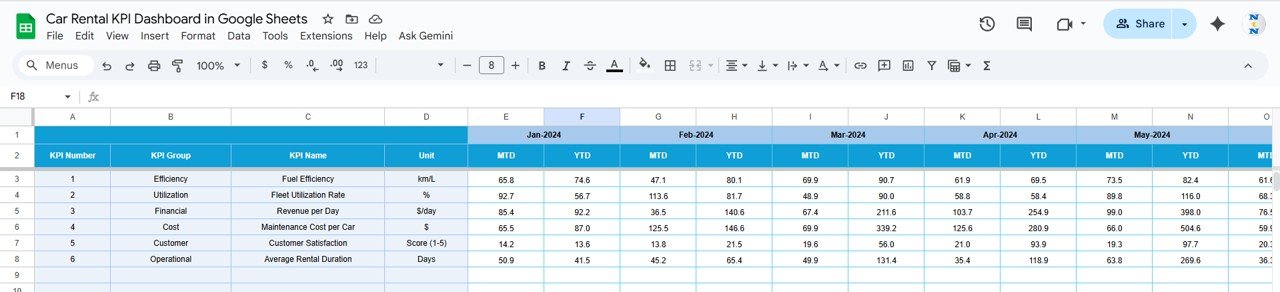
🎯 Target Sheet Tab
Set monthly and annual targets for each KPI.
The dashboard automatically compares targets with actuals to determine color-coded performance status (green for above target, red for below target).
📉 Previous Year Sheet Tab
Input last year’s data to benchmark year-over-year growth.
This allows visualization of how each KPI performs relative to the previous period.
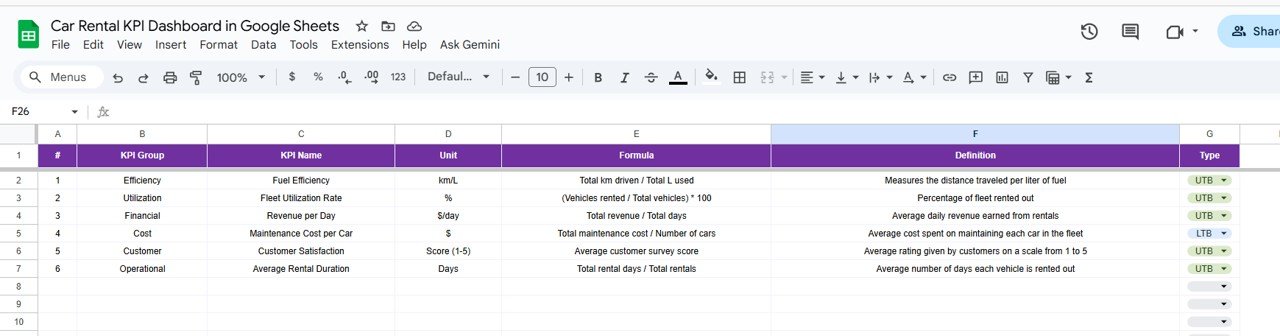
📋 KPI Definition Sheet Tab
Define all KPIs with their formula, purpose, and type (UTB/LTB).
This ensures transparency and consistency across teams and reporting.
📦 What’s Included
✅ Interactive dashboard (MTD/YTD performance view)
✅ Auto-updating charts and conditional formatting
✅ Six structured sheet tabs for clarity
✅ Cloud collaboration via Google Sheets
✅ KPI definitions for easy customization
✅ Historical and target-based comparison features
🧑💼 Who Can Use This Dashboard
🚘 Car Rental Companies & Franchises: Monitor revenue and fleet performance.
🧰 Fleet Managers: Track utilization, maintenance cost, and downtime.
📊 Operations & Finance Teams: Compare cost vs. profitability.
💼 Executives & Analysts: Review strategic performance trends.
Perfect for car rental agencies, transport service providers, and mobility startups looking to simplify analytics and enhance decision-making.
⚙️ Opportunities for Improvement
Enhance the dashboard further by:
-
🔄 Integrating Google Forms for booking data capture.
-
🧾 Adding Profit Margin KPIs (Revenue – Expenses).
-
🔔 Automating Alerts for low fleet availability or delayed maintenance.
-
🛠 Tracking Maintenance Alerts with Google Apps Script.
-
⭐ Embedding Customer Feedback Analysis using sentiment scoring.
🧠 Best Practices
✅ Update actual and target data monthly.
✅ Use consistent KPI names across all sheets.
✅ Protect dashboard and formula cells to prevent edits.
✅ Review maintenance and revenue trends regularly.
✅ Refresh “Previous Year” data annually for accurate YoY comparison.
🌟 Why Choose the Car Rental KPI Dashboard
-
🚗 All-in-one fleet, revenue, and maintenance tracking
-
📈 Real-time data visualization
-
☁️ 100% Google Sheets-based — no installation required
-
🔄 Fully automated MTD/YTD calculations
-
🎯 KPI-based management and goal tracking
-
🧠 Intuitive interface for decision-making
With this Car Rental KPI Dashboard in Google Sheets, car rental businesses can easily measure success, reduce inefficiencies, and boost profitability — all through an interactive, shareable, and customizable platform.


Reviews
There are no reviews yet.