
🏕️ Run Your Camping Resort Smarter with Real-Time Insights!
Managing bookings, revenue, guest satisfaction, and seasonal trends across your camping resort can quickly become overwhelming. But what if you could track everything in one powerful, interactive dashboard?
👉 The Camping Resorts Dashboard in Power BI is your ultimate solution to monitor, analyze, and optimize your resort performance—all in one place.
This ready-to-use dashboard is designed specifically for camping resort owners, managers, and analysts who want clear visibility into their operations. Instead of dealing with scattered reports and manual calculations, you can now access real-time insights with just a single click.
Simply update your data, hit refresh, and instantly unlock a complete view of your business performance. From revenue and profit tracking to guest behavior and seasonal trends—everything is visualized beautifully and ready to act on.
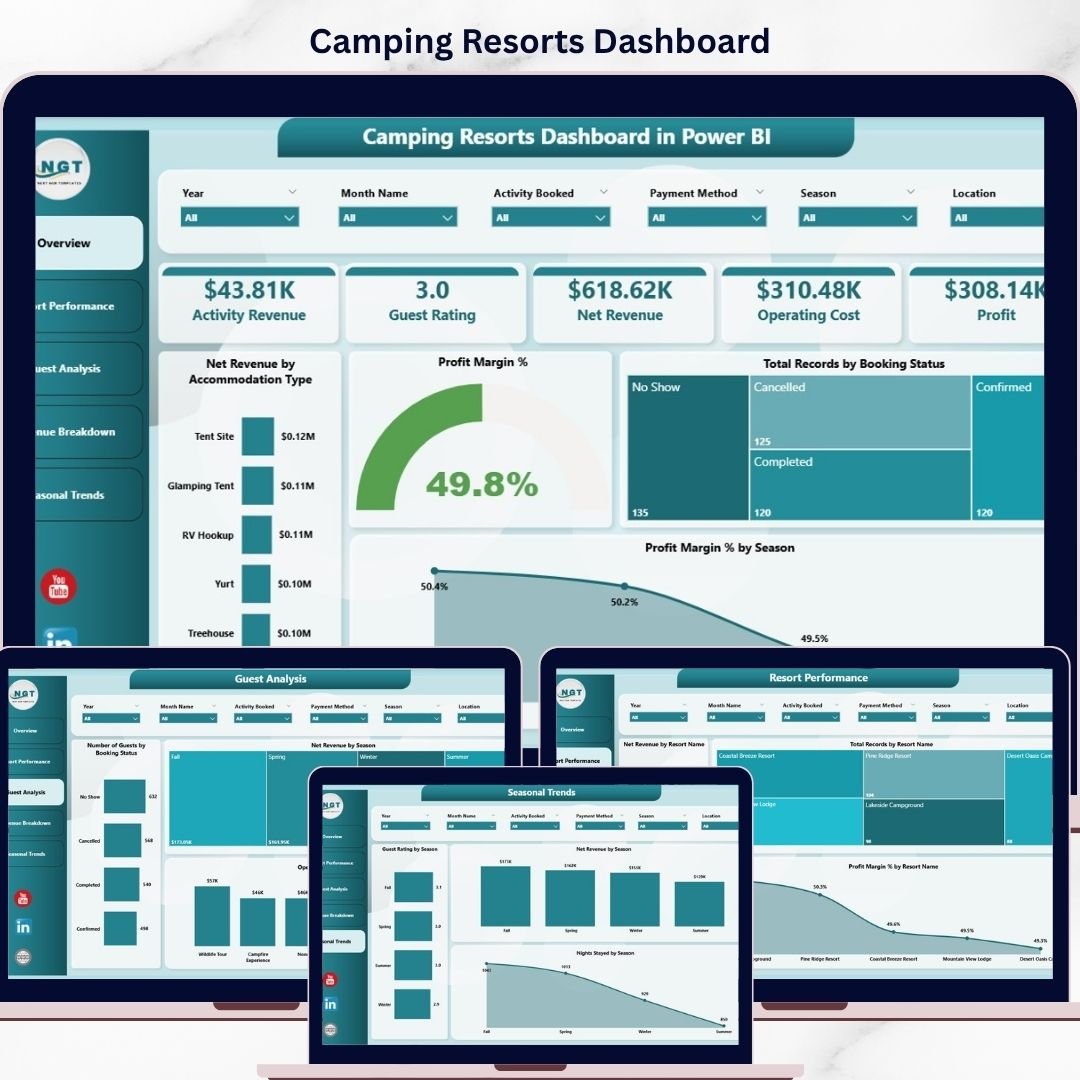
🔑 Key Features of Camping Resorts Dashboard in Power BI
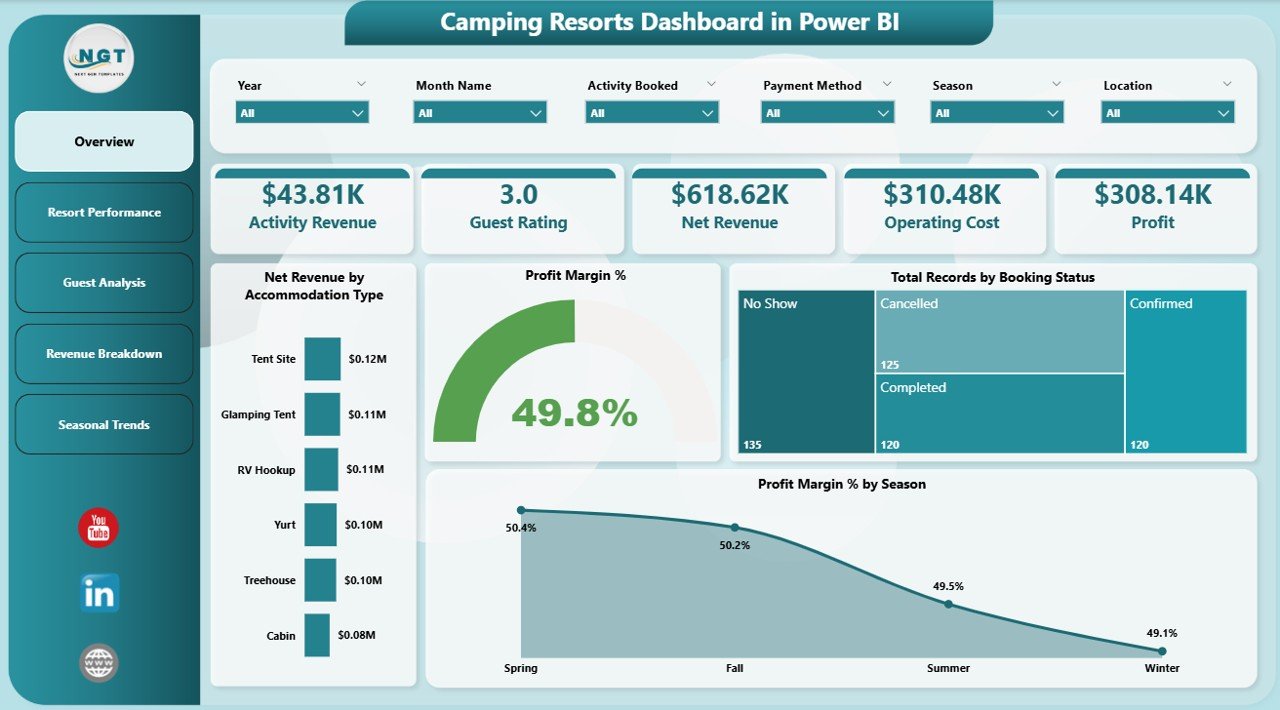
✨ Interactive Multi-Page Dashboard – Analyze data across Overview, Resort Performance, Guest Analysis, Revenue Breakdown, and Seasonal Trends.
📊 Powerful KPI Cards – Track Revenue, Profit, Net Revenue, Operating Cost, Guest Rating, and Activities instantly.
🎯 Advanced Filters & Slicers – Quickly filter data by season, booking status, resort, and more.
📈 Dynamic Visualizations – Identify trends, patterns, and performance insights through intuitive charts.
⚡ Real-Time Data Refresh – Update your data and refresh the dashboard instantly.
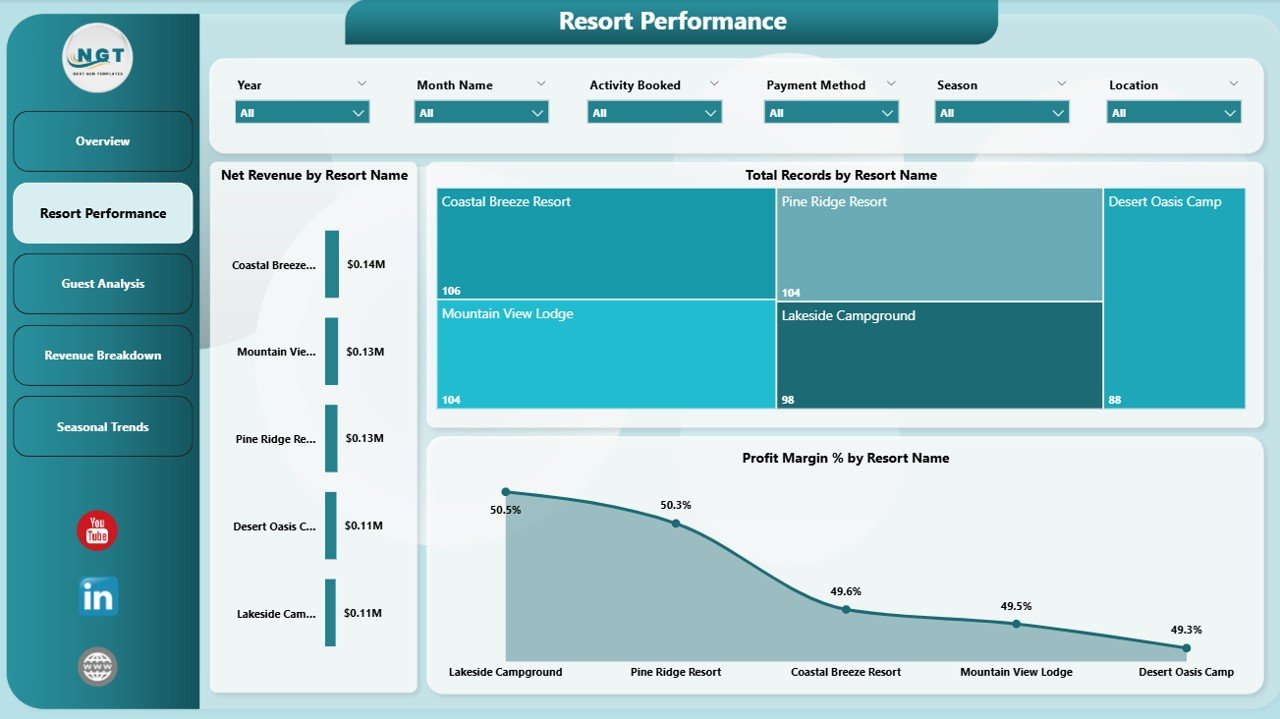
🏕️ Resort-Level Insights – Compare performance across multiple resorts easily.
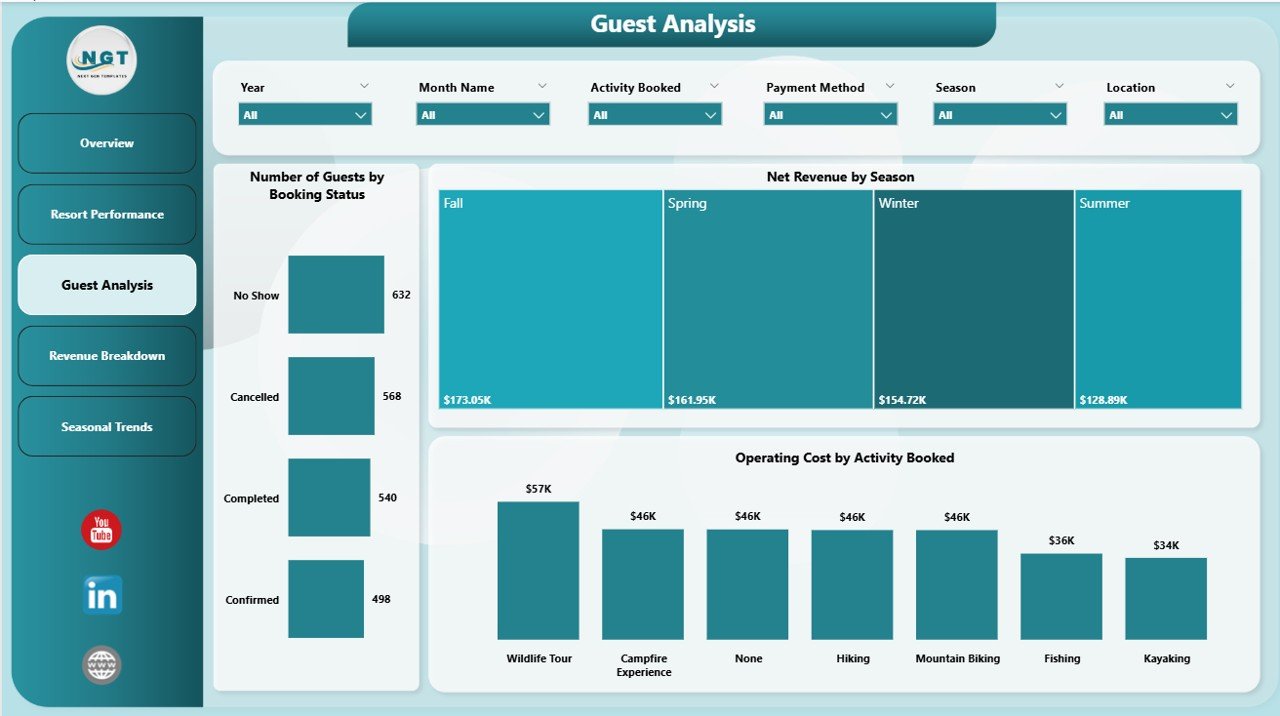
👥 Guest Behavior Analysis – Understand booking patterns, stay duration, and satisfaction levels.
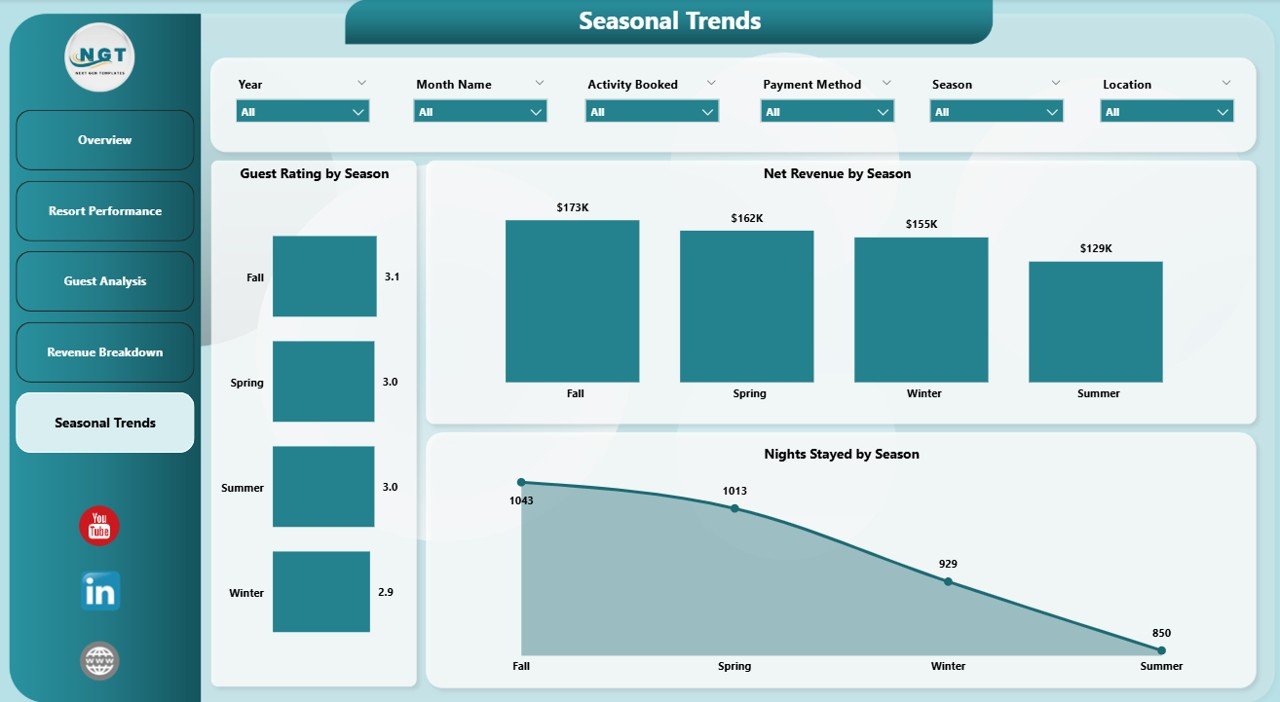
📅 Seasonal Trend Tracking – Optimize planning by analyzing seasonal performance variations.
📦 What’s Inside the Camping Resorts Dashboard in Power BI
📁 5 Fully Interactive Dashboard Pages
- Overview Dashboard
- Resort Performance Analysis
- Guest Analysis
- Revenue Breakdown
- Seasonal Trends
📊 Pre-Built KPIs & Charts
- Revenue, Profit & Cost Metrics
- Profit Margin % Analysis
- Booking Status Distribution
- Revenue by Accommodation Type
- Seasonal Performance Trends
🎛️ Interactive Slicers & Filters
- Filter by Season
- Filter by Resort Name
- Filter by Booking Status
- Filter by Payment Method
📂 Ready-to-Use Power BI File
- Fully designed dashboard
- Plug-and-play structure
- Easy customization
⚙️ How to Use the Camping Resorts Dashboard in Power BI
1️⃣ Download and open the Power BI file
2️⃣ Connect or update your dataset
3️⃣ Click Refresh to update all visuals
4️⃣ Use slicers to explore different data segments
5️⃣ Analyze KPIs and charts to make data-driven decisions
💡 No advanced Power BI skills required—this dashboard is designed for simplicity and efficiency.
👥 Who Can Benefit from This Camping Resorts Dashboard in Power BI
🏕️ Resort Owners – Track revenue, profit, and overall performance
👨💼 Resort Managers – Optimize operations and improve decision-making
📊 Business Analysts – Analyze trends and uncover insights
👥 Hospitality Teams – Understand guest behavior and satisfaction
📈 Investors & Stakeholders – Monitor performance and growth opportunities
This dashboard simplifies complex resort data into clear, actionable insights. As a result, you can improve profitability, enhance guest experience, and make smarter business decisions.
Instead of relying on manual reports, you now have a powerful analytics tool that keeps your entire resort operation under control—efficiently and professionally.


