Managing a Call Center Operations Dashboard is all about speed, accuracy, cost control, and customer satisfaction. Every day, call center teams handle large volumes of customer interactions across multiple channels. However, when call logs and performance data remain scattered across systems or spreadsheets, managers struggle to understand what is really happening on the ground.
That is exactly why the Call Center Operations Dashboard in Power BI becomes a powerful operational solution 🚀. This ready-to-use Power BI dashboard transforms raw call center data into clear KPIs, interactive visuals, and actionable insights. Instead of manually compiling reports, managers instantly see agent performance, service quality, costs, and resolution efficiency from one centralized dashboard.
Designed for modern call centers and customer support operations, this dashboard helps organizations improve efficiency, reduce operational costs, and enhance customer experience with data-driven clarity.
🔑 Key Features of Call Center Operations Dashboard in Power BI
📊 5 Interactive Analytical Pages for complete call center visibility
🎯 Advanced Slicers & Filters for dynamic analysis
📈 Real-Time KPI Cards & Visuals for instant insights
😊 Customer Satisfaction (CSAT) Tracking
💰 Call Handling Cost Analysis by channel, team, and region
⏱️ Call Duration, Wait Time & Resolution Time Monitoring
🔍 Drill-Down Capability for deeper investigation
🔄 Automated Data Refresh from connected data sources
This dashboard delivers clarity, speed, and control for call center leaders.
📂 What’s Inside the Call Center Operations Dashboard
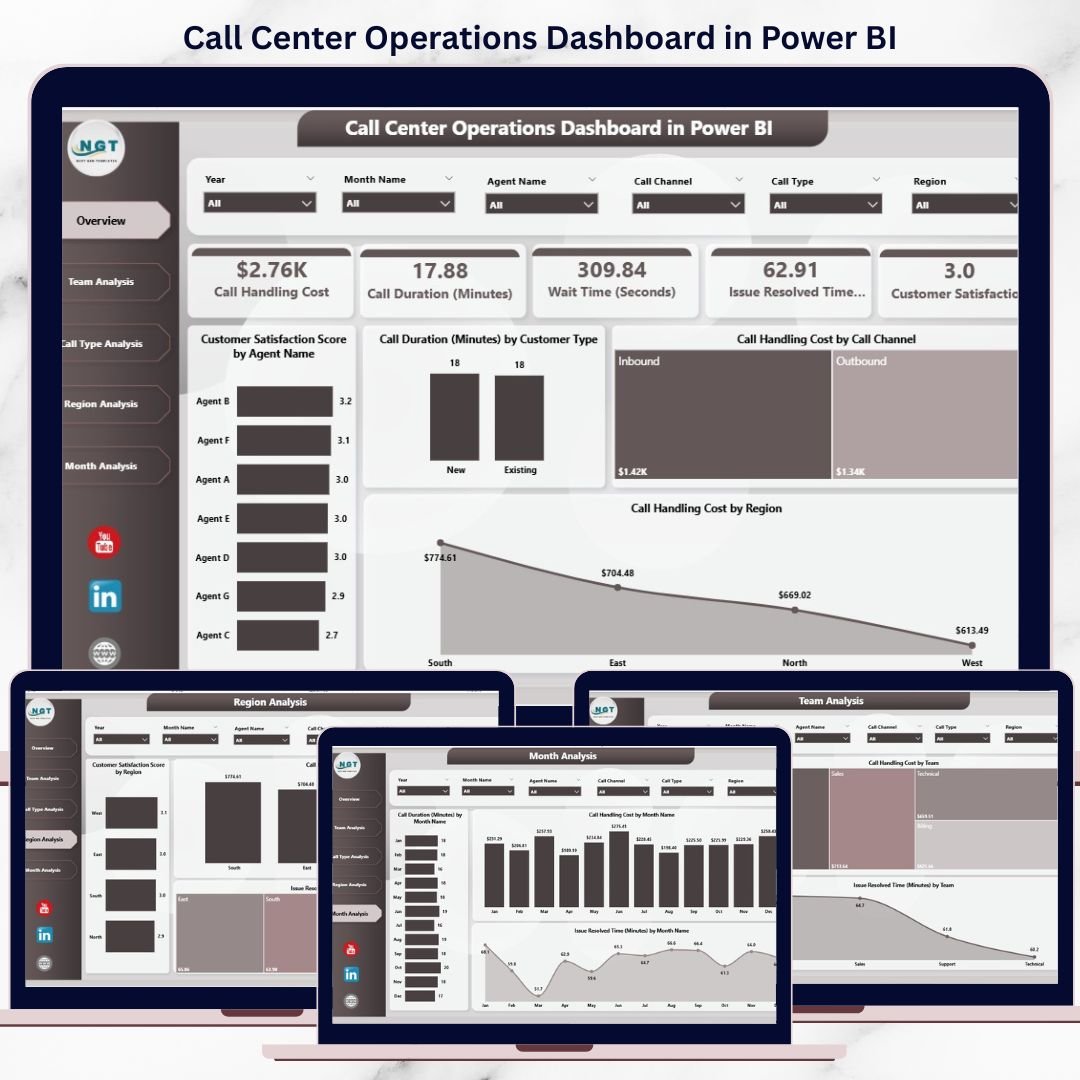
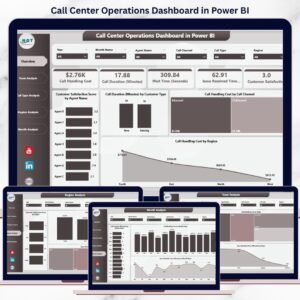
📊 Overview Page
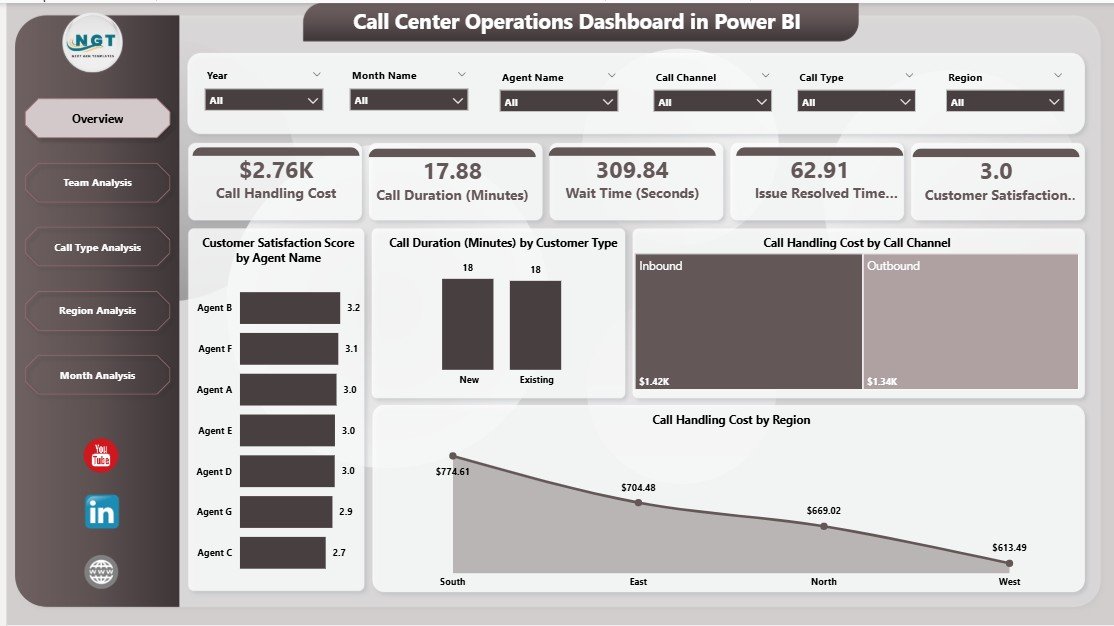
The main control panel of the dashboard. It provides a high-level snapshot of overall performance, including:
-
Customer Satisfaction Score by Agent Name
-
Call Duration by Customer Type
-
Call Handling Cost by Call Channel
-
Call Handling Cost by Region
This page helps leadership identify risks and opportunities within seconds.
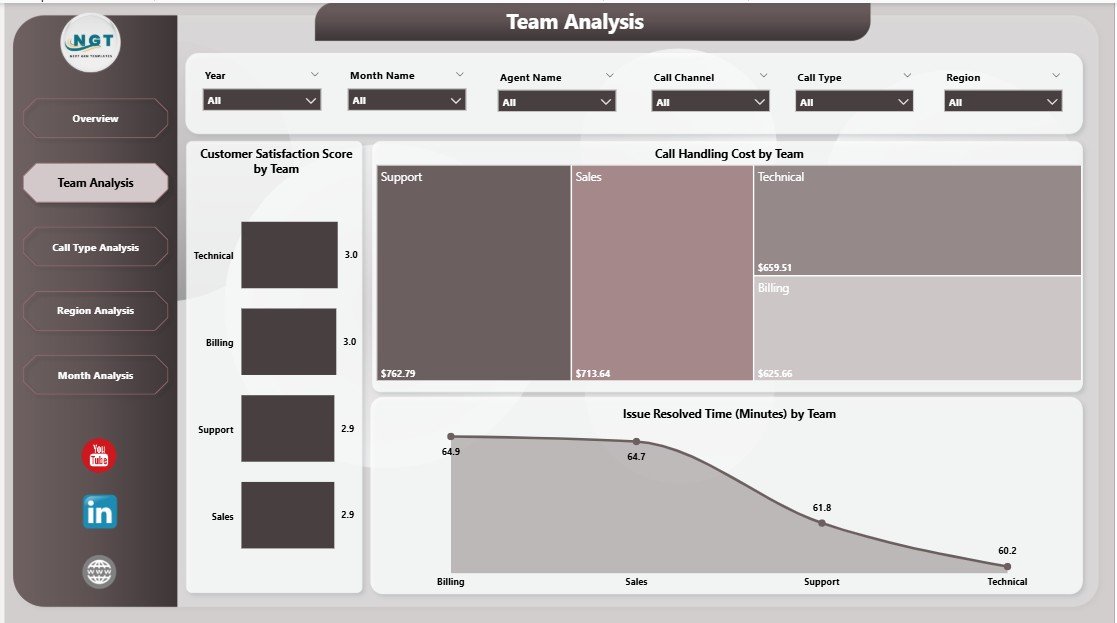
👥 Team Analysis Page
Focuses on team-level performance comparison:
-
Customer Satisfaction Score by Team
-
Call Handling Cost by Team
-
Issue Resolved Time by Team
Supervisors use this page to balance workloads and improve service quality.
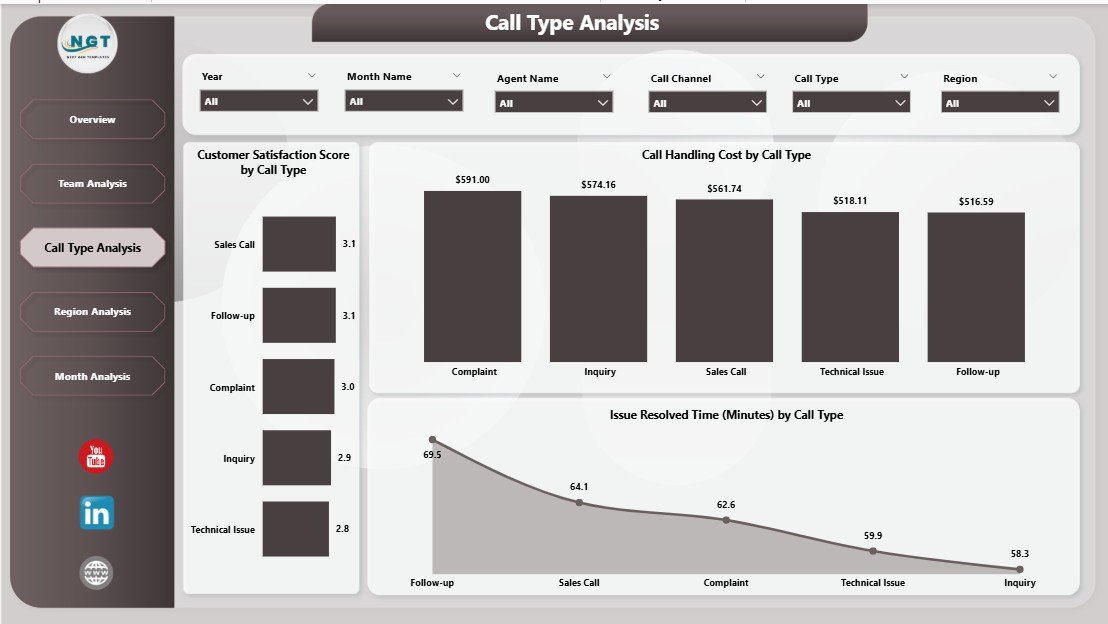
📞 Call Type Analysis Page
Analyzes performance by call category:
-
Customer Satisfaction Score by Call Type
-
Call Handling Cost by Call Type
-
Issue Resolved Time by Call Type
This analysis helps optimize scripts and processes for complex call types.
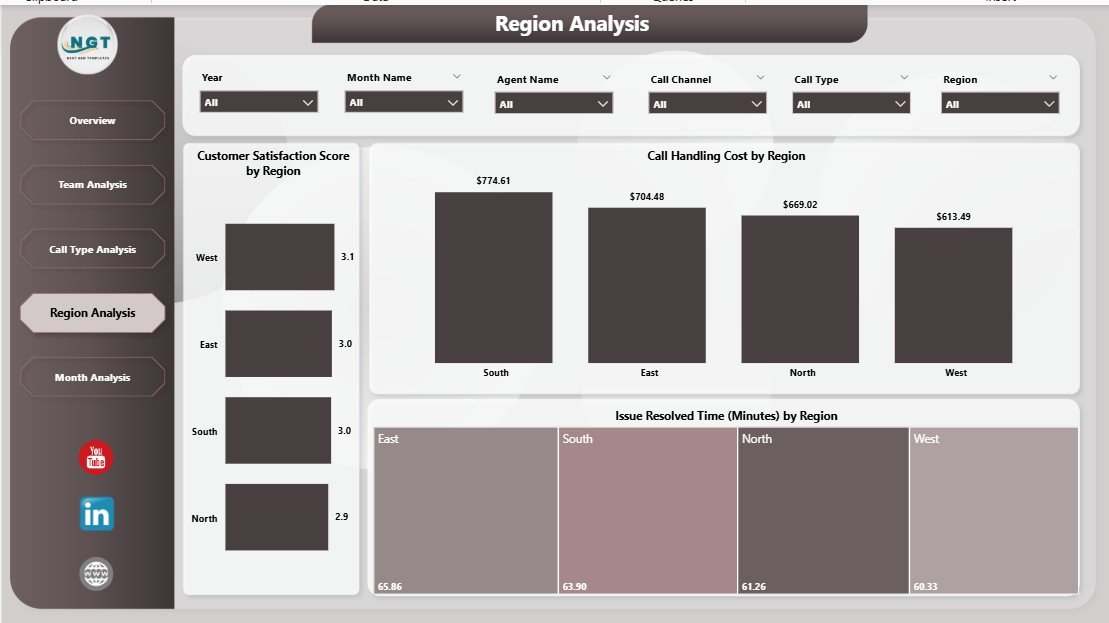
🌍 Region Analysis Page
Provides geographical performance insights:
-
Customer Satisfaction Score by Region
-
Issue Resolved Time by Region
-
Wait Time by Region
Managers can make region-specific staffing and training decisions.
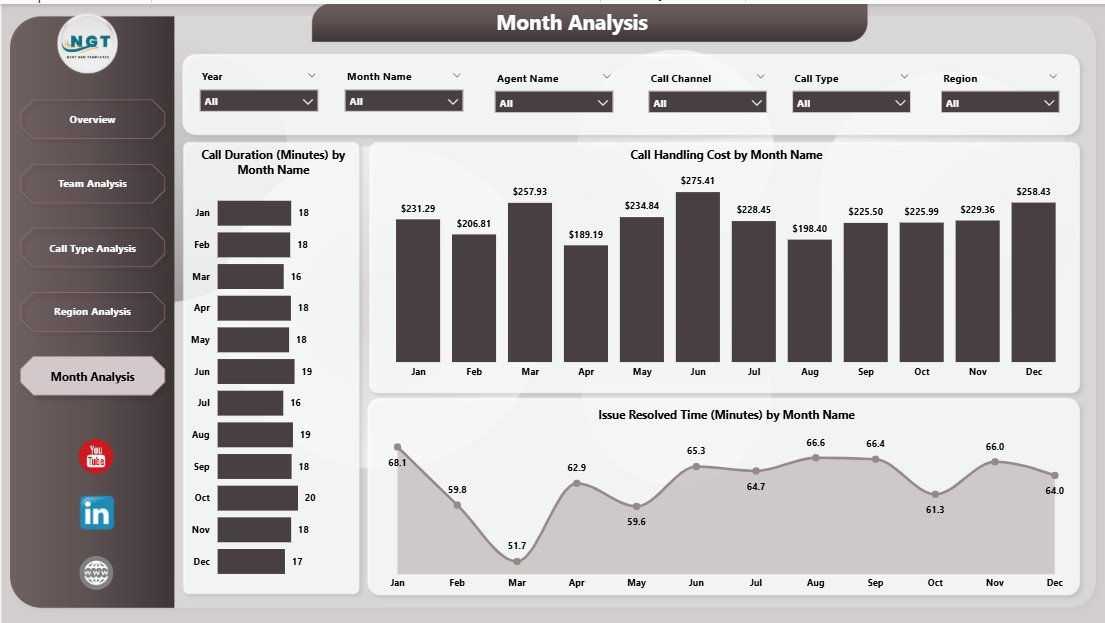
📆 Month Analysis Page
Tracks trends and seasonality over time:
-
Issue Resolved Time by Month
-
Call Handling Cost by Month
-
Call Duration by Month
This page supports forecasting, budgeting, and workforce planning.
🛠️ How to Use the Call Center Operations Dashboard
✅ Connect call data from CRM, telephony, or Excel
✅ Refresh the Power BI dataset
✅ Use slicers to filter by agent, team, region, or time
✅ Review KPIs and trends instantly
✅ Drill down to investigate performance issues
No advanced Power BI skills are required. The dashboard is clean, intuitive, and business-ready.
👥 Who Can Benefit from This Call Center Operations Dashboard?
📞 Call Center Managers
👥 Team Leaders & Supervisors
📊 Operations Managers
💰 Finance & Cost Control Teams
😊 Customer Experience Teams
🏢 Senior Leadership
Whether managing small support teams or enterprise-level call centers, this dashboard scales effortlessly.
👉 Click here to read the Detailed blog post
▶️ Visit our YouTube channel to learn step-by-step video tutorials
https://youtube.com/@PKAnExcelExpert


Reviews
There are no reviews yet.