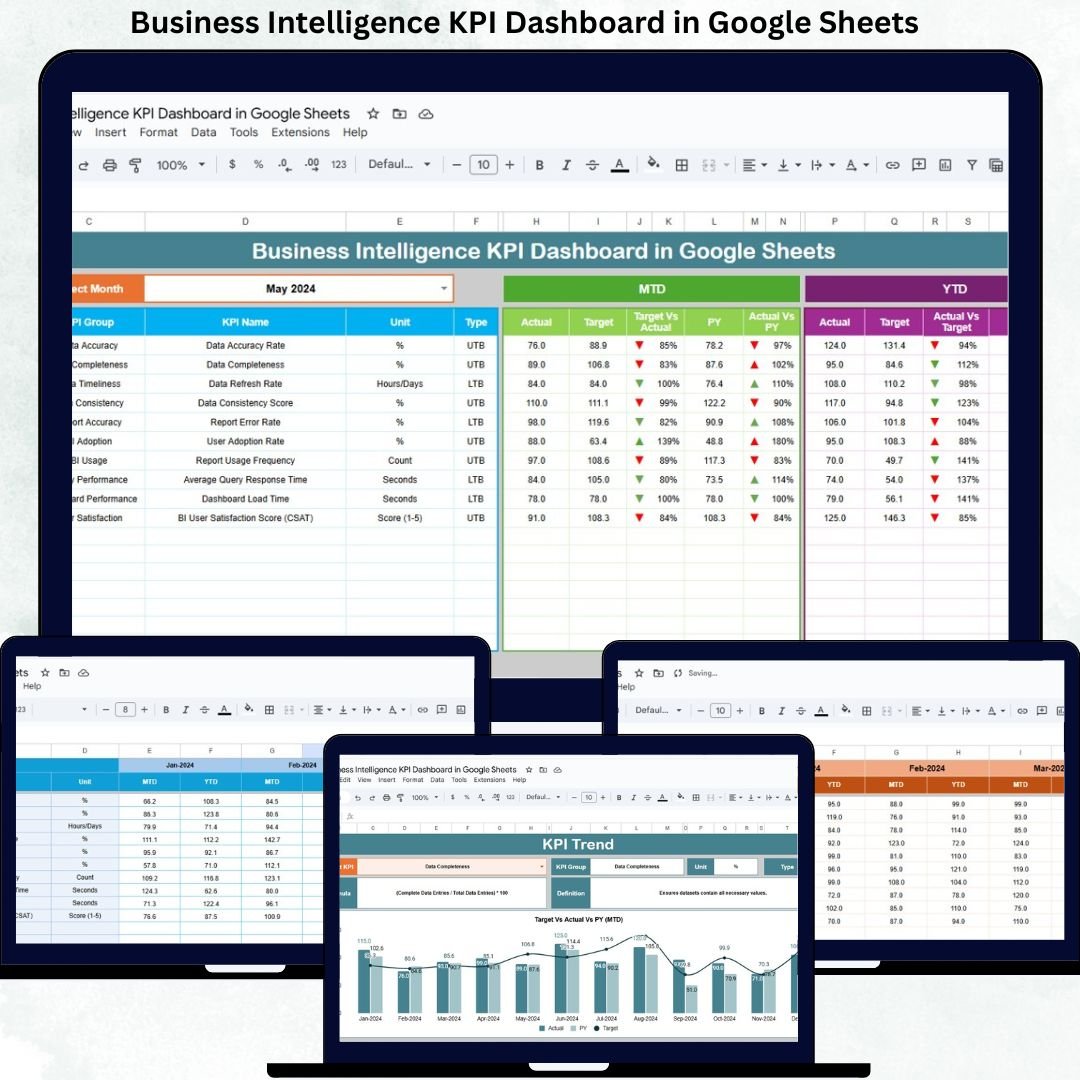
Every organization generates large volumes of data every day. However, data alone does not create value unless teams convert it into meaningful insights. Business leaders need clear visibility into performance, risks, and trends to make confident decisions. That is exactly where the Business Intelligence KPI Dashboard in Google Sheets becomes a powerful and practical solution.
This ready-to-use dashboard helps organizations track performance across finance, operations, sales, productivity, and efficiency using well-defined KPIs. Instead of managing multiple reports and disconnected spreadsheets, teams can monitor all critical metrics in one centralized and interactive Google Sheets dashboard. With built-in MTD (Month-to-Date), YTD (Year-to-Date), trend analysis, and visual indicators, this dashboard transforms raw data into decision-ready insights.
Because it runs entirely in Google Sheets, the dashboard remains flexible, collaborative, cost-effective, and easy to customize—without the complexity of enterprise BI tools.
✨ Key Features of the Business Intelligence KPI Dashboard in Google Sheets
📊 1. Centralized KPI Performance Tracking
Monitor all business KPIs in one structured dashboard instead of juggling multiple reports.
🎯 2. MTD & YTD Performance Visibility
Track Month-to-Date and Year-to-Date performance instantly with automatic calculations.
📈 3. Target vs Actual & YoY Comparison
Compare actual performance against targets and previous-year benchmarks to identify gaps quickly.
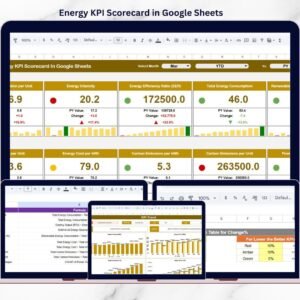
🚦 4. Visual Performance Indicators
Conditional formatting arrows highlight performance instantly:
-
Green arrow → improvement
-
Red arrow → decline
☁️ 5. Google Sheets-Based Collaboration
Access, share, and update KPIs in real time with your team from anywhere.
📦 What’s Inside the Business Intelligence KPI Dashboard in Google Sheets
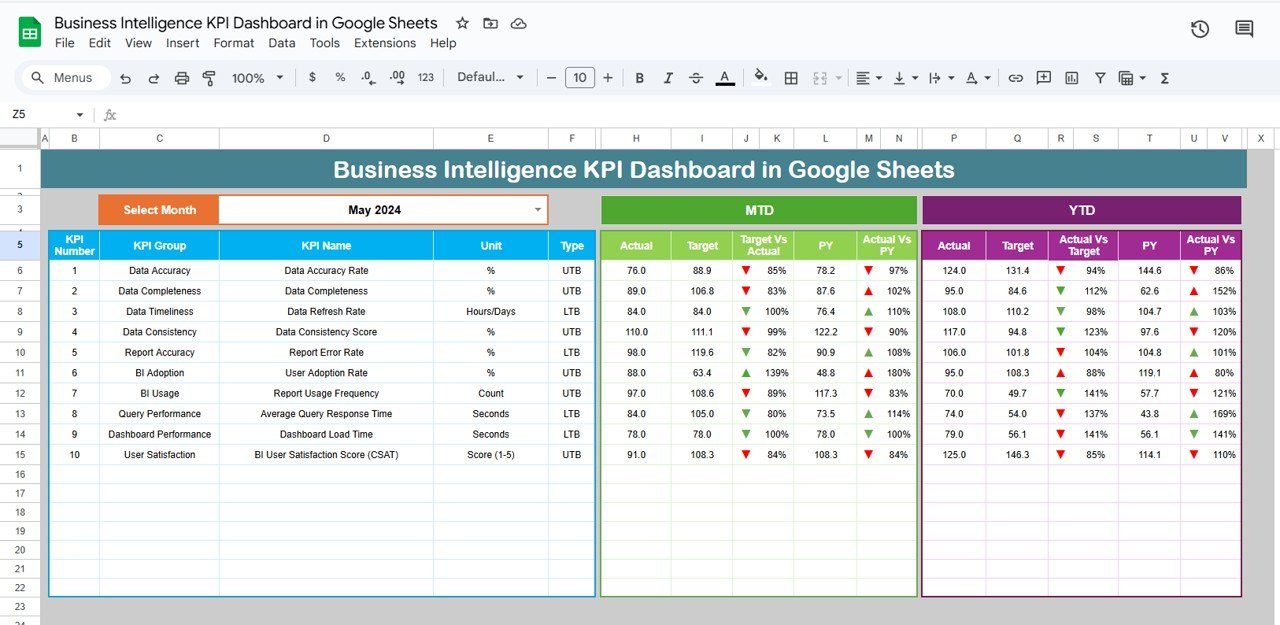
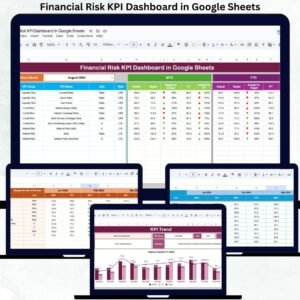
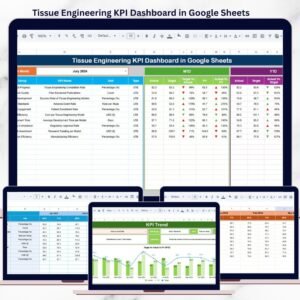
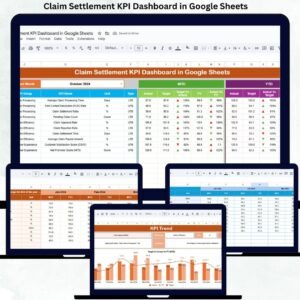
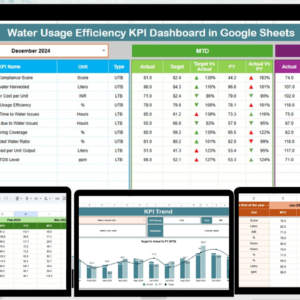
🖥️ Dashboard Sheet Tab (Main Dashboard)
This is the primary analytical view. You select the reporting month from the dropdown in cell D3, and the entire dashboard updates automatically.
It displays:
MTD Metrics
-
Actual
-
Target
-
Previous Year
-
Target vs Actual
-
Previous Year vs Actual
YTD Metrics
-
Actual
-
Target
-
Previous Year
-
Target vs Actual
-
Previous Year vs Actual
This makes the dashboard ideal for leadership reviews and monthly performance meetings.
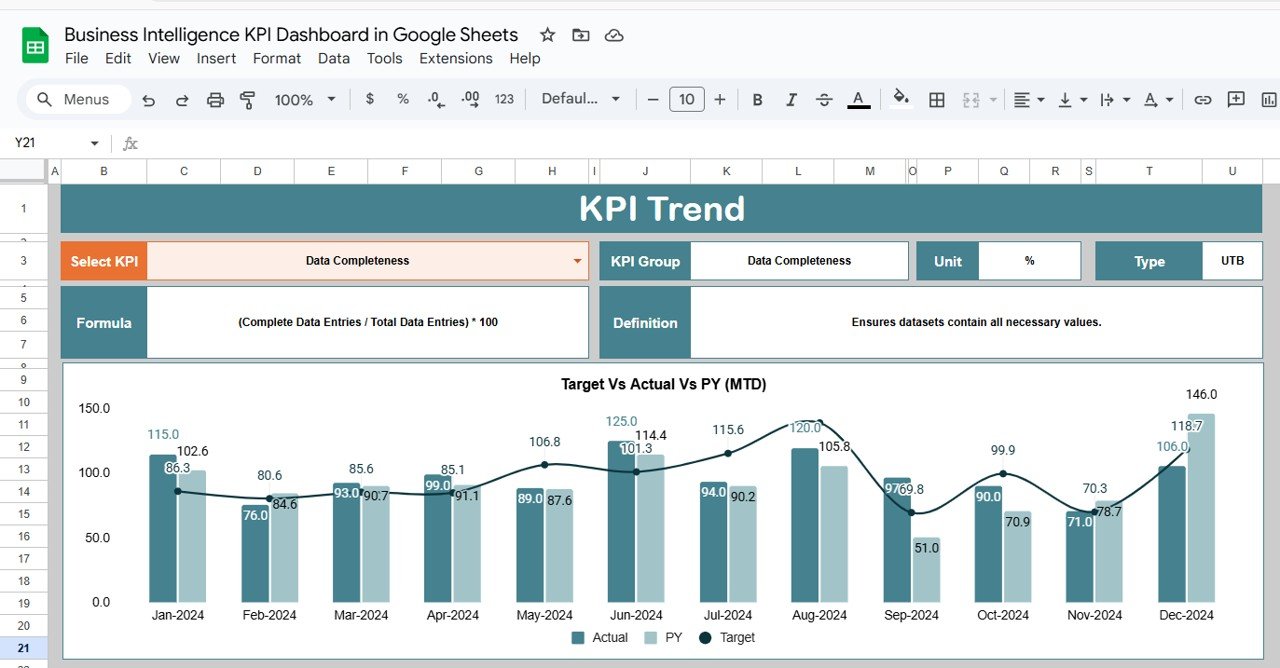
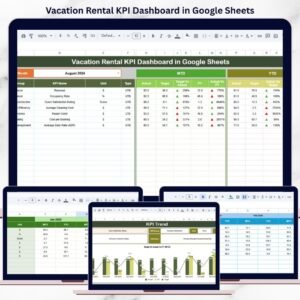
📉 KPI Trend Sheet Tab
This sheet supports KPI-level trend analysis. Select a KPI from the dropdown in cell C3, and the sheet displays:
-
KPI Group
-
KPI Unit
-
KPI Type (Lower the Better / Upper the Better)
-
KPI Formula
-
KPI Definition
It also shows month-wise trends to help teams understand performance movement over time.
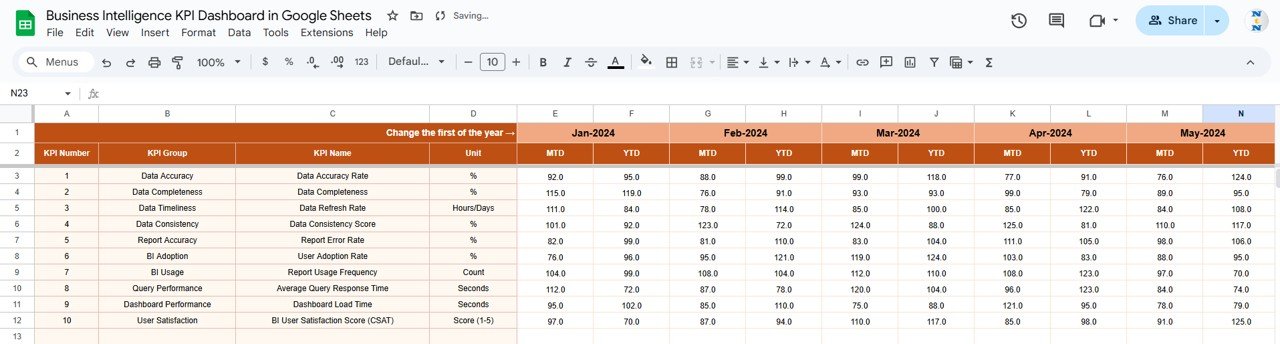
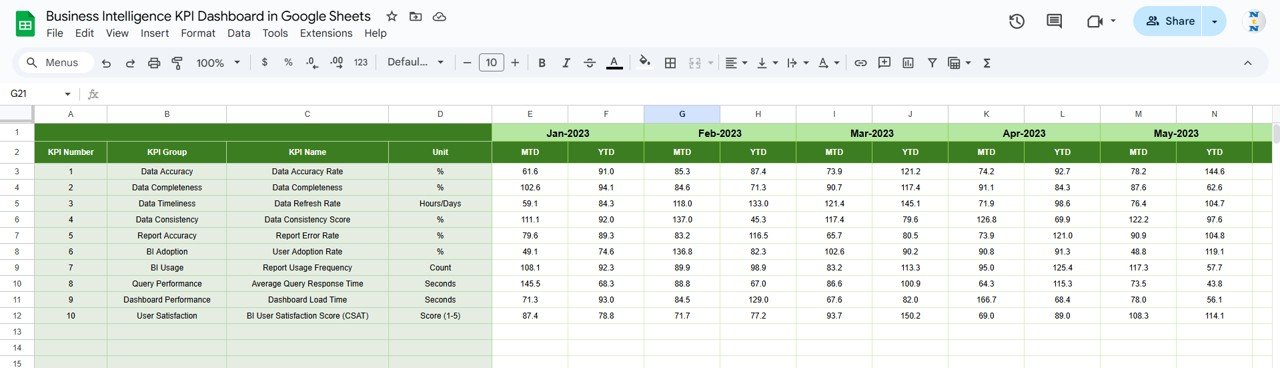
📋 Actual Number Sheet Tab
This sheet stores all actual KPI values.
-
Select the first month of the year in cell E1
-
Enter monthly MTD and YTD actual values
-
All dashboard calculations update automatically
This structure ensures consistent and accurate data entry.
🎯 Target Sheet Tab
This sheet captures MTD and YTD targets for every KPI. Targets help teams:
-
Measure performance gaps
-
Set realistic goals
-
Align KPIs with business strategy
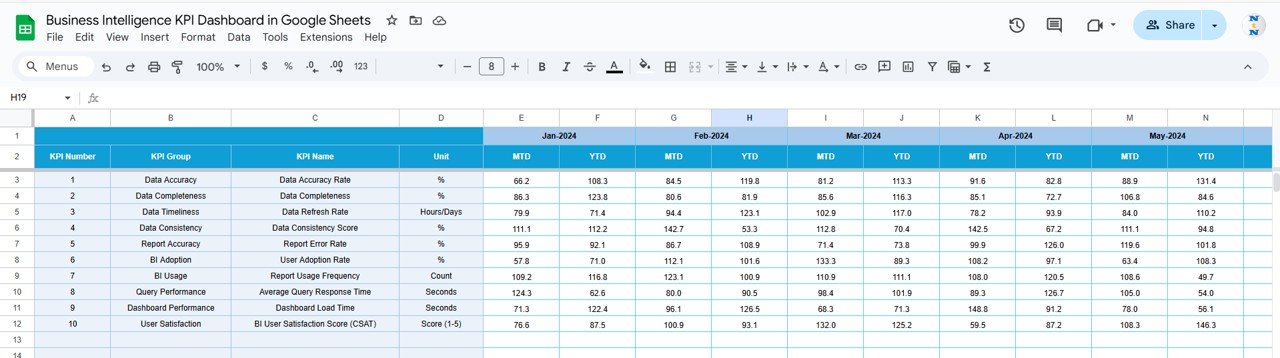
📆 Previous Year Number Sheet Tab
This sheet stores last year’s KPI values. The dashboard uses this data to:
-
Perform year-over-year comparisons
-
Track historical performance
-
Identify long-term trends
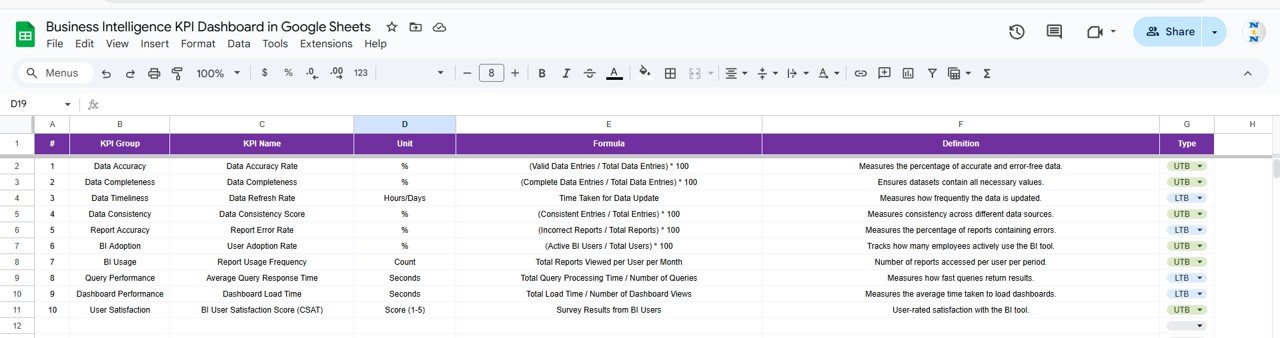
📘 KPI Definition Sheet Tab
This is the foundation of the dashboard. It includes:
-
KPI Name
-
KPI Group
-
Unit
-
Formula
-
KPI Definition
-
KPI Type (LTB / UTB)
It ensures transparency, clarity, and consistency across teams.
🛠️ How to Use the Business Intelligence KPI Dashboard in Google Sheets
1️⃣ Define Your KPIs
Customize KPI names, formulas, and types in the KPI Definition sheet.
2️⃣ Enter Actual Performance Data
Update actual KPI values monthly in the Actual Number sheet.
3️⃣ Set Targets Clearly
Add MTD and YTD targets in the Target sheet.
4️⃣ Select the Reporting Month
Use the dropdown in the Dashboard sheet to refresh all metrics instantly.
5️⃣ Analyze Trends & Take Action
Use the KPI Trend sheet to identify risks, improvements, and opportunities.
🎯 Who Can Benefit from This Business Intelligence KPI Dashboard
🏢 Executives & Senior Management
Get a high-level performance overview without complex BI tools.
📊 Business Analysts & Strategy Teams
Analyze trends, benchmarks, and performance gaps easily.
💼 Operations & Finance Teams
Monitor efficiency, productivity, and financial KPIs consistently.
🚀 Startups & Growing Businesses
Use a cost-effective BI solution to scale performance tracking.
🤝 Cross-Functional Teams
Align departments using one shared performance dashboard.
### Click here to read the Detailed blog post
Watch the step-by-step video tutorial:


Reviews
There are no reviews yet.