🚀 Turn Your Business Data Into Powerful Insights Instantly!
Are you struggling with scattered reports, slow decision-making, and complex data? Imagine having all your business insights in one place—clear, interactive, and ready to use.
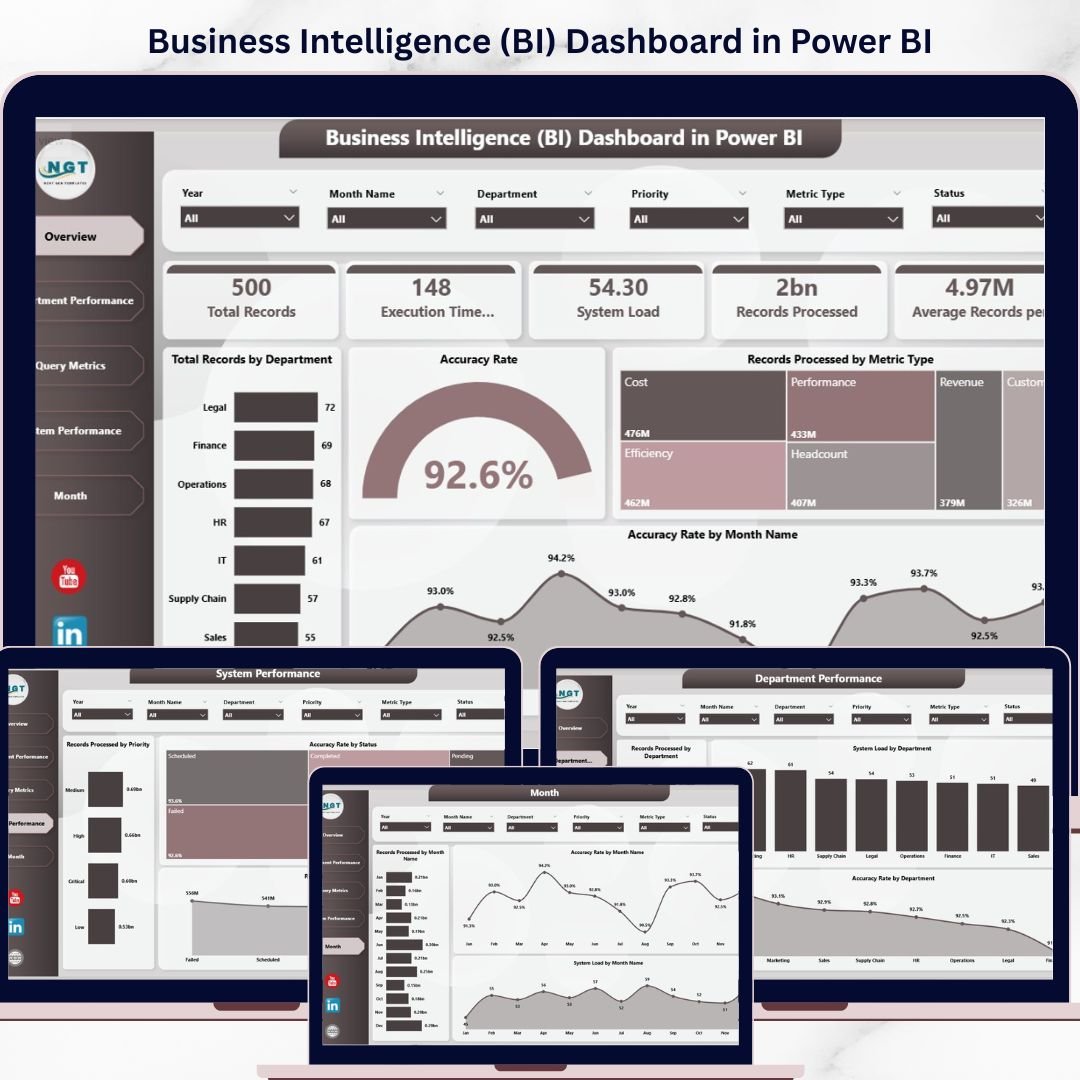
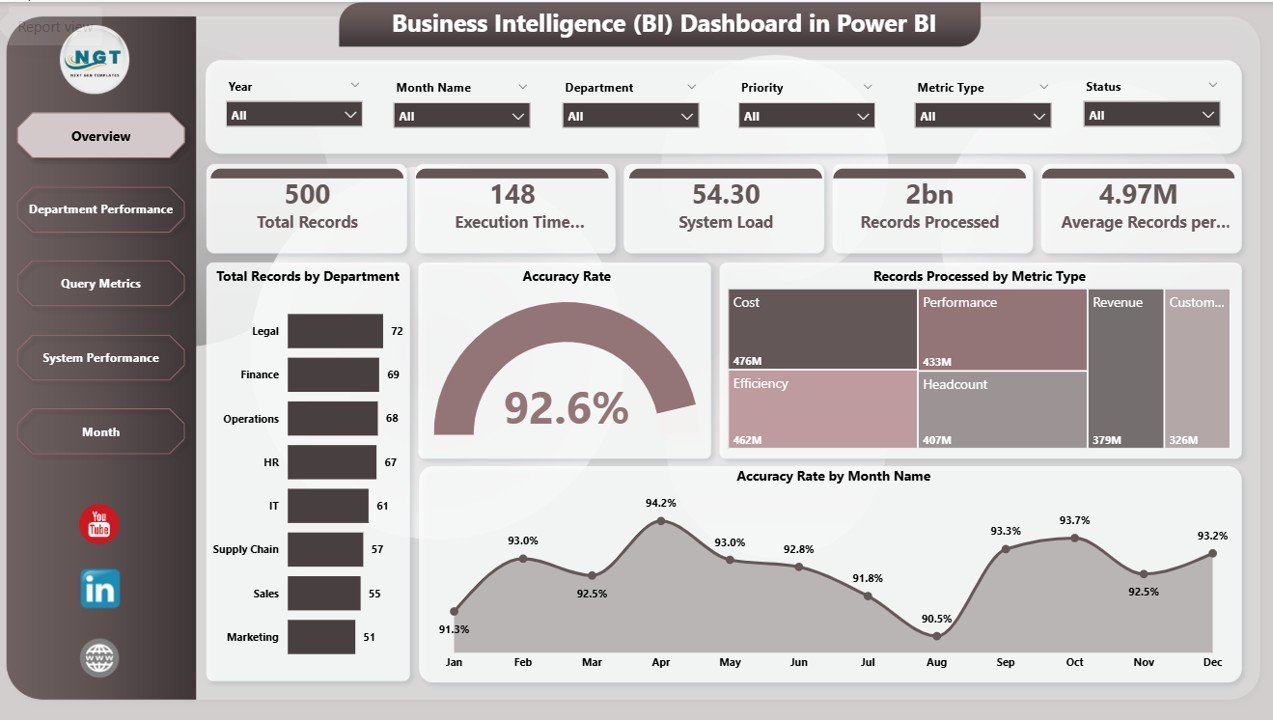
👉 The Business Intelligence (BI) Dashboard in Power BI is the ultimate solution to transform raw data into meaningful insights that drive smarter decisions and business growth.
This ready-to-use dashboard is designed for modern businesses that rely on data to stay competitive. Instead of juggling multiple spreadsheets and reports, you can monitor KPIs, track performance, and identify trends—all in one centralized dashboard.
With just a simple refresh, your data comes alive through dynamic visuals, helping you take action faster and more confidently.
🔑 Key Features of Business Intelligence (BI) Dashboard in Power BI
✨ Interactive Multi-Page Dashboard – Analyze business data across Overview, Department, Query Metrics, System Performance, and Monthly Analysis pages.
📊 Powerful KPI Tracking – Monitor key metrics like Accuracy Rate %, Records Processed, and Department Performance.
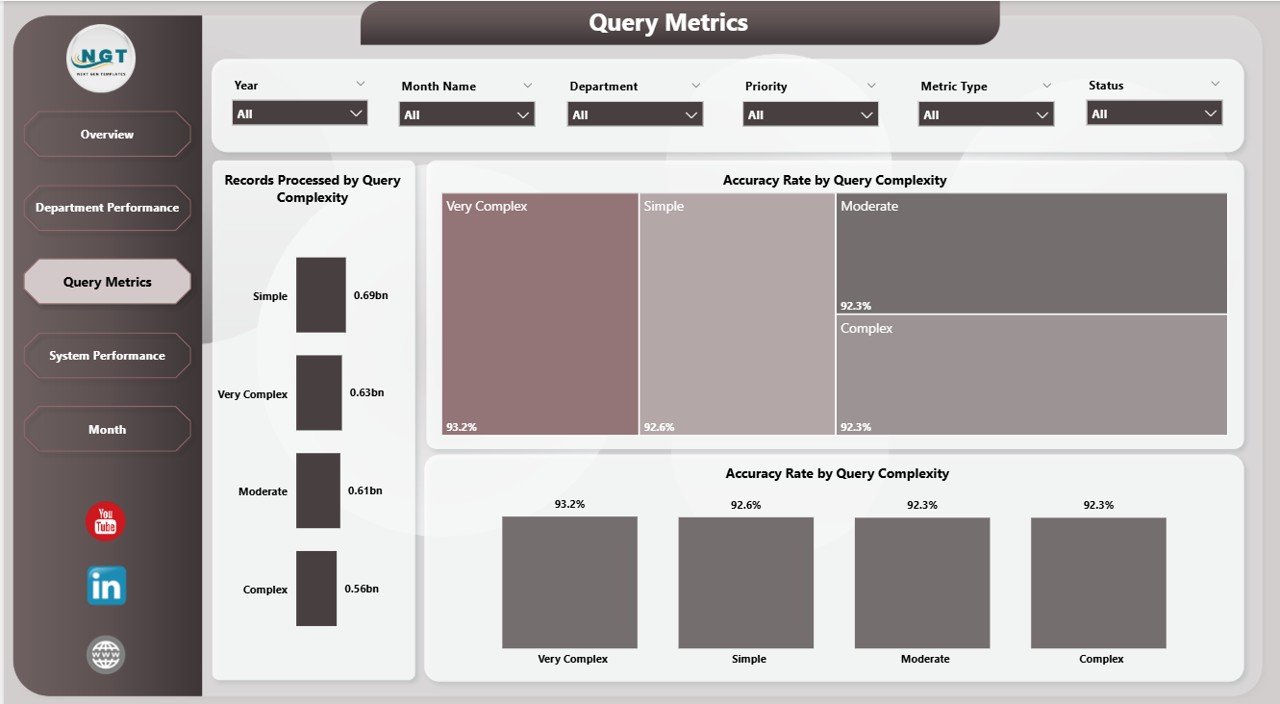
🎯 Advanced Slicers & Filters – Customize views by department, priority, and query complexity.
📈 Dynamic Visualizations – Understand trends and patterns with intuitive charts and graphs.
⚡ Real-Time Data Refresh – Update your data instantly with one click.
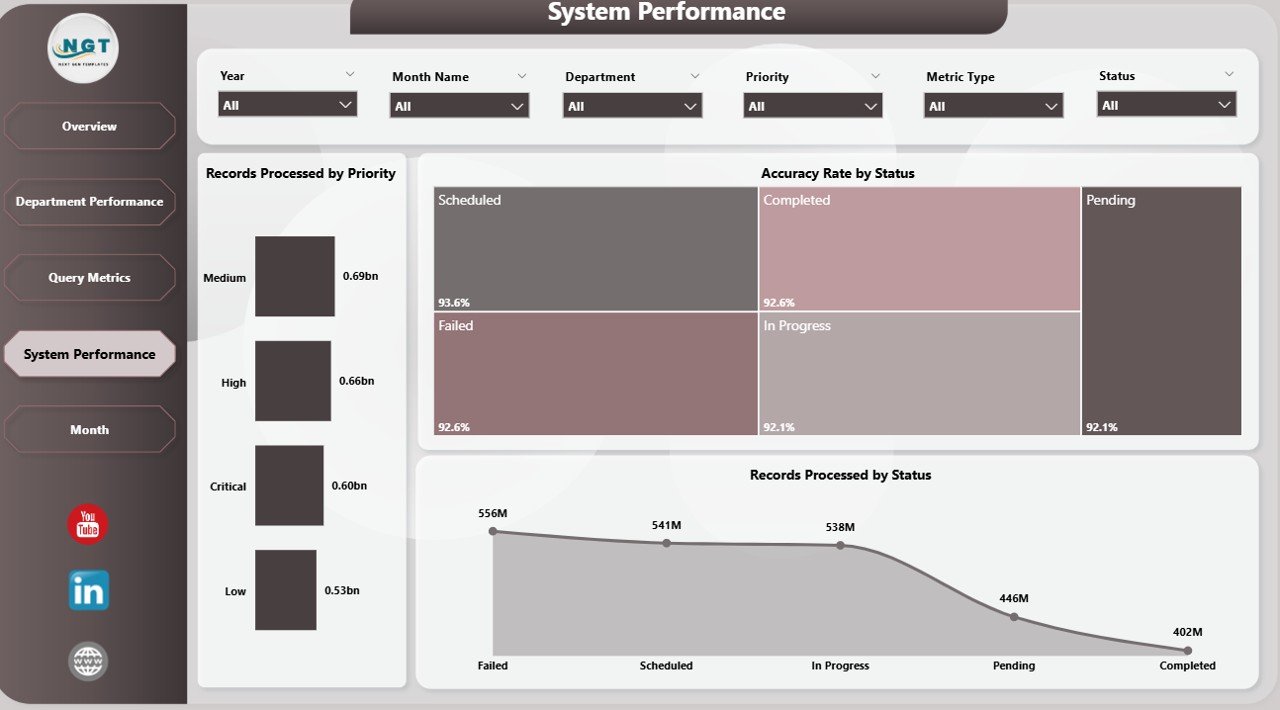
🔍 Deep Performance Insights – Identify inefficiencies and optimize operations.
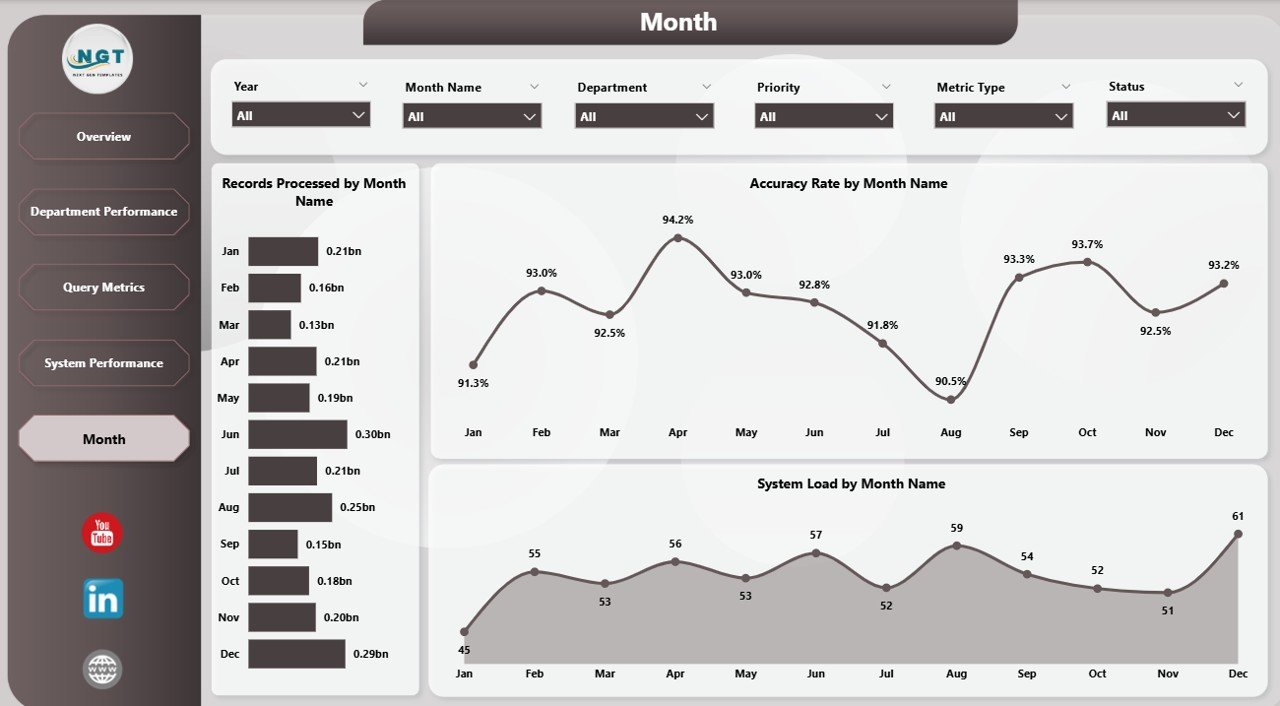
📅 Monthly Trend Analysis – Track performance over time and forecast growth opportunities.
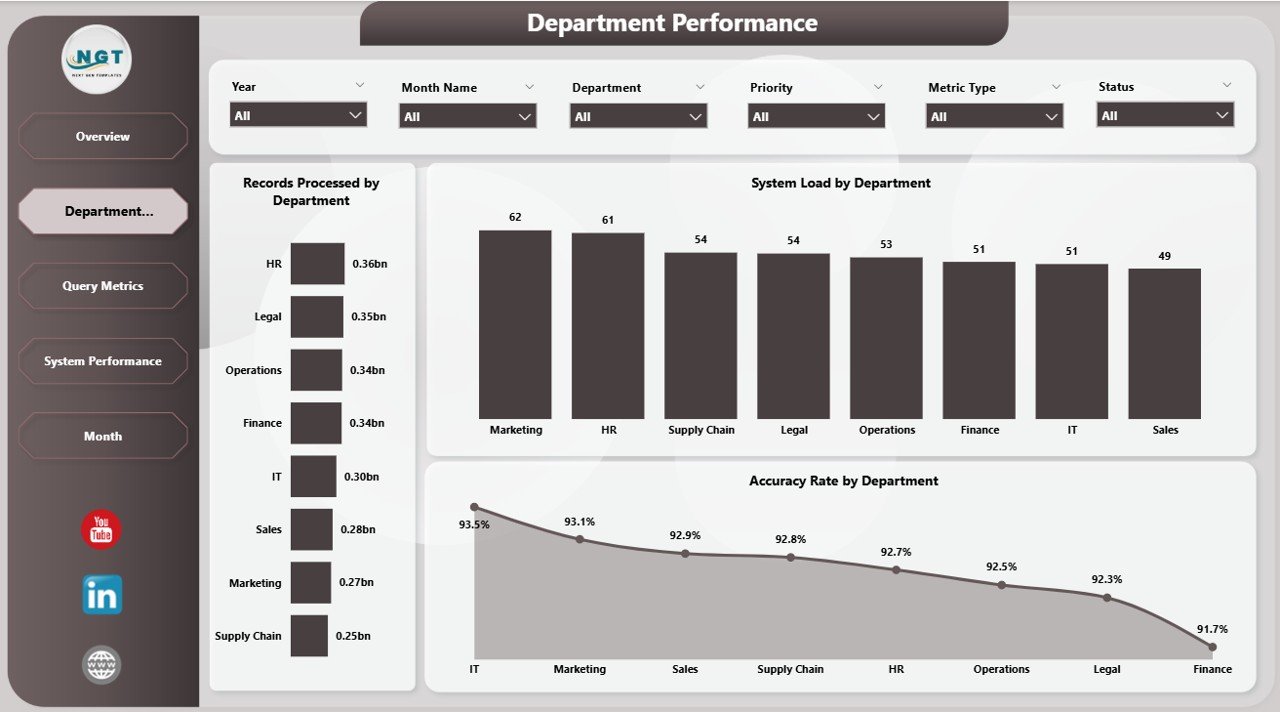
🏢 Department-Level Analysis – Compare team performance and improve resource allocation.
📦 What’s Inside the Business Intelligence (BI) Dashboard in Power BI
📁 5 Fully Interactive Dashboard Pages
- Overview Dashboard
- Department Performance Analysis
- Query Metrics Analysis
- System Performance Monitoring
- Monthly Trend Analysis
📊 Pre-Built Charts & KPIs
- Accuracy Rate %
- Records Processed by Department
- System Load by Department
- Query Complexity Analysis
- Monthly Performance Trends
🎛️ Interactive Slicers & Filters
- Filter by Department
- Filter by Priority
- Filter by Query Complexity
📂 Ready-to-Use Power BI File
- Fully designed dashboard
- Plug-and-play setup
- Easy customization
⚙️ How to Use the Business Intelligence (BI) Dashboard in Power BI
1️⃣ Download and open the Power BI file
2️⃣ Connect or replace with your business dataset
3️⃣ Click on Refresh to update visuals instantly
4️⃣ Use slicers to filter and explore data
5️⃣ Analyze KPIs and trends to make informed decisions
💡 No coding or advanced technical skills required—this dashboard is built for simplicity and efficiency.
👥 Who Can Benefit from This Business Intelligence (BI) Dashboard in Power BI
👨💼 Business Managers – Monitor performance and make strategic decisions
📊 Data Analysts – Perform deep analysis and uncover insights
💻 IT Teams – Track system performance and optimize operations
🏢 Department Heads – Evaluate team performance and improve efficiency
📈 Executives – Gain a high-level overview of business performance
This dashboard simplifies complex business data into clear, actionable insights. As a result, you can improve productivity, enhance decision-making, and drive business growth.
Instead of wasting time on manual reporting, you can focus on what truly matters—growing your business with data-driven strategies.
📖 Click here to read the Detailed blog post
🎥 Visit our YouTube channel to learn step-by-step video tutorials
👉 https://youtube.com/@PKAnExcelExpert


